

Clinical Value of Hybrid TOF-PET/MR Imaging-Based Multiparametric Imaging in Localizing Seizure Focus in Patients with MRI-Negative Temporal Lobe Epilepsy
- PMID: 30237304
- PMCID: PMC7410737
- DOI: 10.3174/ajnr.A5814
Clinical Value of Hybrid TOF-PET/MR Imaging-Based Multiparametric Imaging in Localizing Seizure Focus in Patients with MRI-Negative Temporal Lobe Epilepsy
Abstract
Background and purpose: Temporal lobe epilepsy is the most common type of epilepsy. Early surgical treatment is superior to prolonged medical therapy in refractory temporal lobe epilepsy. Successful surgical operations depend on the correct localization of the epileptogenic zone. This study aimed to evaluate the clinical value of hybrid TOF-PET/MR imaging-based multiparametric imaging in localizing the epileptogenic zone in patients with MR imaging-negative for temporal lobe epilepsy.
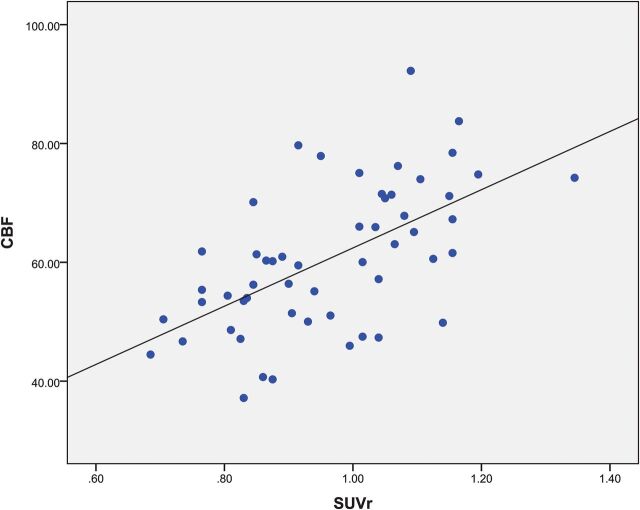
Materials and methods: Twenty patients with MR imaging-negative temporal lobe epilepsy who underwent preoperative evaluation and 10 healthy controls were scanned using PET/MR imaging with simultaneous acquisition of PET and arterial spin-labeling. On the basis of the standardized uptake value and cerebral blood flow, receiver operating characteristic analysis and a logistic regression model were used to evaluate the predictive value for the localization. Statistical analyses were performed using statistical parametric mapping. The values of the standardized uptake value and cerebral blood flow, as well as the asymmetries of metabolism and perfusion, were compared between the 2 groups. Histopathologic findings were used as the criterion standard.
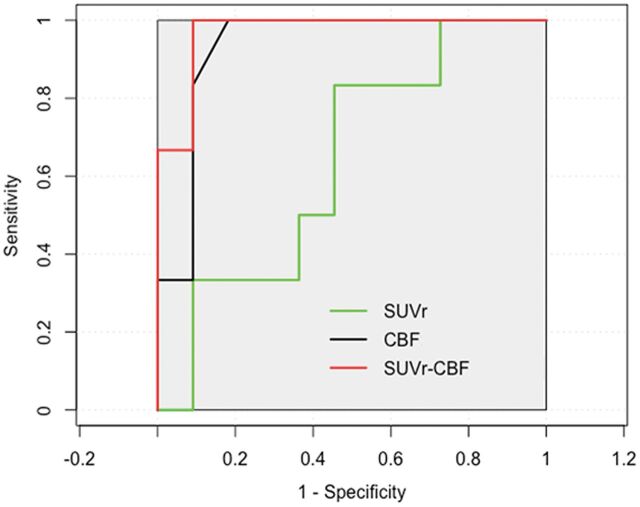
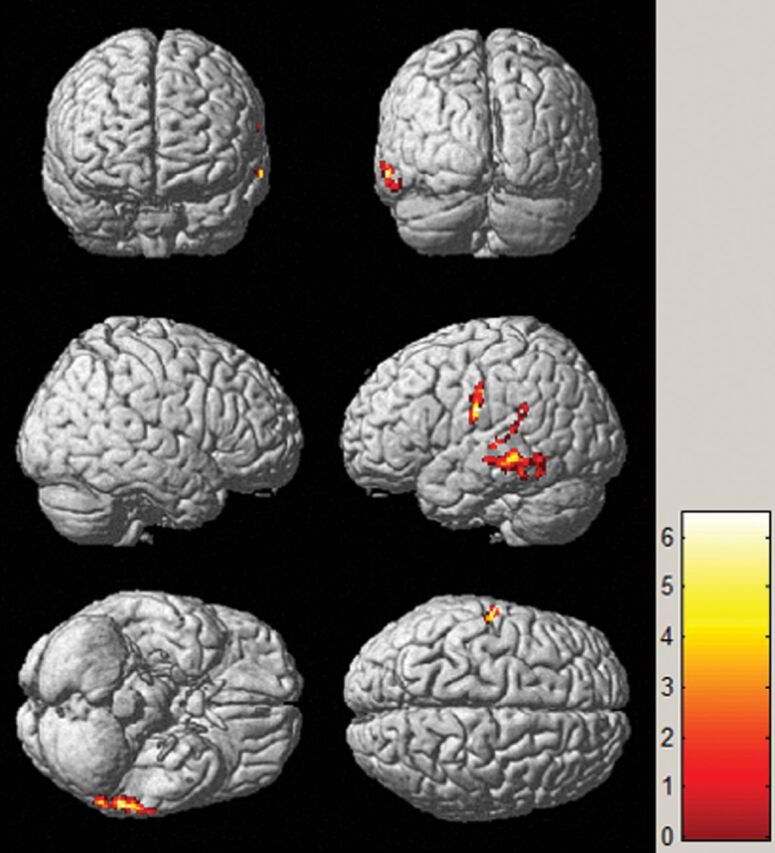
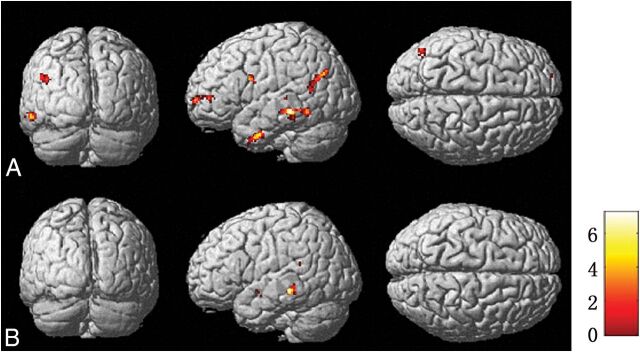
Results: Complete concordance was noted in lateralization and localization among the PET, arterial spin-labeling, and histopathologic findings in 12/20 patients based on visual assessment. Concordance with histopathologic findings was also obtained for the remaining 8 patients based on the complementary PET and arterial spin-labeling information. Receiver operating characteristic analysis showed that the sensitivity and specificity of PET, arterial spin-labeling, and combined PET and arterial spin-labeling were 100% and 81.8%, 83.3% and 54.5%, and 100% and 90.9%, respectively. When we compared the metabolic abnormalities in patients with those in healthy controls, hypometabolism was detected in the middle temporal gyrus (P < .001). Metabolism and perfusion asymmetries were also located in the temporal lobe (P < .001).
Conclusions: PET/MR imaging-based multiparametric imaging involving arterial spin-labeling may increase the clinical value of localizing the epileptogenic zone by providing concordant and complementary information in patients with MR imaging-negative temporal lobe epilepsy.
© 2018 by American Journal of Neuroradiology.
Figures
Similar articles
-
Detection of mesial temporal lobe hypoperfusion in patients with temporal lobe epilepsy by use of arterial spin labeled perfusion MR imaging.AJNR Am J Neuroradiol. 2001 Aug;22(7):1334-41. AJNR Am J Neuroradiol. 2001. PMID: 11498422 Free PMC article.
-
Cerebral metabolism and perfusion in MR-negative individuals with refractory focal epilepsy assessed by simultaneous acquisition of (18)F-FDG PET and arterial spin labeling.Neuroimage Clin. 2016 Apr 12;11:648-657. doi: 10.1016/j.nicl.2016.04.005. eCollection 2016. Neuroimage Clin. 2016. PMID: 27222796 Free PMC article.
-
Simultaneously Acquired MRI Arterial Spin-Labeling and Interictal FDG-PET Improves Diagnosis of Pediatric Temporal Lobe Epilepsy.AJNR Am J Neuroradiol. 2022 Mar;43(3):468-473. doi: 10.3174/ajnr.A7421. Epub 2022 Feb 24. AJNR Am J Neuroradiol. 2022. PMID: 35210273 Free PMC article.
-
Neuroimaging methods in Epilepsy of Temporal Origin.Curr Med Imaging Rev. 2019;15(1):39-51. doi: 10.2174/1573405613666170622114920. Curr Med Imaging Rev. 2019. PMID: 31964326 Review.
-
Neuroimaging techniques in epilepsy.Hong Kong Med J. 2010 Aug;16(4):292-8. Hong Kong Med J. 2010. PMID: 20683073 Review.
Cited by
-
[18F]FDG PET/MRI and magnetoencephalography may improve presurgical localization of temporal lobe epilepsy.Eur Radiol. 2022 May;32(5):3024-3034. doi: 10.1007/s00330-021-08336-4. Epub 2021 Oct 14. Eur Radiol. 2022. PMID: 34651211
-
Detection of Crossed Cerebellar Diaschisis in Intractable Epilepsy Using Integrated 18F-FDG PET/MR Imaging.Cerebellum. 2024 Dec 21;24(1):18. doi: 10.1007/s12311-024-01759-x. Cerebellum. 2024. PMID: 39707060
-
Multiparametric imaging hippocampal neurodegeneration and functional connectivity with simultaneous PET/MRI in Alzheimer's disease.Eur J Nucl Med Mol Imaging. 2020 Sep;47(10):2440-2452. doi: 10.1007/s00259-020-04752-8. Epub 2020 Mar 10. Eur J Nucl Med Mol Imaging. 2020. PMID: 32157432 Free PMC article.
-
Emerging Trends in Neuroimaging of Epilepsy.Epilepsy Curr. 2021 Mar;21(2):79-82. doi: 10.1177/1535759721991161. Epub 2021 Feb 9. Epilepsy Curr. 2021. PMID: 33557612 Free PMC article.
-
Arterial spin labeling perfusion MRI applications in drug-resistant epilepsy and epileptic emergency.Acta Epileptol. 2023 Sep 28;5(1):23. doi: 10.1186/s42494-023-00134-3. Acta Epileptol. 2023. PMID: 40217550 Free PMC article. Review.
References
Publication types
MeSH terms
Substances
LinkOut - more resources
Full Text Sources
Other Literature Sources