. 2018 Sep 20;9(1):3825.
doi: 10.1038/s41467-018-06367-y.

Frustrated endocytosis controls contractility-independent mechanotransduction at clathrin-coated structures

Affiliations

Frustrated endocytosis controls contractility-independent mechanotransduction at clathrin-coated structures

Francesco Baschieri et al. Nat Commun. .

Abstract

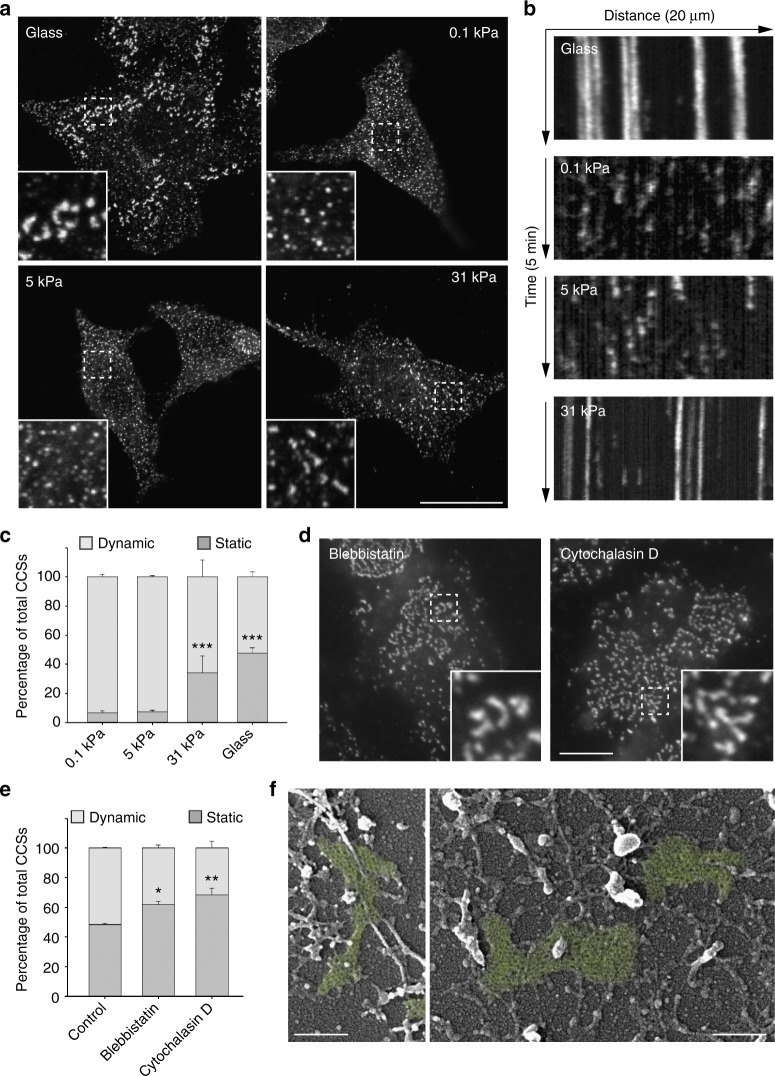
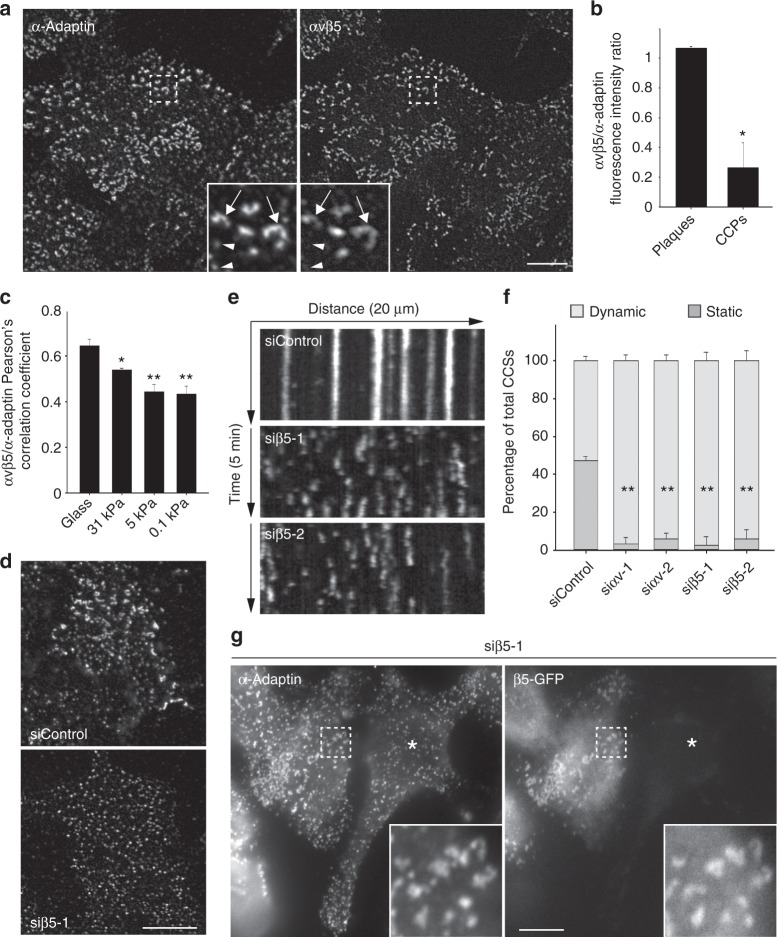
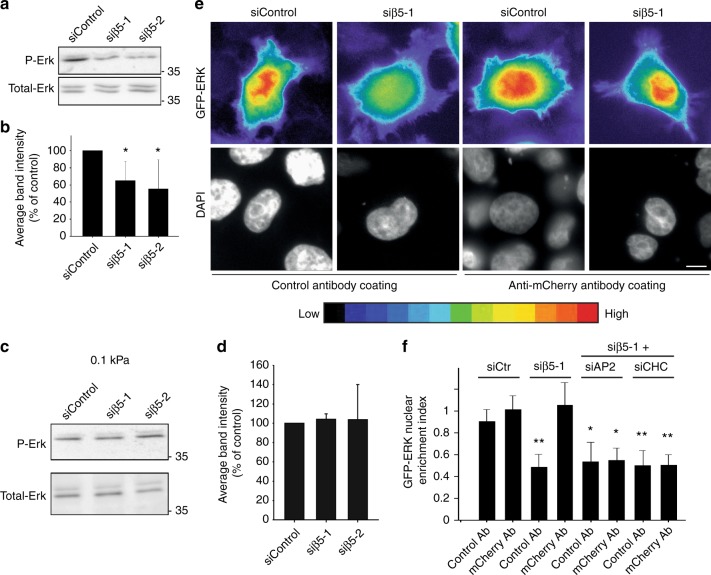
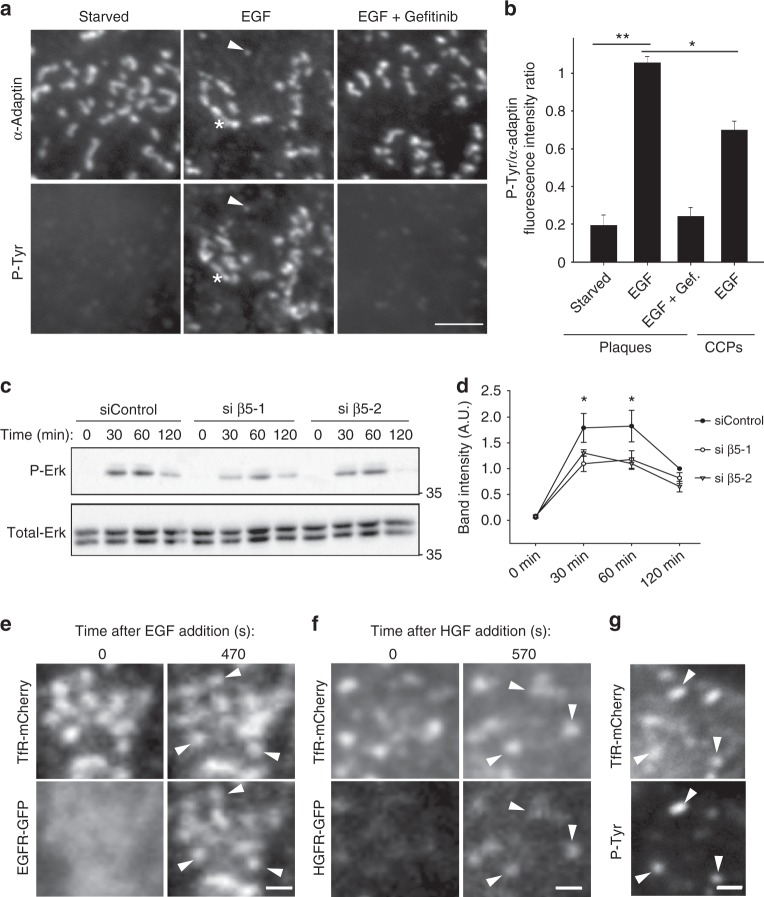
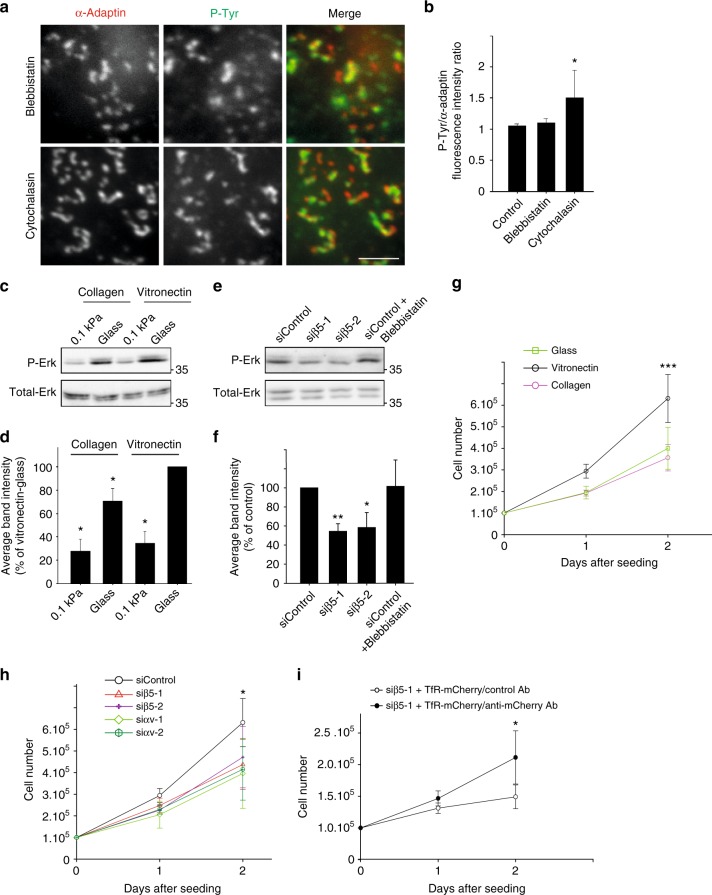
It is generally assumed that cells interrogate the mechanical properties of their environment by pushing and pulling on the extracellular matrix (ECM). For instance, acto-myosin-dependent contraction forces exerted at focal adhesions (FAs) allow the cell to actively probe substrate elasticity. Here, we report that a subset of long-lived and flat clathrin-coated structures (CCSs), also termed plaques, are contractility-independent mechanosensitive signaling platforms. We observed that plaques assemble in response to increasing substrate rigidity and that this is independent of FAs, actin and myosin-II activity. We show that plaque assembly depends on αvβ5 integrin, and is a consequence of frustrated endocytosis whereby αvβ5 tightly engaged with the stiff substrate locally stalls CCS dynamics. We also report that plaques serve as platforms for receptor-dependent signaling and are required for increased Erk activation and cell proliferation on stiff environments. We conclude that CCSs are mechanotransduction structures that sense substrate rigidity independently of cell contractility.


Conflict of interest statement

The authors declare no competing interests.

Figures

Fig. 1
Fig. 1
Clathrin-coated plaques are mechanosensitive structures. a HeLa cells were seeded on collagen-coated glass or polyacrylamide gels of indicated stiffness and fixed 24 h later before being stained for α-adaptin. Scale bar: 15 µm. Higher magnifications of boxed regions are shown. b Kymographs showing CCS dynamics in genome-edited HeLa cells expressing endogenous GFP-tagged μ2-adaptin seeded on the indicated collagen-coated substrate and imaged by spinning disk microscopy every 5 s for 5 min. c Quantification of the dynamics of CCSs observed as in b (***P < 0.001, as compared to 0.1 kPa condition, one-way analysis of variance—ANOVA. n = 3). d HeLa cells seeded on collagen-coated glass were treated with Blebbistatin or Cytochlalasin D as indicated for 30 min before being fixed and stained for α-adaptin. Scale bar: 10 µm. Higher magnifications of boxed regions are shown. e Quantification of the dynamics of CCSs observed as in d (**P < 0.01, *P < 0.05, ANOVA. n = 3). f EM micrographs of unroofed HeLa cells that were cultured on glass and treated for 30 min with blebbistatin before being fixed and processed. Clathrin-coated plaques are highlighted in green. Scale bar: 200 nm. All results are expressed as mean ± SD
Fig. 2
Fig. 2
αvβv5 integrin localizes to plaques and is required for their assembly. a HeLa cells were seeded on collagen-coated glass and fixed 24 h later before being stained for α-adaptin and αvβ5-integrin. Scale bar: 10 µm. Higher magnifications of boxed regions are shown. Arrows point to clathrin-coated plaques; arrowheads point to CCPs. b Quantification of αvβ5 enrichment at plaques versus CCPs (*P < 0.005, two tailed Student’s t-test. n = 3; 100 structures per experiment were counted.). c Quantification of colocalization (Pearson’s coefficient) between αvβ5 and α-adaptin in cells cultured on the indicated collagen-coated substrate (*P < 0.005; **P < 0.001, one-way analysis of variance—ANOVA. n = 3). d HeLa cells treated with control (upper panel) or β5-specific (lower panel) siRNAs were seeded on collagen-coated glass and fixed 24 h later before being stained for α-adaptin. Scale bar: 15 µm. e Kymographs showing CCS dynamics in genome-edited HeLa cells treated with the indicated siRNA, seeded on collagen-coated glass, and imaged by spinning disk microscopy every 5 s for 5 min. f Quantification of the dynamics of CCSs observed as in e and treated with the indicated siRNAs (**P < 0.001, ANOVA. n = 3). g HeLa cells treated with β5-specific siRNAs were transfected with a siRNA-resistant β 5-GFP encoding construct and then fixed 24 h later before being stained for α-adaptin. Scale bar: 10 µm. The star marks a cell that is not transfected by β5-GFP. Higher magnifications of boxed regions are shown. All results are expressed as mean ± SD
Fig. 3
Fig. 3
Clathrin-coated plaques assemble as a consequence of frustrated endocytosis. a Genome-edited HeLa cells expressing endogenous mCherry-tagged μ2-adaptin, seeded on collagen-coated glass, were treated with trypsin and imaged by spinning disk microscopy every 5 s. Time after trypsin addition is indicated in seconds. Arrowheads point to dot-like structure emanating from the disassembling plaques. Scale bar: 1 μm. b Kymographs showing plaque disassembly dynamics and concomitant GFP-auxillin bursts in HeLa cell treated and imaged as in a. Note that loss of μ2-adaptin-associated fluorescence is correlated with auxillin flashes. c Quantification of the number of auxillin flashes per plaque and per minute in HeLa cells before and after incubation with trypsin. Results are expressed as mean ± SD (*P < 0.001, Mann–Whitney rank sum test. A total of 90 structures from three independent experiments was quantified). d Genome-edited HeLa cells expressing endogenous mCherry-tagged μ2-adaptin, seeded on collagen-coated glass, were treated with Cilengitide and imaged by spinning disk microscopy every 5 s. Time after Cilengitide addition is indicated in seconds. Arrowheads point to dot-like structure emanating from the disassembling plaques. Scale bar: 1 μm. e Genome-edited HeLa cells treated with β5-specific siRNA and transfected with a construct encoding mCherry-tagged TfR were seeded on anti-mCherry antibodies-coated glass and imaged 24 h later by spinning disk microscopy every 5 s. Scale bar: 10 μm. f Kymograph showing CCS dynamics in the region corresponding to the boxed area in e. Note that the cell on the left is not transfected by the TfR-mCherry construct and only display dynamic CCSs. g Quantification of the dynamics of CCSs observed as in e in genome-edited HeLa cells expressing the TfR-mCherry construct and treated as indicated (*P < 0.001, one-way analysis of variance—ANOVA. n = 3). Results are expressed as mean ± SD
Fig. 4
Fig. 4
Clathrin-coated plaques regulate stiffness-dependent Erk signaling. a Western-blot analysis of phospho-Erk (P-Erk) levels in HeLa cells growing on collagen-coated glass and treated with control or β5-specific siRNAs as indicated (representative image of four independent experiments). Total-Erk was used as a loading control. b Densitometry analysis of bands obtained in western-blots as in a. Results are expressed as mean ± SD from four independent experiments (*P < 0.05, one-way analysis of variance—ANOVA). c Western-blot analysis of phospho-Erk (P-Erk) levels in HeLa cells growing on collagen-coated, 0.1 kPa polyacrylamide gels and treated with control or integrin β5-specific siRNAs, as indicated. Total-Erk was used as a loading control (representative image of three independent experiments) d Densitometry analysis of bands obtained in western-blots as in c. Results are expressed as mean ± SD from three independent experiments. e GFP-Erk-expressing HeLa cells treated or not with a β5-specific siRNA and transfected or not with TfR-mCherry, as indicated, were seeded on anti-mCherry antibodies-coated glass and imaged 24 h later. Scale bar: 10 µm. A color-coded scale for low and high signal intensity is shown. f Quantification of GFP-Erk nuclear enrichment index in cells as in e and cultured on control antibody- or anti-mCherry antibody-coated glass, as indicated, and treated or not with indicated siRNAs. Results are expressed as mean ± SD (*P < 0.01, **P < 0.001, ANOVA. ControlAb-siCtr: 114 cells from n = 5 independent experiments; mChAb-SiCtrl: 119 cells from n = 5 independent experiments; ControAb-siβ5-1: 146 cells from n = 5 independent experiments; mChAb-Siβ5-1: 120 cells from n = 5 independent experiments; ControlAb-siβ5-1 + siAP-2: 69 cells from n = 3 independent experiments; mChAb-siβ5-1 + siAP-2: 68 cells from n = 3 independent experiments; ControlAb-siβ5-1 + siCHC: 63 cells from n = 3 independent experiments; mChAb-siβ5-1 + siCHC: 67 cells from n = 3 independent experiments)
Fig. 5
Fig. 5
Clathrin-coated plaques locally regulate receptor-dependent Erk signaling. a HeLa cells seeded on collagen-coated glass were starved for 4 h and then treated or not with 10 ng/ml EGF for 5 min alone or added after 30 min preincubation with 10 µM Gefitinib. Cells were then fixed and stained for α-adaptin and phosphotyrosines. The arrowhead points to one CCP and the star marks a plaque. Scale bar: 2 μm. b Quantification of phosphotyrosines accumulation at plaques or CCPs in the indicated conditions. Results are expressed as mean ± SD (*P < 0.05, **P < 0.001, one-way analysis of variance—ANOVA. n = 3. Number of structures analyzed per condition: Starved 160 plaques; EGF: 452 plaques, EGF + Gefitinib: 301 plaques, CCPs/EGF: 200 pits). c Western-blot analysis of phospho-Erk (P-Erk) levels in starved HeLa cells treated with control or β5-specific siRNAs as indicated, and stimulated for the indicated time with 10 ng/ml EGF. Total-Erk was used as a loading control (representative image of three independent experiments). d Densitometry analysis of bands obtained in western-blots as in c. Results are expressed as mean ± SD (*P < 0.05, ANOVA. n = 3). e HeLa cells treated with β5-specific siRNAs were transfected with plasmids encoding for TfR-mCherry and EGFR-GFP and seeded on anti-mCherry antibodies-coated glass. Cells were serum-starved for 4 h and then treated with 10 ng/ml EGF for 470 s. Scale bar: 0.5 μm. Arrowheads point to plaques positive for EGFR-GFP. f HeLa cells treated with β5-specific siRNA were transfected with plasmids encoding for TfR-mCherry and HGFR-GFP and seeded on anti-mCherry antibodies-coated glass. Cells were serum-starved for 4 h and then treated with 50 ng/ml HGF for 570 s. Scale bar: 0.5 μm. Arrowheads point to plaques positive for HGFR-GFP. g HeLa cells treated with β5-specific siRNA were transfected with plasmids encoding for TfR-mCherry and seeded on anti-mCherry antibodies-coated glass. Cells were serum-starved for 4 h and then treated with 10 ng/ml EGF for 5 min prior to fixation and staining for phosphotyrosines. Scale bar: 1.5 μm. Arrowheads point to plaques positive for P-Tyr
Fig. 6
Fig. 6
Signaling at plaques is contractility-independent and regulate cell proliferation. a HeLa cells on collagen-coated glass were treated for 1 h with 10 µM Blebbistatin or 10 µM Cytochalasin D prior to be fixed and stained for α-adaptin (red) and phosphotyrosines (P-Tyr, green). Scale bar: 3 μm. b, Quantification of phosphotyrosines accumulation at plaques in cells treated as in a, as indicated (*P < 0.05, one-way analysis of variance—ANOVA. Control: 402 plaques from n = 3 independent experiments; Blebbistatin: 303 plaques from n = 3 independent experiments; Cytochalasin: 302 plaques from n = 3 independent experiments). c Western-blot analysis of phospho-Erk (P-Erk) levels in HeLa cells cultured on collagen- or vitronectin-coated glass or 0.1 kPa polyacrylamide gels, as indicated. Total-Erk was used as a loading control (representative image of three independent experiments). d Densitometry analysis of bands obtained in western-blots as in c (*P < 0.05, ANOVA. n = 3). e Western-blot analysis of phospho-Erk (P-Erk) levels in HeLa cells growing on collagen-coated glass and treated with control or integrin β5-specific siRNAs and incubated or not with 10 µM Blebbistatin for 1 h, as indicated. Total-Erk was used as a loading control (representative image of three independent experiments). f Densitometry analysis of bands obtained in western-blots as in e (*P < 0.05, **P < 0.01, ANOVA. n = 5). g Equal numbers of HeLa cells were plated on non-coated glass (open squares), or on collagen-coated (purple open circles) or vitronectin-coated glass (black open circles), as indicated. Cells were harvested and counted 24 and 48 h after plating (***P < 0.001, ANOVA. n = 3). h HeLa cells treated with control (circles), β5-specific (triangles and crosses), or αv-specific siRNAs (diamonds and hexagons) for 48 h were seeded on vitronectin-coated glass in equal numbers. 24 and 48 h later, cells were harvested and counted (*P < 0.05, ANOVA. n = 3). i HeLa cells treated with β5-specific siRNA were transfected with a plasmid encoding TfR-mCherry and seeded in equal numbers on glass coated with either anti-mCherry (black circles) or control antibodies (open circles). 24 and 48 h later, cells were harvested and counted (*P < 0.05, ANOVA. n = 3). All results are expressed as mean ± SD

References

    1. Pelham RJ, Jr., Wang Y. Cell locomotion and focal adhesions are regulated by substrate flexibility. Proc. Natl Acad. Sci. USA. 1997;94:13661–13665. doi: 10.1073/pnas.94.25.13661. - DOI - PMC - PubMed
    1. Georges PC, Janmey PA. Cell type-specific response to growth on soft materials. J. Appl. Physiol. 2005;98:1547–1553. doi: 10.1152/japplphysiol.01121.2004. - DOI - PubMed
    1. Engler AJ, Sen S, Sweeney HL, Discher DE. Matrix elasticity directs stem cell lineage specification. Cell. 2006;126:677–689. doi: 10.1016/j.cell.2006.06.044. - DOI - PubMed
    1. Chen CS. Mechanotransduction–a field pulling together? J. Cell. Sci. 2008;121:3285–3292. doi: 10.1242/jcs.023507. - DOI - PubMed
    1. Geiger B, Spatz JP, Bershadsky AD. Environmental sensing through focal adhesions. Nat. Rev. Mol. Cell Biol. 2009;10:21–33. doi: 10.1038/nrm2593. - DOI - PubMed

Publication types

Substances