

Menisci protect chondrocytes from load-induced injury
- PMID: 30237492
- PMCID: PMC6148067
- DOI: 10.1038/s41598-018-32503-1
Menisci protect chondrocytes from load-induced injury
Erratum in
-
Publisher Correction: Menisci protect chondrocytes from load-induced injury.Sci Rep. 2019 Apr 9;9(1):5975. doi: 10.1038/s41598-019-40293-3. Sci Rep. 2019. PMID: 30967560 Free PMC article.
Abstract
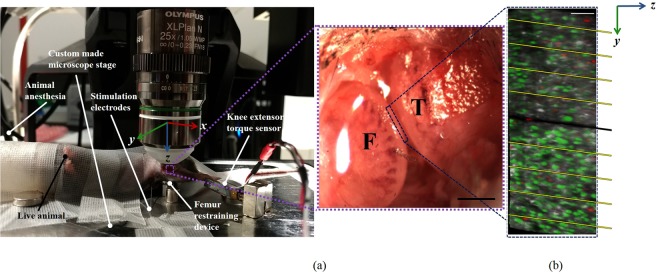
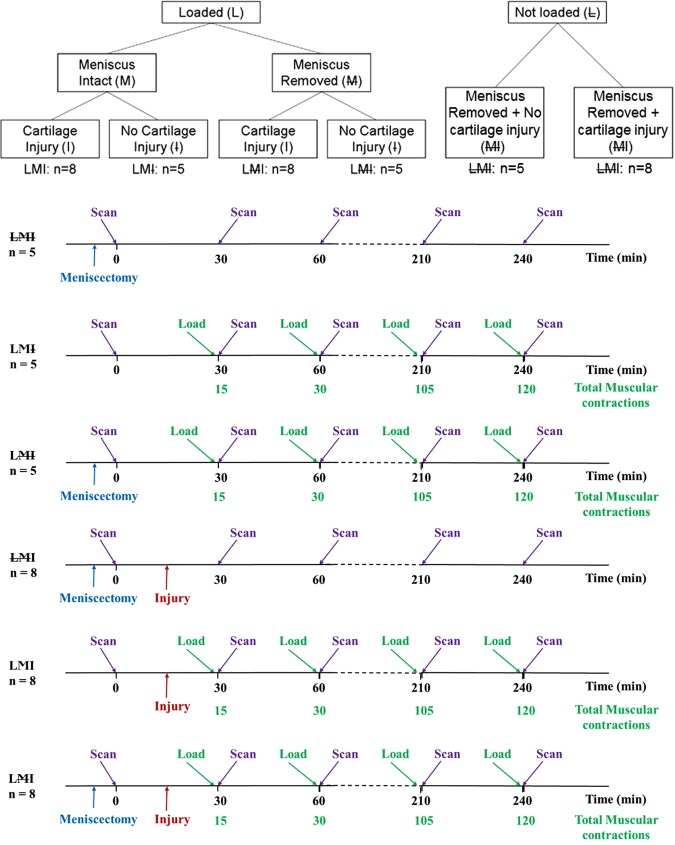
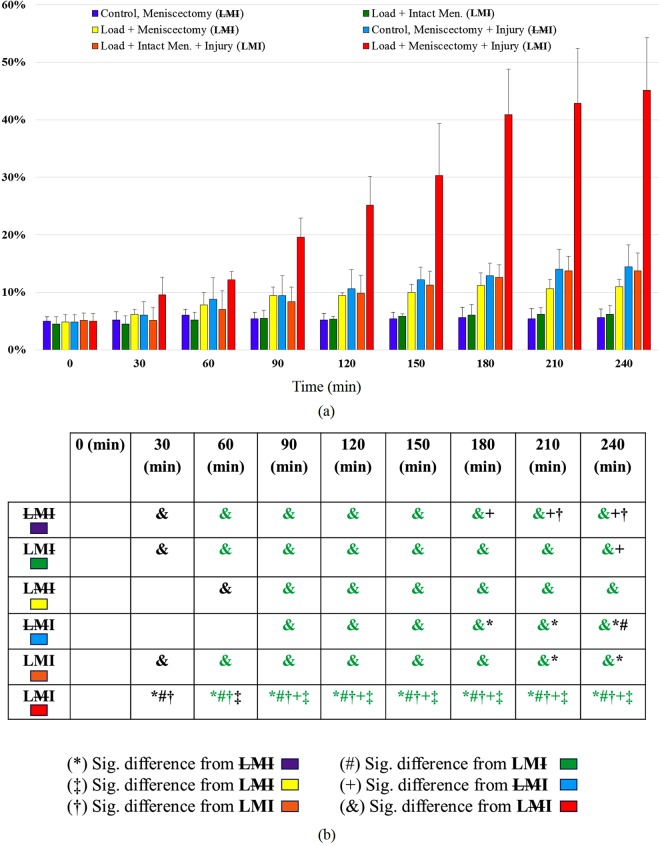
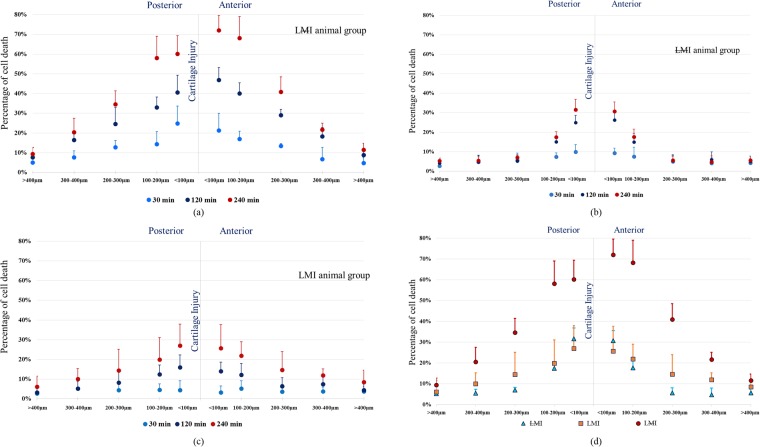
Menisci in the knee joint are thought to provide stability, increased contact area, decreased contact pressures, and offer protection to the underlying articular cartilage and bone during joint loading. Meniscal loss or injury is typically accompanied by degenerative changes in the knee, leading to an increased risk for osteoarthritis in animals including humans. However, the detailed mechanisms underlying joint degeneration and the development of osteoarthritis remain largely unknown, and the acute effects of meniscal loss have not been studied systematically. We developed a microscopy-based system to study microscale joint mechanics in living mice loaded by controlled muscular contractions. Here, we show how meniscal loss is associated with rapid chondrocyte death (necrosis) in articular cartilage within hours of injury, and how intact menisci protect chondrocytes in vivo in the presence of intense muscle-based joint loading and/or injury to the articular cartilage. Our findings suggest that loading the knee after meniscal loss is associated with extensive cell death in intact and injured knees, and that early treatment interventions should be aimed at preventing chondrocyte death.
Conflict of interest statement
The authors declare no competing interests.
Figures


Similar articles
-
Cartilage and chondrocyte response to extreme muscular loading and impact loading: Can in vivo pre-load decrease impact-induced cell death?Clin Biomech (Bristol). 2015 Jul;30(6):537-45. doi: 10.1016/j.clinbiomech.2015.04.009. Epub 2015 Apr 23. Clin Biomech (Bristol). 2015. PMID: 25957254
-
In Vivo Dynamic Deformation of Articular Cartilage in Intact Joints Loaded by Controlled Muscular Contractions.PLoS One. 2016 Jan 25;11(1):e0147547. doi: 10.1371/journal.pone.0147547. eCollection 2016. PLoS One. 2016. PMID: 26807930 Free PMC article.
-
Long-term repetitive mechanical loading of the knee joint by in vivo muscle stimulation accelerates cartilage degeneration and increases chondrocyte death in a rabbit model.Clin Biomech (Bristol). 2013 Jun;28(5):536-43. doi: 10.1016/j.clinbiomech.2013.04.009. Epub 2013 May 21. Clin Biomech (Bristol). 2013. PMID: 23701865
-
The Importance of the Knee Joint Meniscal Fibrocartilages as Stabilizing Weight Bearing Structures Providing Global Protection to Human Knee-Joint Tissues.Cells. 2019 Apr 6;8(4):324. doi: 10.3390/cells8040324. Cells. 2019. PMID: 30959928 Free PMC article. Review.
-
Osteoarthritis year in review 2015: mechanics.Osteoarthritis Cartilage. 2016 Jan;24(1):27-35. doi: 10.1016/j.joca.2015.08.018. Osteoarthritis Cartilage. 2016. PMID: 26707990 Free PMC article. Review.
Cited by
-
Effect of Concomitant Lateral Meniscal Management on ACL Reconstruction Revision Rate and Secondary Meniscal and Cartilaginous Injuries.Am J Sports Med. 2023 Oct;51(12):3142-3148. doi: 10.1177/03635465231194624. Epub 2023 Sep 8. Am J Sports Med. 2023. PMID: 37681530 Free PMC article.
-
A Morphological Study of the Meniscus, Cartilage and Subchondral Bone Following Closed-Joint Traumatic Impact to the Knee.Front Bioeng Biotechnol. 2022 Mar 21;10:835730. doi: 10.3389/fbioe.2022.835730. eCollection 2022. Front Bioeng Biotechnol. 2022. PMID: 35387294 Free PMC article.
-
Functional Assessment of Human Articular Cartilage Using Second Harmonic Generation (SHG) Imaging: A Feasibility Study.Ann Biomed Eng. 2024 Apr;52(4):1009-1020. doi: 10.1007/s10439-023-03437-1. Epub 2024 Jan 19. Ann Biomed Eng. 2024. PMID: 38240956
References
-
- CDC Prevalence and most common causes of disability among adults–United States, 2005. MMWR. Morb. Mortal. Wkly. Rep. 2009;58:421–426. - PubMed
Publication types
MeSH terms
LinkOut - more resources
Full Text Sources
Other Literature Sources
