. 2018 Sep 20;8(1):14101.
doi: 10.1038/s41598-018-32314-4.

Separation of blood microsamples by exploiting sedimentation at the microscale

Affiliations

Separation of blood microsamples by exploiting sedimentation at the microscale

D Forchelet et al. Sci Rep. .

Abstract

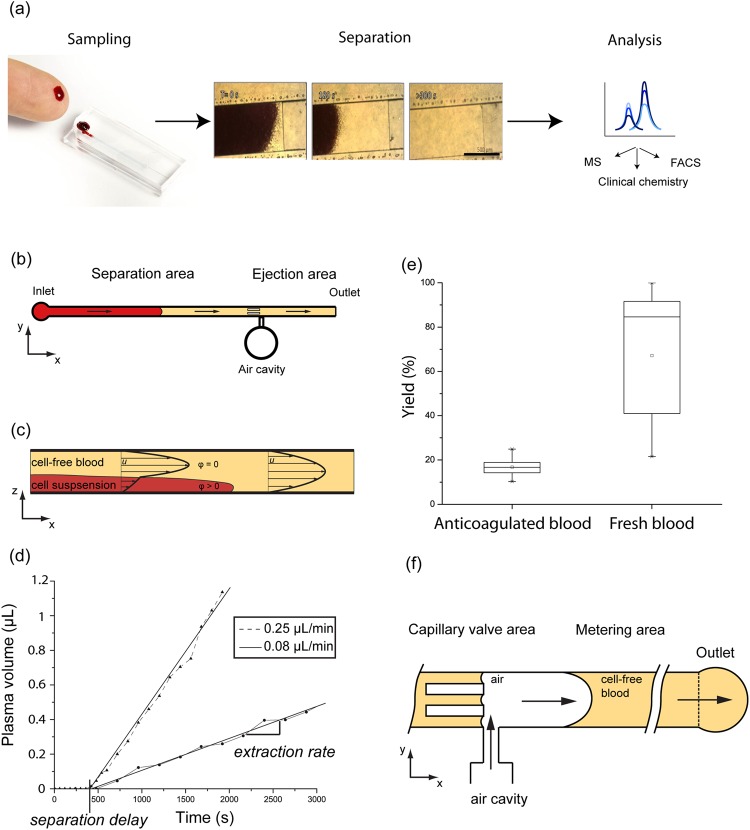
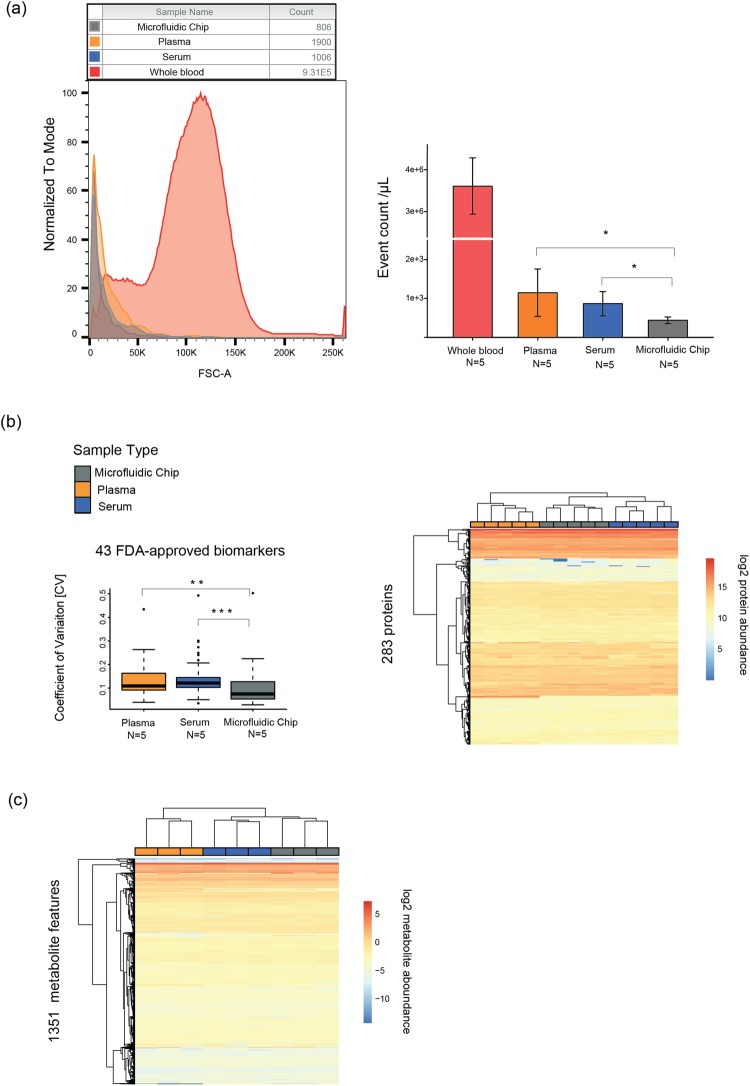
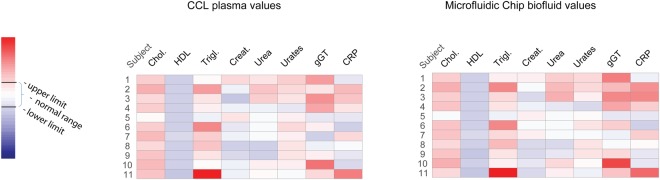
Microsample analysis is highly beneficial in blood-based testing where cutting-edge bioanalytical technologies enable the analysis of volumes down to a few tens of microliters. Despite the availability of analytical methods, the difficulty in obtaining high-quality and standardized microsamples at the point of collection remains a major limitation of the process. Here, we detail and model a blood separation principle which exploits discrete viscosity differences caused by blood particle sedimentation in a laminar flow. Based on this phenomenon, we developed a portable capillary-driven microfluidic device that separates blood microsamples collected from finger-pricks and delivers 2 µL of metered serum for bench-top analysis. Flow cytometric analysis demonstrated the high purity of generated microsamples. Proteomic and metabolomic analyses of the microsamples of 283 proteins and 1351 metabolite features was consistent with samples generated via a conventional centrifugation method. These results were confirmed by a clinical study scrutinising 8 blood markers in obese patients.


Conflict of interest statement

The authors declare no competing interests.

Figures

Figure 1
Figure 1
Separation microdevice and fluidic behaviour (a) Illustration of the study’s purpose: generation of analytically relevant cell-free blood microsample from fingerprick; (left) sampling of capillary blood after fingerprick and device loading; (center) sequence of microscopic captures depicting the formation of a cell-free plug at the air-liquid interface; (right) retrieval allowing off-chip gold standard analyses; (b) Device structure containing two areas performing the main functions: separation and ejection; (c) Illustration of the separation principle showing the expected velocity u distribution due to the distribution of cellular volume fraction ϕ; (d) Typical extracted volume curve in time for 0.08 and 0.25 μl/min whole blood feeding rate; (e) Comparison of anticoagulated and fresh sample yields showing a strong increase in fresh blood extraction yield (N = 23 and N = 13 for anti-coagulated and fresh blood extraction yield respectively); (f) Ejection mechanism: air injection allows the ejection of a 2 μL liquid sample from the metering area. The volume definition is performed by the capillary valves present in the channel and at the outlet; x, y and z represent the channel longitudinal, transversal and vertical directions respectively.
Figure 2
Figure 2
Analytical comparison of three blood separation methods (a) Blood samples particle content was analyzed by flow cytometry; (left) normalized event counts vs FSC showing the narrow FSC distribution of events in separated samples vs whole blood; (right) event count per microliter of original samples (N = 5) showing a significantly lower number of particles in chip-separated samples compared to centrifuged plasma or serum samples; (b) Proteomic data measured in the capillary blood of healthy volunteer; (left) boxplot presenting coefficient of variations calculated for 43 FDA approved blood biomarkers, in generated cell-free blood samples (N = 5) by plasma, serum or chip-based method (right) non-supervised hierarchical clustering of samples (N = 5) from three blood separation methods based on 283 quantified proteins; (c) Metabolomic data measured in the capillary blood of healthy volunteer. Non-supervised hierarchical clustering of samples (N = 3) from three blood separation methods based on 1351 metabolic features. Asterisks indicate statistically significant differences among the tested groups and corresponds to the p-value adjusted for the multiple comparisons: *P = <0.05, **P =  <0.01, ***P = <0.001. N corresponds to the number of analytical repetition.
Figure 3
Figure 3
Diagnostic blood parameters. Heatmaps representing abundance of 8 clinical blood markers in 11 obese subjects. Comparison between central clinical laboratory (CCL) plasma values and the chip-separated analytical values. Colors represent values relative to the normal range (see Table 1). Red colors indicate high concentrations, while blue colors represent low concentrations.

Similar articles

Cited by

References

    1. Chapman K, et al. Overcoming the barriers to the uptake of nonclinical microsampling in regulatory safety studies. Drug Discov. Today. 2014;19:528–532. doi: 10.1016/j.drudis.2014.01.002. - DOI - PubMed
    1. Wang MM, et al. Microfluidic sorting of mammalian cells by optical force switching. Nat. Biotechnol. 2005;23:83–87. doi: 10.1038/nbt1050. - DOI - PubMed
    1. Dimov IK, et al. Stand-alone self-powered integrated microfluidic blood analysis system (SIMBAS) Lab Chip. 2011;11:845–850. doi: 10.1039/C0LC00403K. - DOI - PubMed
    1. Crowley TA, Pizziconi V. Isolation of plasma from whole blood using planar microfilters for lab-on-a-chip applications. Lab Chip. 2005;5:922–929. doi: 10.1039/b502930a. - DOI - PubMed
    1. Homsy A, et al. Development and validation of a low cost blood filtration element separating plasma from undiluted whole blood. Biomicrofluidics. 2012;6:12804. doi: 10.1063/1.3672188. - DOI - PMC - PubMed

Publication types

LinkOut - more resources