

Gender disparity in epidemiological trend of HIV/AIDS infection and treatment in Ethiopia
- PMID: 30237881
- PMCID: PMC6139900
- DOI: 10.1186/s13690-018-0299-8
Gender disparity in epidemiological trend of HIV/AIDS infection and treatment in Ethiopia
Abstract
Background: The HIV/AIDS epidemic has been fuelled by gender inequality and disparity resulted in violation of women reproductive right. The "feminization" of the pandemic is more apparent in Sub-Saharan Africa where the larger numbers of HIV infected people are living. Although they carry the higher proportion of HIV cases; access to care and treatment is lower among women. In Ethiopia where HIV is prevalent and gender violence is common, the disparity may be higher. Therefore, this research aimed to assesses trends in gender disparity in the HIV/AIDS epidemic in Ethiopia to bring evidence for action.
Methods: This study was conducted using aggregates of HIV/AIDS indicator data from 1990 to 2016 of UNAIDS data bases. The data was compiled and analyzed with excel and STATA Version 11. The trend was assessed, gender difference was measured and rate of change was compared between genders and specific age groups.
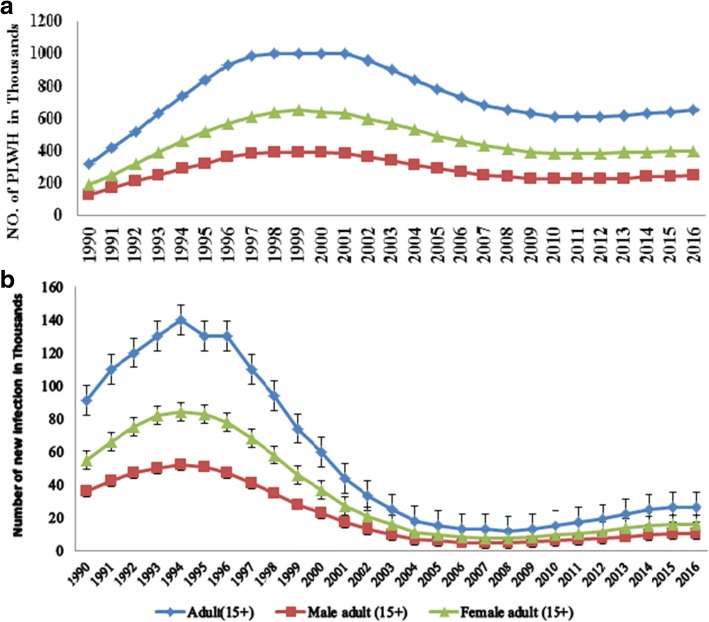
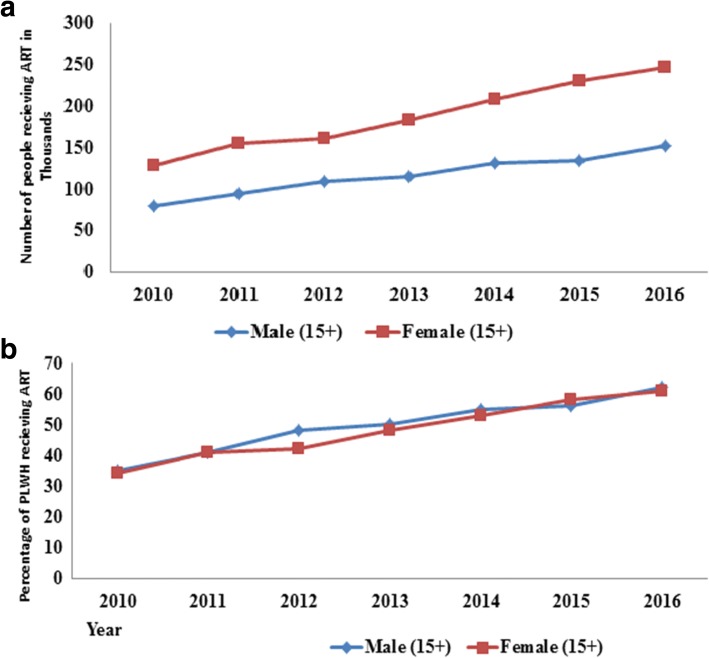
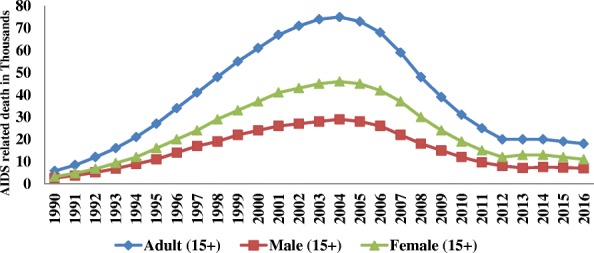
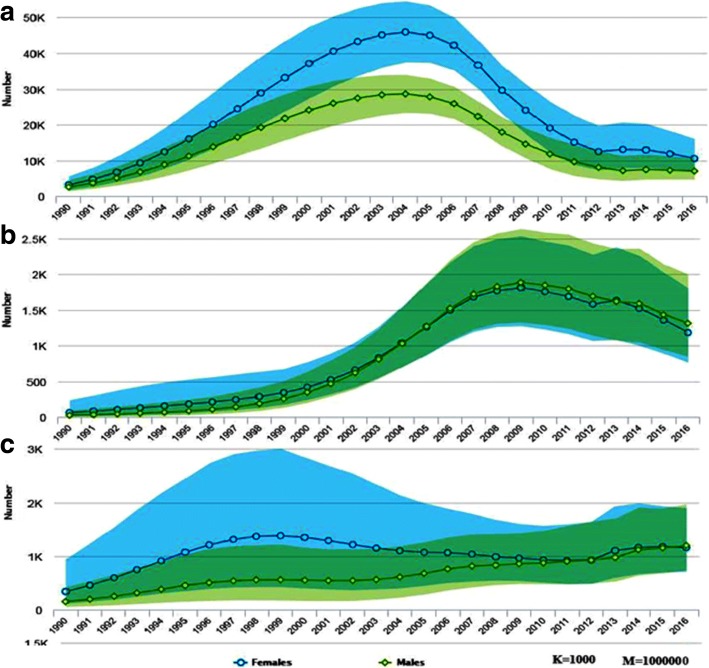
Result: Adult females (age 15+) accounted 61.5% of the HIV cases and new infection among adults. While, adolescent females (age 10-19) and young women (age 15-24) accounted 52.3 and 57.5% of prevalent cases and 74 and 68% of new infection in their age category respectively. HIV is 1.62 times more prevalent among adult women than men. Since 1990, HIV cases among adults has risen markedly in the first decade with 24 and 20%, then declined by 41.5% in the second decade and rose again by 5 and 8.7% among women and men respectively. The overall prevalence is declined by 72.4 and 71.5% from the maximum record. Women and men have equal access for ART; 62% of men and 61% of women from all adults living with HIV were on ART. While 61% of deaths were among adult women and the death rate is similar among adolescent women and men. AIDS- related death has been declined by 76% from the maximum record.
Conclusion: HIV/AIDS prevalence, new infection and AIDS-related death are by far higher among adult women than men. While the coverage of treatment and HIV care is equal among both genders. Vulnerable age groups (adolescent females and young women) take the lion's share of the new infections and prevalent cases. Therefore due attention is needed to avert gender disparity with a particular emphasis for adolescents and young women.
Keywords: Antiretroviral therapy; Gender disparity; HIV/AIDS and gender; Trend of HIV.
Conflict of interest statement
Not applicableNot applicableThe authors declare that they have no competing interests.Springer Nature remains neutral with regard to jurisdictional claims in published maps and institutional affiliations.
Figures


Similar articles
-
Trend of HIV/AIDS for the last 26 years and predicting achievement of the 90-90-90 HIV prevention targets by 2020 in Ethiopia: a time series analysis.BMC Infect Dis. 2018 Jul 11;18(1):320. doi: 10.1186/s12879-018-3214-6. BMC Infect Dis. 2018. PMID: 29996776 Free PMC article.
-
Gender difference in health related quality of life and associated factors among people living with HIV/AIDS attending anti-retroviral therapy at public health facilities, western Ethiopia: comparative cross sectional study.BMC Public Health. 2018 Apr 23;18(1):537. doi: 10.1186/s12889-018-5474-x. BMC Public Health. 2018. PMID: 29688853 Free PMC article.
-
What explains gender inequalities in HIV/AIDS prevalence in sub-Saharan Africa? Evidence from the demographic and health surveys.BMC Public Health. 2016 Nov 3;16(1):1136. doi: 10.1186/s12889-016-3783-5. BMC Public Health. 2016. PMID: 27809824 Free PMC article.
-
AIDS in sub-Saharan Africa: the epidemiology of heterosexual transmission and the prospects for prevention.Epidemiology. 1993 Jan;4(1):63-72. Epidemiology. 1993. PMID: 8420583 Review.
-
Microbicides-emerging essential pillars of comprehensive HIV/AIDS prevention.Ethiop Med J. 2006 Oct;44(4):405-15. Ethiop Med J. 2006. PMID: 17370443 Review.
Cited by
-
Seroprevalence and effect of HBV and HCV co-infections on the immuno-virologic responses of adult HIV-infected persons on anti-retroviral therapy.PLoS One. 2022 Nov 23;17(11):e0278037. doi: 10.1371/journal.pone.0278037. eCollection 2022. PLoS One. 2022. PMID: 36417469 Free PMC article.
-
Trend and Determinants of Mortality Among Women of Reproductive Age: A Twelve-Year Open Cohort Study in Eastern Ethiopia.Front Glob Womens Health. 2021 Dec 14;2:762984. doi: 10.3389/fgwh.2021.762984. eCollection 2021. Front Glob Womens Health. 2021. PMID: 34970651 Free PMC article.
-
The triple burden of communicable and non-communicable diseases and injuries on sex differences in life expectancy in Ethiopia.Int J Equity Health. 2021 Aug 3;20(1):180. doi: 10.1186/s12939-021-01516-0. Int J Equity Health. 2021. PMID: 34344371 Free PMC article.
-
Beliefs about HIV cure: A qualitative study of people living with HIV in Soweto, South Africa.South Afr J HIV Med. 2025 Jan 30;26(1):1644. doi: 10.4102/sajhivmed.v26i1.1644. eCollection 2025. South Afr J HIV Med. 2025. PMID: 39967752 Free PMC article.
-
HIVepsilon-seq-scalable characterization of intact persistent proviral HIV reservoirs in women.J Virol. 2023 Nov 30;97(11):e0070523. doi: 10.1128/jvi.00705-23. Epub 2023 Oct 16. J Virol. 2023. PMID: 37843370 Free PMC article.
References
-
- UNAIDS. Joint United Nations Programme on HIV/AIDS (UNAIDS). Geneva: UNAIDS Data; 2017.
-
- UNAIDS. “Gender every minute.” UNAIDS infographics. 2012. Retrieved May 15, 2017. <www.unaids.org/en/resources/infographics/20120608gendereveryminute>.
-
- Joint United Nations Programme on HIV/AIDS (UNAIDS) Ending AIDS progress towards the 90–90–90 targets. Geneva: Global aids update; 2017.
-
- Ethiopian public health institute. HIV Related Estimates and Projections for Ethiopia–2017. Addis Ababa: EPHI; 2017.
LinkOut - more resources
Full Text Sources
Other Literature Sources
Molecular Biology Databases
