

Excess vascular endothelial growth factor-A disrupts pericyte recruitment during blood vessel formation
- PMID: 30238211
- PMCID: PMC6360133
- DOI: 10.1007/s10456-018-9648-z
Excess vascular endothelial growth factor-A disrupts pericyte recruitment during blood vessel formation
Abstract
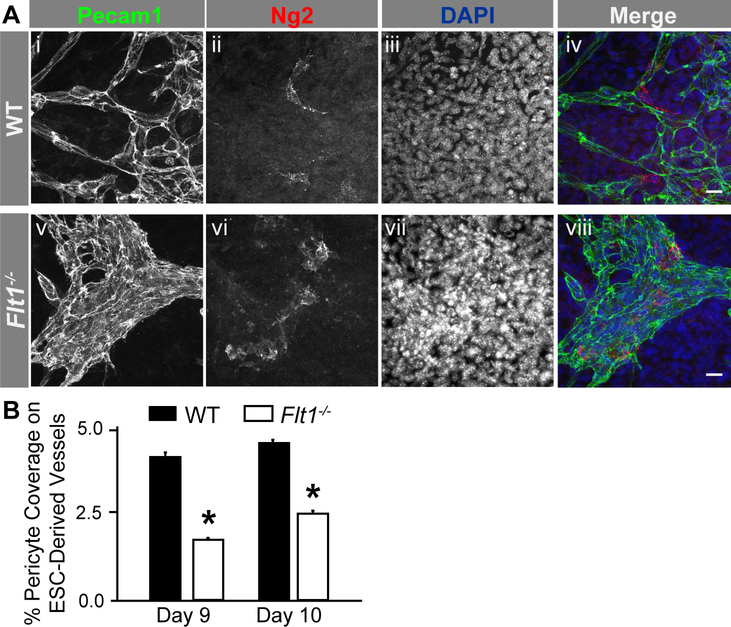
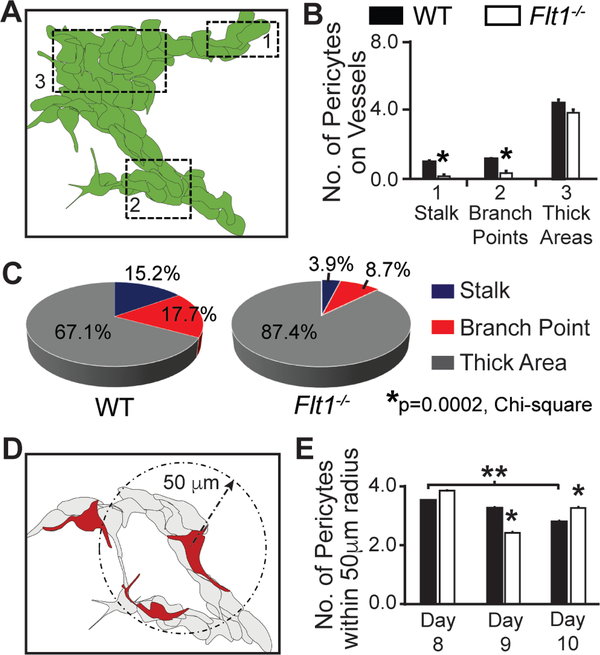
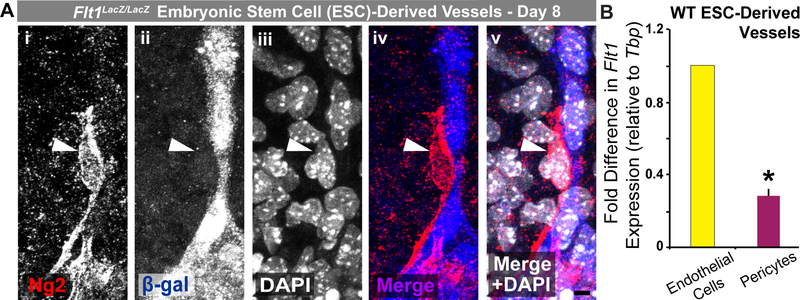
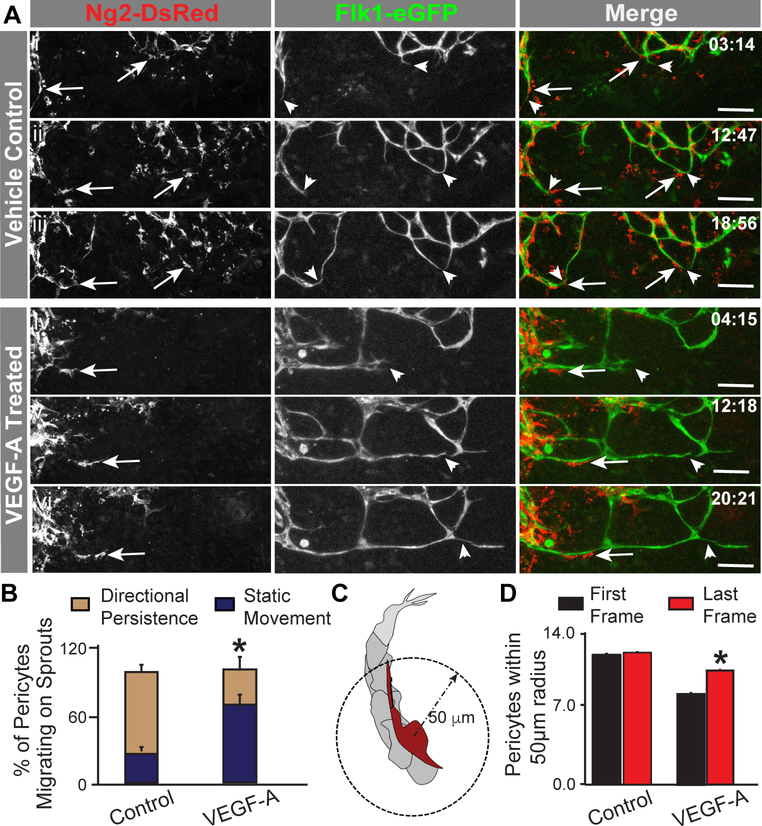
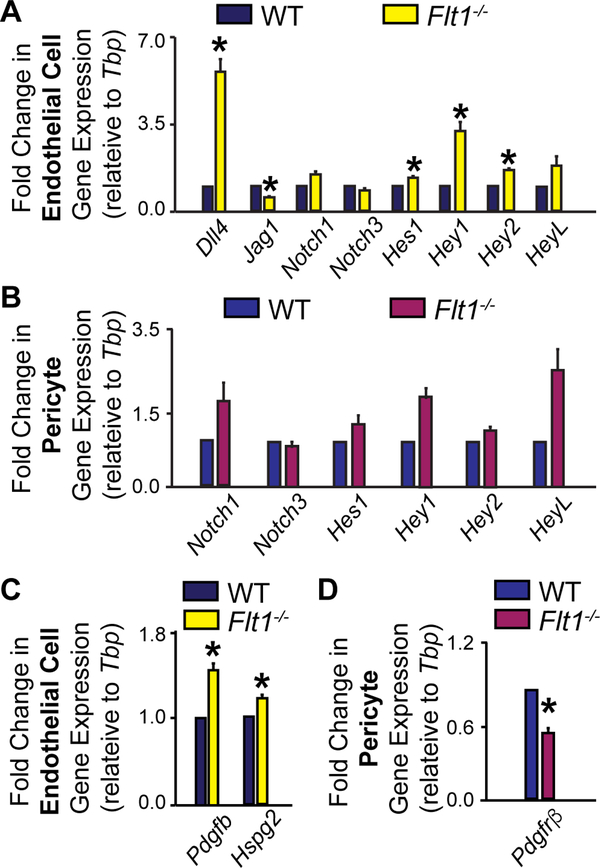
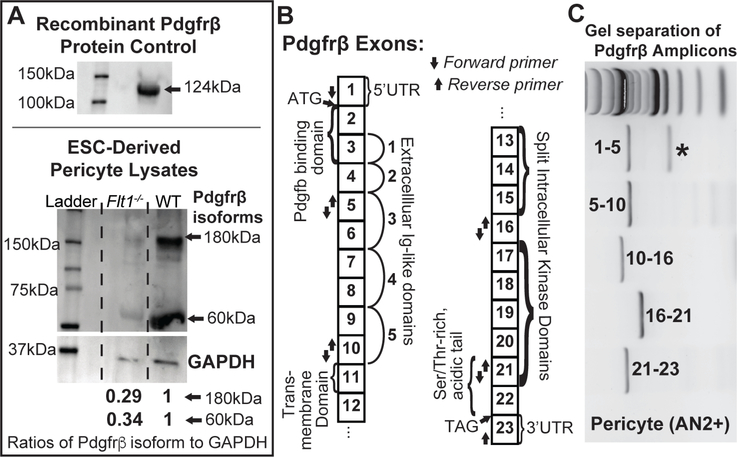
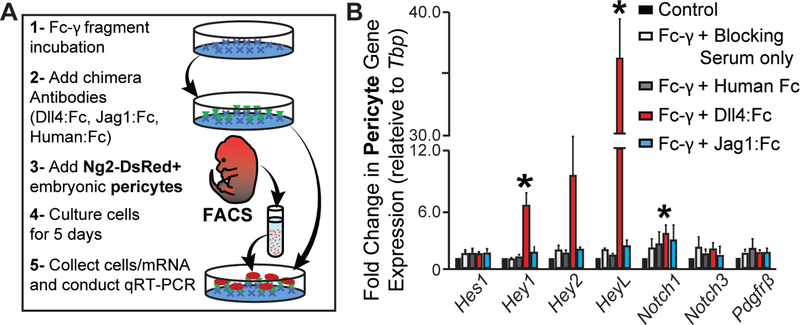
Pericyte investment into new blood vessels is essential for vascular development such that mis-regulation within this phase of vessel formation can contribute to numerous pathologies including arteriovenous and cerebrovascular malformations. It is critical therefore to illuminate how angiogenic signaling pathways intersect to regulate pericyte migration and investment. Here, we disrupted vascular endothelial growth factor-A (VEGF-A) signaling in ex vivo and in vitro models of sprouting angiogenesis, and found pericyte coverage to be compromised during VEGF-A perturbations. Pericytes had little to no expression of VEGF receptors, suggesting VEGF-A signaling defects affect endothelial cells directly but pericytes indirectly. Live imaging of ex vivo angiogenesis in mouse embryonic skin revealed limited pericyte migration during exposure to exogenous VEGF-A. During VEGF-A gain-of-function conditions, pericytes and endothelial cells displayed abnormal transcriptional changes within the platelet-derived growth factor-B (PDGF-B) and Notch pathways. To further test potential crosstalk between these pathways in pericytes, we stimulated embryonic pericytes with Notch ligands Delta-like 4 (Dll4) and Jagged-1 (Jag1) and found induction of Notch pathway activity but no changes in PDGF Receptor-β (Pdgfrβ) expression. In contrast, PDGFRβ protein levels decreased with mis-regulated VEGF-A activity, observed in the effects on full-length PDGFRβ and a truncated PDGFRβ isoform generated by proteolytic cleavage or potentially by mRNA splicing. Overall, these observations support a model in which, during the initial stages of vascular development, pericyte distribution and coverage are indirectly affected by endothelial cell VEGF-A signaling and the downstream regulation of PDGF-B-PDGFRβ dynamics, without substantial involvement of pericyte Notch signaling during these early stages.
Keywords: Angiogenesis; Development; Mouse embryonic stem cells; Pericyte; VEGF-A.
Conflict of interest statement
Figures
Similar articles
-
A role for VEGF as a negative regulator of pericyte function and vessel maturation.Nature. 2008 Dec 11;456(7223):809-13. doi: 10.1038/nature07424. Epub 2008 Nov 9. Nature. 2008. PMID: 18997771 Free PMC article.
-
Pericytes regulate VEGF-induced endothelial sprouting through VEGFR1.Nat Commun. 2017 Nov 17;8(1):1574. doi: 10.1038/s41467-017-01738-3. Nat Commun. 2017. PMID: 29146905 Free PMC article.
-
Platelet-derived growth factor receptor-beta constitutive activity promotes angiogenesis in vivo and in vitro.Arterioscler Thromb Vasc Biol. 2007 Oct;27(10):2142-9. doi: 10.1161/01.ATV.0000282198.60701.94. Epub 2007 Jul 26. Arterioscler Thromb Vasc Biol. 2007. PMID: 17656670
-
Pericyte-Endothelial Interactions in the Retinal Microvasculature.Int J Mol Sci. 2020 Oct 8;21(19):7413. doi: 10.3390/ijms21197413. Int J Mol Sci. 2020. PMID: 33049983 Free PMC article. Review.
-
The role of pericytes in angiogenesis.Int J Dev Biol. 2011;55(3):261-8. doi: 10.1387/ijdb.103167dr. Int J Dev Biol. 2011. PMID: 21710434 Review.
Cited by
-
Angiogenesis in abnormal uterine bleeding: a narrative review.Hum Reprod Update. 2023 Jul 5;29(4):457-485. doi: 10.1093/humupd/dmad004. Hum Reprod Update. 2023. PMID: 36857162 Free PMC article. Review.
-
Inhibitory effect of melatonin on Mst1 ameliorates myocarditis through attenuating ER stress and mitochondrial dysfunction.J Mol Histol. 2019 Oct;50(5):405-415. doi: 10.1007/s10735-019-09836-w. Epub 2019 Jun 29. J Mol Histol. 2019. PMID: 31256303
-
Engineering the vasculature for islet transplantation.Acta Biomater. 2019 Sep 1;95:131-151. doi: 10.1016/j.actbio.2019.05.051. Epub 2019 May 23. Acta Biomater. 2019. PMID: 31128322 Free PMC article. Review.
-
Efficacious, safe, and stable inhibition of corneal neovascularization by AAV-vectored anti-VEGF therapeutics.Mol Ther Methods Clin Dev. 2021 Jun 24;22:107-121. doi: 10.1016/j.omtm.2021.06.007. eCollection 2021 Sep 10. Mol Ther Methods Clin Dev. 2021. PMID: 34514023 Free PMC article.
-
Hippo/Mst1 overexpression induces mitochondrial death in head and neck squamous cell carcinoma via activating β-catenin/Drp1 pathway.Cell Stress Chaperones. 2019 Jul;24(4):807-816. doi: 10.1007/s12192-019-01008-9. Epub 2019 May 24. Cell Stress Chaperones. 2019. PMID: 31127452 Free PMC article.
References
-
- Benjamin EJ, Blaha MJ, Chiuve SE, Cushman M, Das SR, Deo R, de Ferranti SD, Floyd J, Fornage M, Gillespie C, Isasi CR, Jimenez MC, Jordan LC, Judd SE, Lackland D, Lichtman JH, Lisabeth L, Liu S, Longenecker CT, Mackey RH, Matsushita K, Mozaffarian D, Mussolino ME, Nasir K, Neumar RW, Palaniappan L, Pandey DK, Thiagarajan RR, Reeves MJ, Ritchey M, Rodriguez CJ, Roth GA, Rosamond WD, Sasson C, Towfighi A, Tsao CW, Turner MB, Virani SS, Voeks JH, Willey JZ, Wilkins JT, Wu JH, Alger HM, Wong SS, Muntner P, American Heart Association Statistics C, Stroke Statistics S (2017) Heart Disease and Stroke Statistics-2017 Update: A Report From the American Heart Association. Circulation 135 (10):e146–e603. doi:10.1161/CIR.0000000000000485 - DOI - PMC - PubMed
Publication types
MeSH terms
Substances
Grants and funding
LinkOut - more resources
Full Text Sources
Other Literature Sources
Molecular Biology Databases
