The influence of prior pronunciations on sensorimotor cortex activity patterns during vowel production
- PMID: 30238924
- PMCID: PMC6240458
- DOI: 10.1088/1741-2552/aae329
The influence of prior pronunciations on sensorimotor cortex activity patterns during vowel production
Abstract
Objective: In recent years, brain-computer interface (BCI) systems have been investigated for their potential as a communication device to assist people with severe paralysis. Decoding speech sensorimotor cortex activity is a promising avenue for the generation of BCI control signals, but is complicated by variability in neural patterns, leading to suboptimal decoding. We investigated whether neural pattern variability associated with sound pronunciation can be explained by prior pronunciations and determined to what extent prior speech affects BCI decoding accuracy.
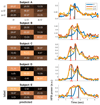
Approach: Neural patterns in speech motor areas were evaluated with electrocorticography in five epilepsy patients, who performed a simple speech task that involved pronunciation of the /i/ sound, preceded by either silence, the /a/ sound or the /u/ sound.
Main results: The neural pattern related to the /i/ sound depends on previous sounds and is therefore associated with multiple distinct sensorimotor patterns, which is likely to reflect differences in the movements towards this sound. We also show that these patterns still contain a commonality that is distinct from the other vowel sounds (/a/ and /u/). Classification accuracies for the decoding of different sounds do increase, however, when the multiple patterns for the /i/ sound are taken into account. Simply including multiple forms of the /i/ vowel in the training set for the creation of a single /i/ model performs as well as training individual models for each /i/ variation.
Significance: Our results are of interest for the development of BCIs that aim to decode speech sounds from the sensorimotor cortex, since they argue that a multitude of cortical activity patterns associated with speech movements can be reduced to a basis set of models which reflect meaningful language units (vowels), yet it is important to account for the variety of neural patterns associated with a single sound in the training process.
Figures


Similar articles
-
Repeated Vowel Production Affects Features of Neural Activity in Sensorimotor Cortex.Brain Topogr. 2019 Jan;32(1):97-110. doi: 10.1007/s10548-018-0673-4. Epub 2018 Sep 20. Brain Topogr. 2019. PMID: 30238309 Free PMC article.
-
ECoG data analyses to inform closed-loop BCI experiments for speech-based prosthetic applications.Annu Int Conf IEEE Eng Med Biol Soc. 2016 Aug;2016:5713-5716. doi: 10.1109/EMBC.2016.7592024. Annu Int Conf IEEE Eng Med Biol Soc. 2016. PMID: 28269552
-
Decoding spoken phonemes from sensorimotor cortex with high-density ECoG grids.Neuroimage. 2018 Oct 15;180(Pt A):301-311. doi: 10.1016/j.neuroimage.2017.10.011. Epub 2017 Oct 7. Neuroimage. 2018. PMID: 28993231 Free PMC article.
-
Brain-Computer Interface: Applications to Speech Decoding and Synthesis to Augment Communication.Neurotherapeutics. 2022 Jan;19(1):263-273. doi: 10.1007/s13311-022-01190-2. Epub 2022 Jan 31. Neurotherapeutics. 2022. PMID: 35099768 Free PMC article. Review.
-
The Potential for a Speech Brain-Computer Interface Using Chronic Electrocorticography.Neurotherapeutics. 2019 Jan;16(1):144-165. doi: 10.1007/s13311-018-00692-2. Neurotherapeutics. 2019. PMID: 30617653 Free PMC article. Review.
Cited by
-
Workshops of the Seventh International Brain-Computer Interface Meeting: Not Getting Lost in Translation.Brain Comput Interfaces (Abingdon). 2019;6(3):71-101. doi: 10.1080/2326263X.2019.1697163. Epub 2019 Dec 10. Brain Comput Interfaces (Abingdon). 2019. PMID: 33033729 Free PMC article.
-
Decoding spoken English from intracortical electrode arrays in dorsal precentral gyrus.J Neural Eng. 2020 Nov 25;17(6):066007. doi: 10.1088/1741-2552/abbfef. J Neural Eng. 2020. PMID: 33236720 Free PMC article.
-
Decoding Single and Paired Phonemes Using 7T Functional MRI.Brain Topogr. 2024 Sep;37(5):731-747. doi: 10.1007/s10548-024-01034-6. Epub 2024 Jan 23. Brain Topogr. 2024. PMID: 38261272 Free PMC article.
-
Classification of Articulator Movements and Movement Direction from Sensorimotor Cortex Activity.Sci Rep. 2019 Oct 2;9(1):14165. doi: 10.1038/s41598-019-50834-5. Sci Rep. 2019. PMID: 31578420 Free PMC article.
References
-
- American Congress of Rehabilitation Medicine. Recommendations for use of uniform nomenclature pertinent to patients with severe alterations in consciousness. Arch Phys Med Rehabil. 1995;76:205–9. - PubMed
-
- Posner JB, Plum F, Saper CB, Schiff N. Plum and Posner’s Diagnosis of Stupor and Coma. Oxford University Press; USA: 2007.
-
- Wolpaw JR, Birbaumer N, McFarland DJ, Pfurtscheller G, Vaughan TM. Brain-computer interfaces for communication and control. Clin Neurophysiol. 2002;113:767–91. - PubMed
Publication types
MeSH terms
Grants and funding
LinkOut - more resources
Full Text Sources
Other Literature Sources
