

Separating fetal and maternal placenta circulations using multiparametric MRI
- PMID: 30239036
- PMCID: PMC6282748
- DOI: 10.1002/mrm.27406
Separating fetal and maternal placenta circulations using multiparametric MRI
Abstract
Purpose: The placenta is a vital organ for the exchange of oxygen, nutrients, and waste products between fetus and mother. The placenta may suffer from several pathologies, which affect this fetal-maternal exchange, thus the flow properties of the placenta are of interest in determining the course of pregnancy. In this work, we propose a new multiparametric model for placental tissue signal in MRI.
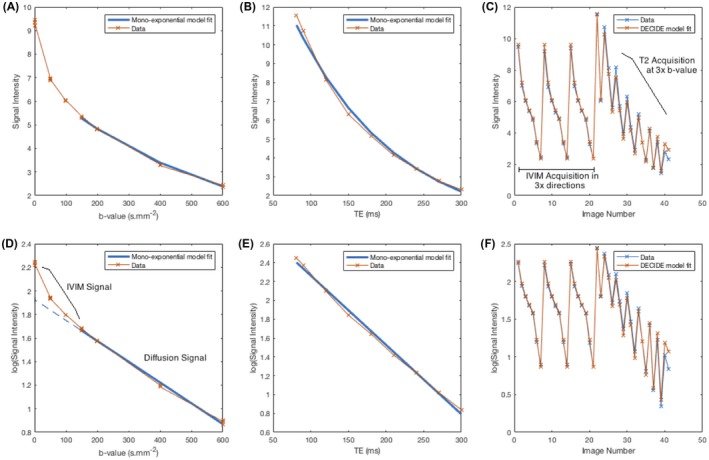
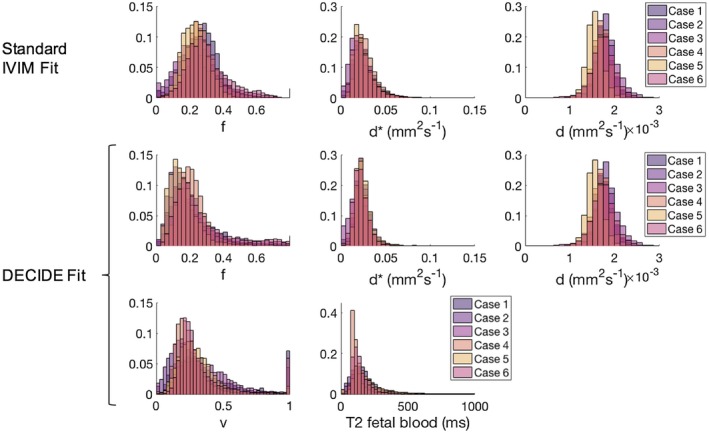
Methods: We describe a method that separates fetal and maternal flow characteristics of the placenta using a 3-compartment model comprising fast and slowly circulating fluid pools, and a tissue pool is fitted to overlapping multiecho T2 relaxometry and diffusion MRI with low b-values. We implemented the combined model and acquisition on a standard 1.5 Tesla clinical system with acquisition taking less than 20 minutes.
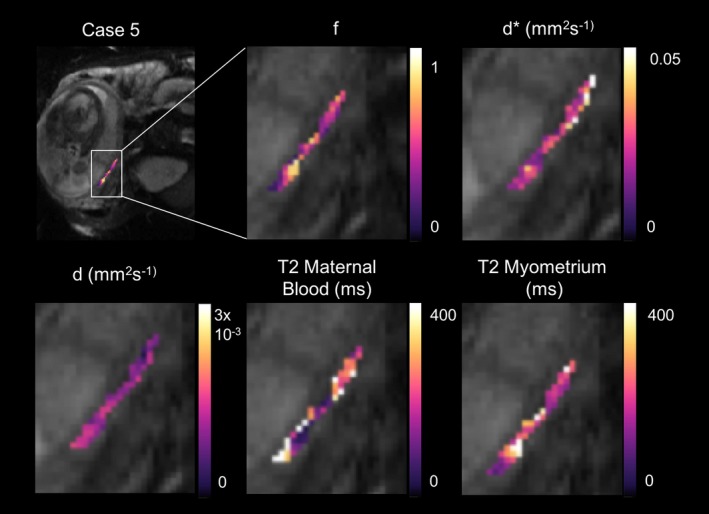
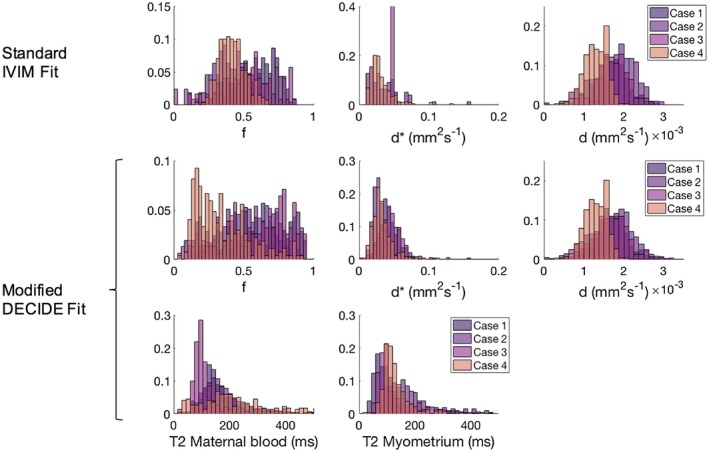
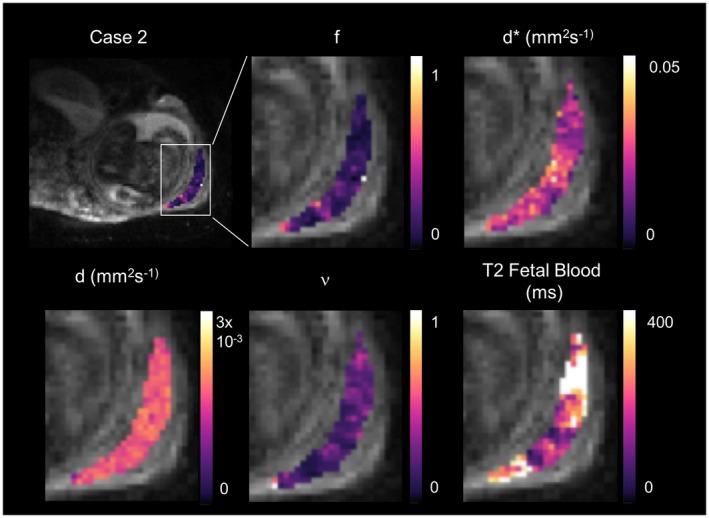
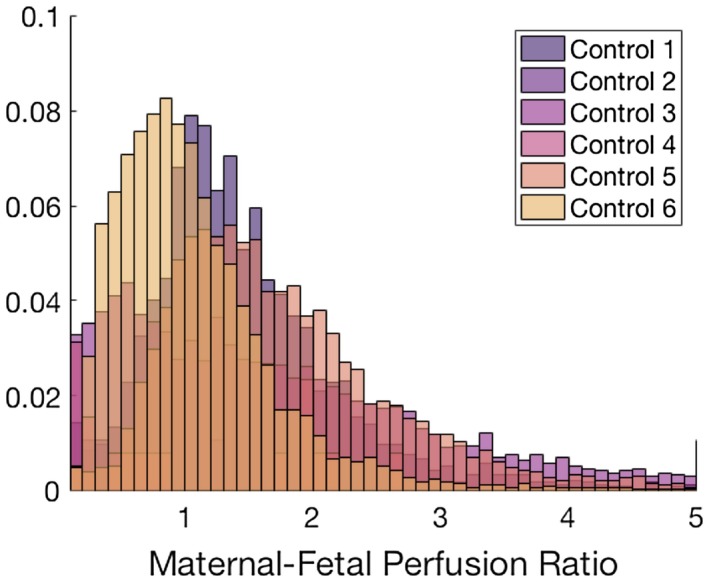
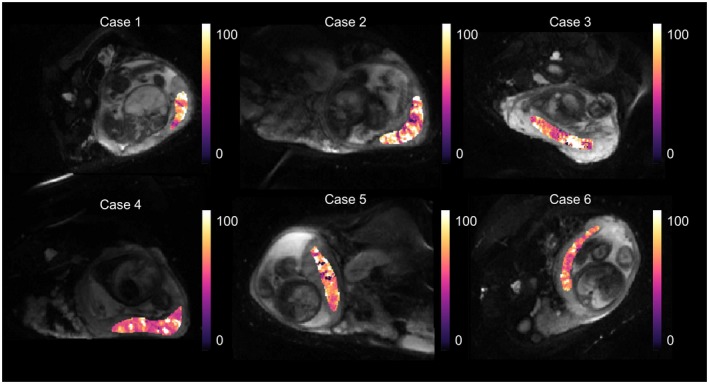
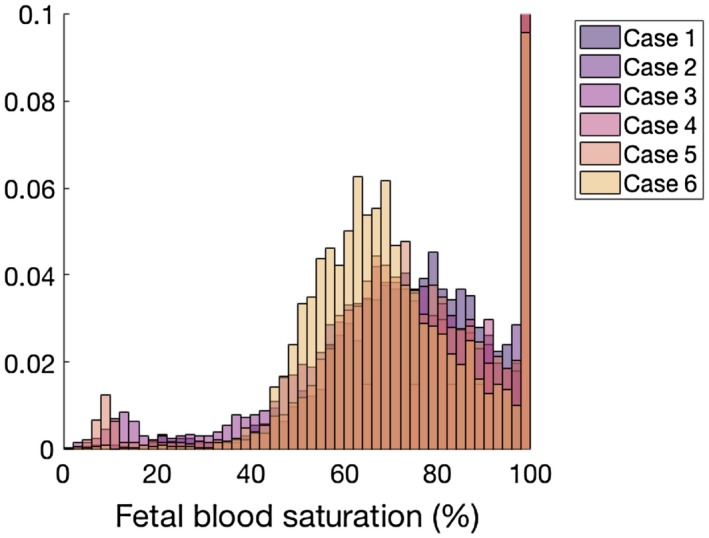
Results: We apply this combined acquisition in 6 control singleton placentas. Mean myometrial T2 relaxation time was 123.63 (±6.71) ms. Mean T2 relaxation time of maternal blood was 202.17 (±92.98) ms. In the placenta, mean T2 relaxation time of the fetal blood component was 144.89 (±54.42) ms. Mean ratio of maternal to fetal blood volume was 1.16 (±0.6), and mean fetal blood saturation was 72.93 (±20.11)% across all 6 cases.
Conclusion: The novel acquisition in this work allows the measurement of histologically relevant physical parameters, such as the relative proportions of vascular spaces. In the placenta, this may help us to better understand the physiological properties of the tissue in disease.
Keywords: DECIDE; chorion; diffusion; flow-matching; relaxometry.
© 2018 The Authors Magnetic Resonance in Medicine published by Wiley Periodicals, Inc. on behalf of International Society for Magnetic Resonance in Medicine.
Figures
References
-
- Fox H. Pathology of the placenta. Clin Obstet Gynaecol. 1986;13:501–519. - PubMed
-
- Lewi L, Jani J, Blickstein I, et al. The outcome of monochorionic diamniotic twin gestations in the era of invasive fetal therapy: a prospective cohort study. Am J Obstet Gynecol. 2008;199(514):e1–e8. - PubMed
-
- Wee LY, Taylor M, Watkins N, Franke V, Parker K, Fisk NM. Characterisation of deep arterio‐venous anastomoses within monochorionic placentae by vascular casting. Placenta. 2005;26:19–24. - PubMed
Publication types
MeSH terms
Substances
Grants and funding
LinkOut - more resources
Full Text Sources
Other Literature Sources
Medical
