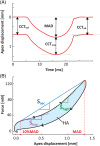
Assessment of the influence of viscoelasticity of cornea in animal ex vivo model using air-puff optical coherence tomography and corneal hysteresis
- PMID: 30239154
- PMCID: PMC7065616
- DOI: 10.1002/jbio.201800154
Assessment of the influence of viscoelasticity of cornea in animal ex vivo model using air-puff optical coherence tomography and corneal hysteresis
Abstract
Application of the air-puff swept source optical coherence tomography (SS-OCT) instrument to determine the influence of viscoelasticity on the relation between overall the air-puff force and corneal apex displacement of porcine corneas ex vivo is demonstrated. Simultaneous recording of time-evolution of the tissue displacement and air pulse stimulus allows obtaining valuable information related in part to the mechanical properties of the cornea. A novel approach based on quantitative analysis of the corneal hysteresis of OCT data is presented. The corneal response to the air pulse is assessed for different well-controlled intraocular pressure (IOP) levels and for the progression of cross-linking-induced stiffness of the cornea. Micrometer resolution, fast acquisition and noncontact character of the air-puff SS-OCT measurements have potential to improve the in vivo assessment of mechanical properties of the human corneas.
Keywords: corneal biomechanics; corneal hysteresis; optical coherence tomography; viscoelasticity.
© 2018 The Authors. Journal of Biophotonics published by WILEY-VCH Verlag GmbH & Co. KGaA, Weinheim.
Figures


Similar articles
-
Assessment of Corneal Biomechanical Properties with Inflation Test Using Optical Coherence Tomography.Ann Biomed Eng. 2018 Feb;46(2):247-256. doi: 10.1007/s10439-017-1973-7. Epub 2018 Jan 2. Ann Biomed Eng. 2018. PMID: 29297099
-
Investigating Elastic Anisotropy of the Porcine Cornea as a Function of Intraocular Pressure With Optical Coherence Elastography.J Refract Surg. 2016 Aug 1;32(8):562-7. doi: 10.3928/1081597X-20160520-01. J Refract Surg. 2016. PMID: 27505317 Free PMC article.
-
Heartbeat OCE: corneal biomechanical response to simulated heartbeat pulsation measured by optical coherence elastography.J Biomed Opt. 2020 May;25(5):1-9. doi: 10.1117/1.JBO.25.5.055001. J Biomed Opt. 2020. PMID: 32372574 Free PMC article.
-
Corneal biomechanics: Measurement and structural correlations.Exp Eye Res. 2021 Apr;205:108508. doi: 10.1016/j.exer.2021.108508. Epub 2021 Feb 18. Exp Eye Res. 2021. PMID: 33609511 Free PMC article. Review.
-
Concepts and misconceptions in corneal biomechanics.J Cataract Refract Surg. 2014 Jun;40(6):862-9. doi: 10.1016/j.jcrs.2014.04.019. J Cataract Refract Surg. 2014. PMID: 24857435 Review.
Cited by
-
Toward Corneal Limbus In Vitro Model: Regulation of hPSC-LSC Phenotype by Matrix Stiffness and Topography During Cell Differentiation Process.Adv Healthc Mater. 2023 Nov;12(29):e2301396. doi: 10.1002/adhm.202301396. Epub 2023 Jul 21. Adv Healthc Mater. 2023. PMID: 37449943 Free PMC article.
-
Measuring intraocular pressure with OCT: the first approach.Biomed Opt Express. 2023 Aug 9;14(9):4531-4541. doi: 10.1364/BOE.500546. eCollection 2023 Sep 1. Biomed Opt Express. 2023. PMID: 37791274 Free PMC article.
-
Assessment of corneal biomechanics, tonometry and pachymetry with the Corvis ST in myopia.Sci Rep. 2021 Feb 4;11(1):3041. doi: 10.1038/s41598-020-80915-9. Sci Rep. 2021. PMID: 33542296 Free PMC article.
-
Advances in Imaging Technology of Anterior Segment of the Eye.J Ophthalmol. 2021 Feb 23;2021:9539765. doi: 10.1155/2021/9539765. eCollection 2021. J Ophthalmol. 2021. PMID: 33688432 Free PMC article. Review.
-
High-speed OCT-based ocular biometer combined with an air-puff system for determination of induced retraction-free eye dynamics.Biomed Opt Express. 2019 Jun 27;10(7):3663-3680. doi: 10.1364/BOE.10.003663. eCollection 2019 Jul 1. Biomed Opt Express. 2019. PMID: 31467798 Free PMC article.
References
-
- Levin L. A., Nilsson S. F. E., Ver Hoeve J., Wu S., Kaufman P. L., Alm A., Adler's Physiology of the Eye, Elsevier Health Sciences, Edinburgh 2011.
-
- Ambrosio R. Jr., Nogueira L. P., Caldas D. L., Fontes B. M., Luz A., Cazal J. O., Alves M. R., Belin M. W., Int. Ophthalmol. Clin. 2011, 51, 11. - PubMed
-
- Doughty M. J., Zaman M. L., Surv. Ophthalmol. 2000, 44, 367. - PubMed
-
- Brightbill F. S., McDonnell P. J., McGhee C. N. J., Farjo A. A., Serdarevic O., Corneal Surgery: Theory Technique and Tissue, 4th ed., Mosby Elsevier, St. Louis 2008.
Publication types
MeSH terms
LinkOut - more resources
Full Text Sources
Other Literature Sources
Miscellaneous

