

Reducing Glucokinase Activity Restores Endogenous Pulsatility and Enhances Insulin Secretion in Islets From db/db Mice
- PMID: 30239634
- PMCID: PMC6202857
- DOI: 10.1210/en.2018-00589
Reducing Glucokinase Activity Restores Endogenous Pulsatility and Enhances Insulin Secretion in Islets From db/db Mice
Abstract
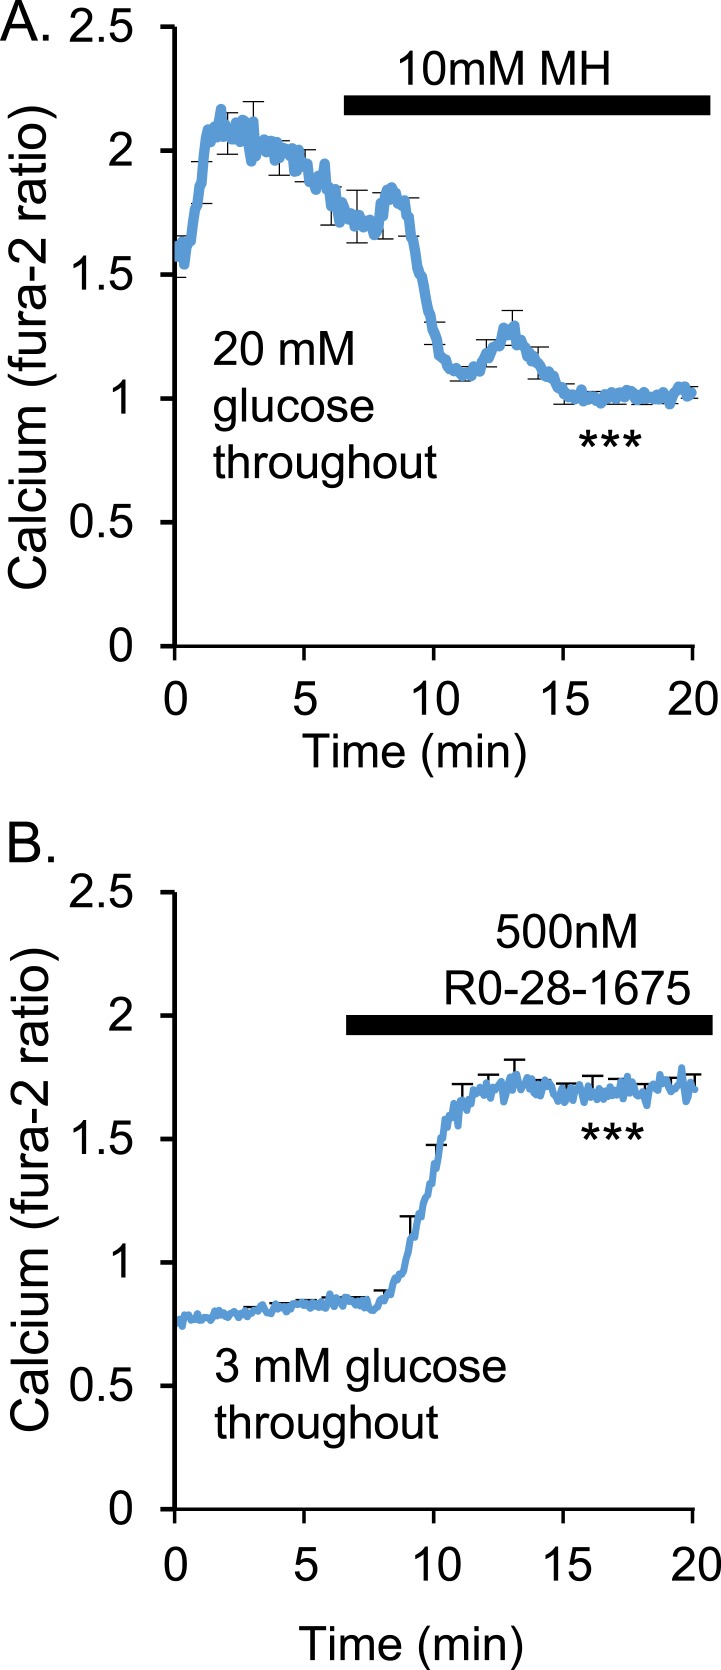
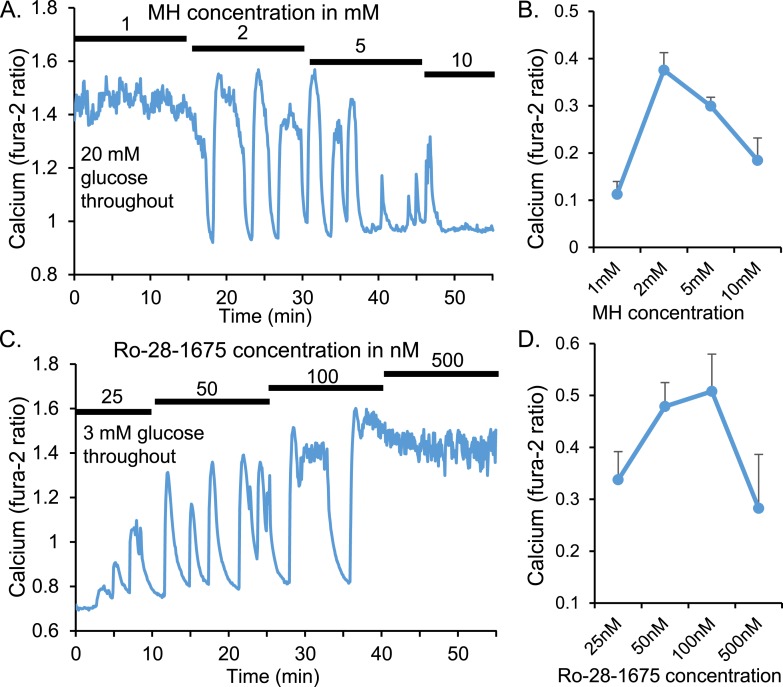
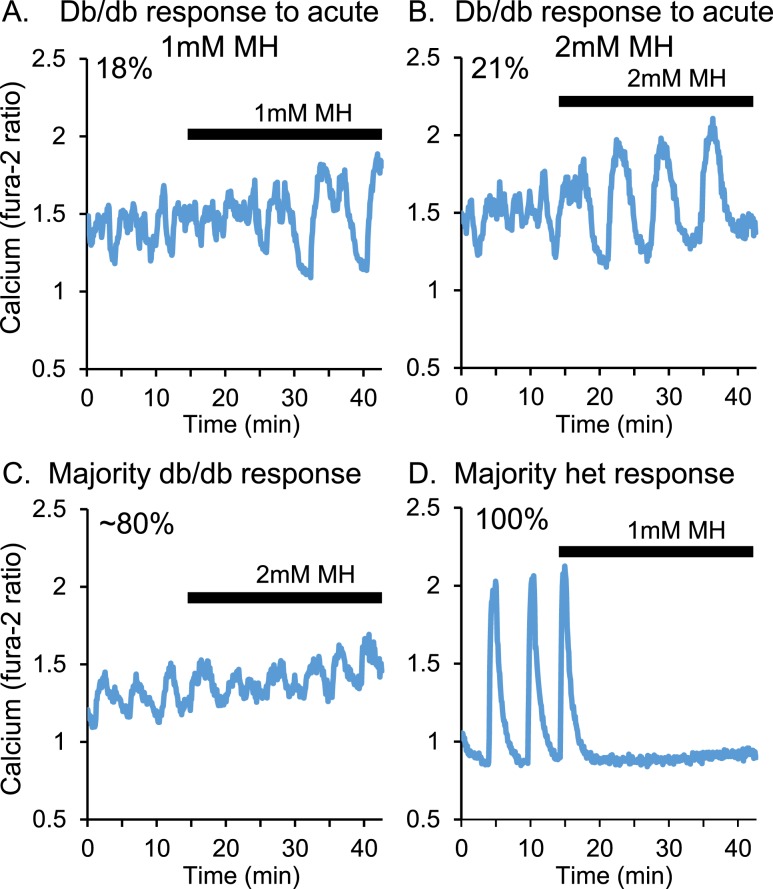
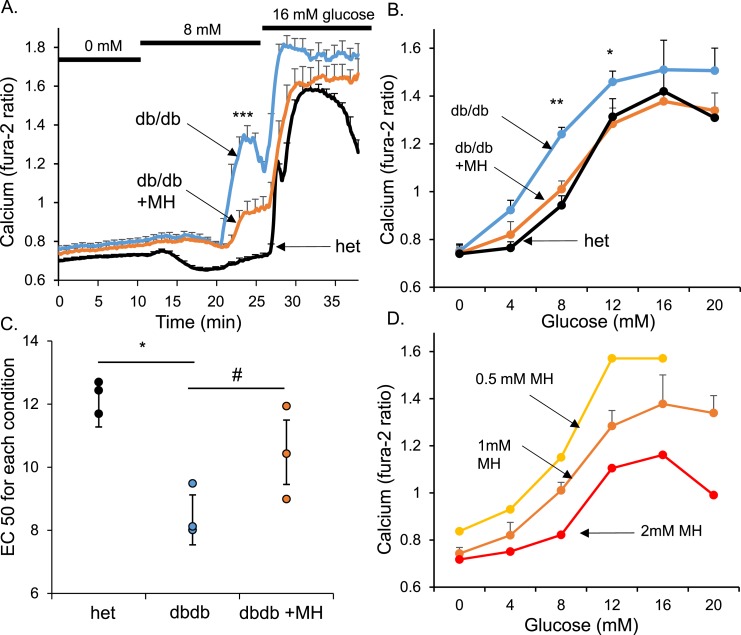
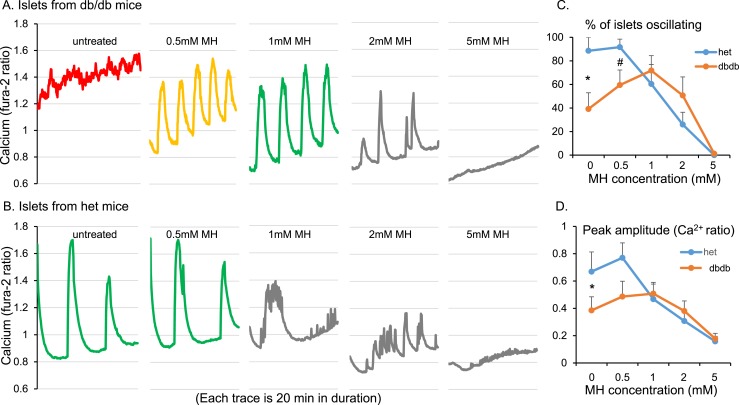
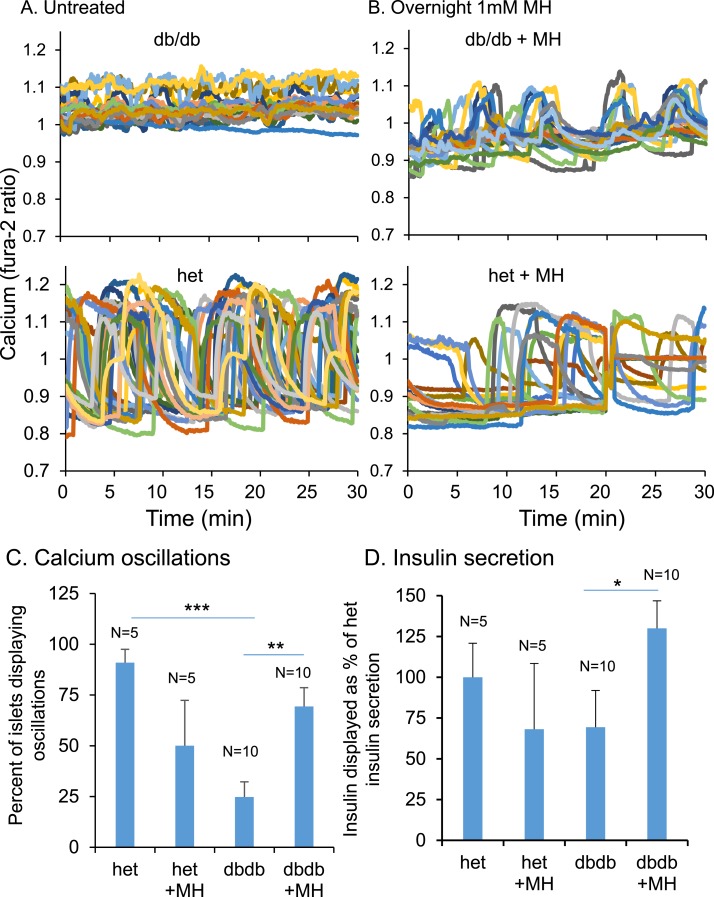
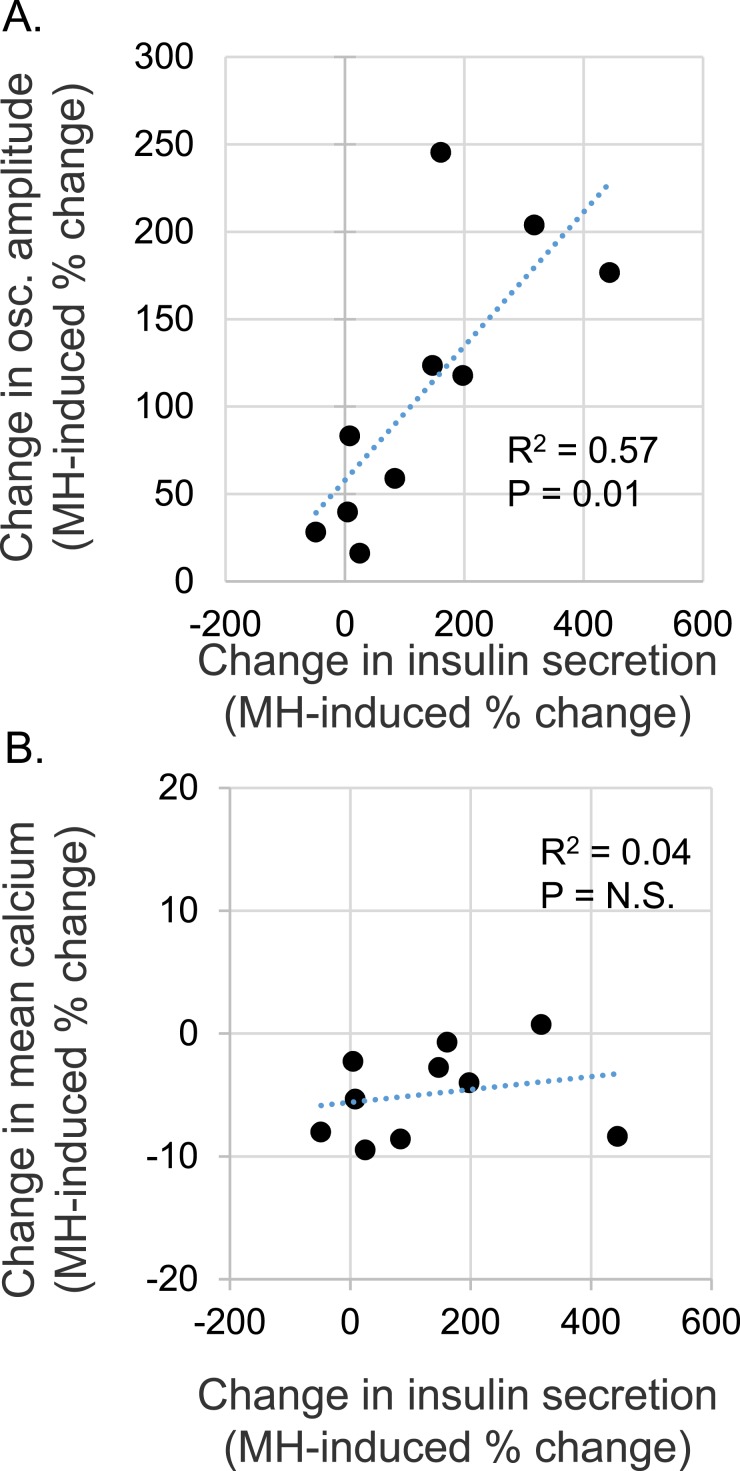
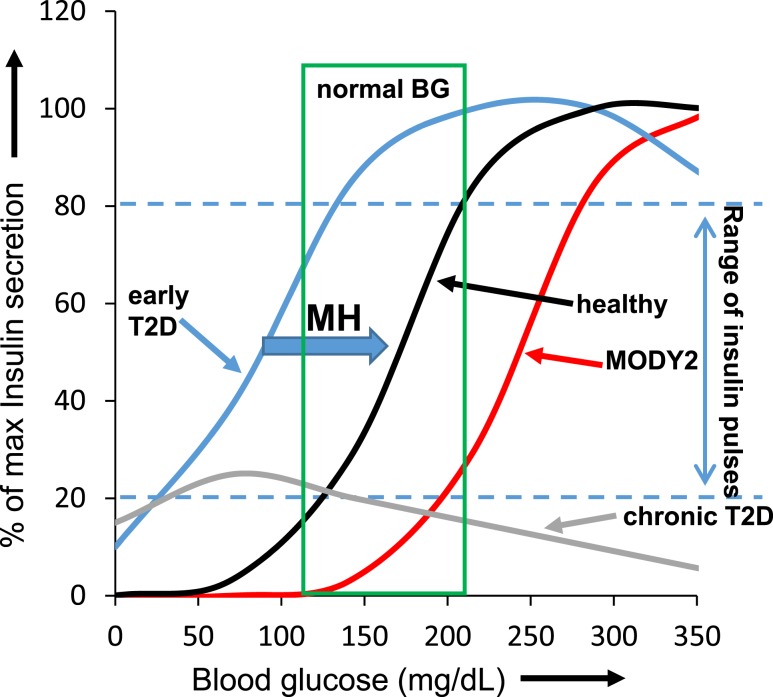
An early sign of islet failure in type 2 diabetes (T2D) is the loss of normal patterns of pulsatile insulin release. Disruptions in pulsatility are associated with a left shift in glucose sensing that can cause excessive insulin release in low glucose (relative hyperinsulinemia, a hallmark of early T2D) and β-cell exhaustion, leading to inadequate insulin release during hyperglycemia. Our hypothesis was that reducing excessive glucokinase activity in diabetic islets would improve their function. Isolated mouse islets were exposed to glucose and varying concentrations of the glucokinase inhibitor d-mannoheptulose (MH) to examine changes in intracellular calcium ([Ca2+]i) and insulin secretion. Acutely exposing islets from control CD-1 mice to MH in high glucose (20 mM) dose dependently reduced the size of [Ca2+]i oscillations detected by fura-2 acetoxymethyl. Glucokinase activation in low glucose (3 mM) had the opposite effect. We then treated islets from male and female db/db mice (age, 4 to 8 weeks) and heterozygous controls overnight with 0 to 10 mM MH to determine that 1 mM MH produced optimal oscillations. We then used 1 mM MH overnight to measure [Ca2+]i and insulin simultaneously in db/db islets. MH restored oscillations and increased insulin secretion. Insulin secretion rates correlated with MH-induced increases in amplitude of [Ca2+]i oscillations (R2 = 0.57, P < 0.01, n = 10) but not with mean [Ca2+]i levels in islets (R2 = 0.05, not significant). Our findings show that correcting glucose sensing can restore proper pulsatility to diabetic islets and improved pulsatility correlates with enhanced insulin secretion.
Figures
Similar articles
-
Islet Hypersensitivity to Glucose Is Associated With Disrupted Oscillations and Increased Impact of Proinflammatory Cytokines in Islets From Diabetes-Prone Male Mice.Endocrinology. 2016 May;157(5):1826-38. doi: 10.1210/en.2015-1879. Epub 2016 Mar 4. Endocrinology. 2016. PMID: 26943366 Free PMC article.
-
Metallothionein 1 negatively regulates glucose-stimulated insulin secretion and is differentially expressed in conditions of beta cell compensation and failure in mice and humans.Diabetologia. 2019 Dec;62(12):2273-2286. doi: 10.1007/s00125-019-05008-3. Epub 2019 Oct 17. Diabetologia. 2019. PMID: 31624901
-
Reducing Glucokinase Activity to Enhance Insulin Secretion: A Counterintuitive Theory to Preserve Cellular Function and Glucose Homeostasis.Front Endocrinol (Lausanne). 2020 Jun 9;11:378. doi: 10.3389/fendo.2020.00378. eCollection 2020. Front Endocrinol (Lausanne). 2020. PMID: 32582035 Free PMC article.
-
Glucokinase activity in diabetes: too much of a good thing?Trends Endocrinol Metab. 2023 Feb;34(2):119-130. doi: 10.1016/j.tem.2022.12.007. Epub 2022 Dec 29. Trends Endocrinol Metab. 2023. PMID: 36586779 Review.
-
Brain glucose sensing, glucokinase and neural control of metabolism and islet function.Diabetes Obes Metab. 2014 Sep;16 Suppl 1(Suppl 1):26-32. doi: 10.1111/dom.12334. Diabetes Obes Metab. 2014. PMID: 25200293 Free PMC article. Review.
Cited by
-
Genetic Reduction of Glucose Metabolism Preserves Functional β-Cell Mass in KATP-Induced Neonatal Diabetes.Diabetes. 2022 Jun 1;71(6):1233-1245. doi: 10.2337/db21-0992. Diabetes. 2022. PMID: 35294000 Free PMC article.
-
Brain Glucose Sensing and the Problem of Relative Hypoglycemia.Diabetes Care. 2023 Feb 1;46(2):237-244. doi: 10.2337/dc22-1445. Diabetes Care. 2023. PMID: 36701597 Free PMC article. Review.
-
Intact pancreatic islets and dispersed beta-cells both generate intracellular calcium oscillations but differ in their responsiveness to glucose.Cell Calcium. 2019 Nov;83:102081. doi: 10.1016/j.ceca.2019.102081. Epub 2019 Sep 16. Cell Calcium. 2019. PMID: 31563790 Free PMC article.
-
Altered glycolysis triggers impaired mitochondrial metabolism and mTORC1 activation in diabetic β-cells.Nat Commun. 2022 Nov 14;13(1):6754. doi: 10.1038/s41467-022-34095-x. Nat Commun. 2022. PMID: 36376280 Free PMC article.
-
Chronic stimulation induces adaptive potassium channel activity that restores calcium oscillations in pancreatic islets in vitro.Am J Physiol Endocrinol Metab. 2020 Apr 1;318(4):E554-E563. doi: 10.1152/ajpendo.00482.2019. Epub 2020 Feb 18. Am J Physiol Endocrinol Metab. 2020. PMID: 32069073 Free PMC article.
References
-
- Meglasson MD, Matschinsky FM. Pancreatic islet glucose metabolism and regulation of insulin secretion. Diabetes Metab Rev. 1986;2(3-4):163–214. - PubMed
-
- Ashcroft FM, Rorsman P. ATP-sensitive K+ channels: a link between B-cell metabolism and insulin secretion. Biochem Soc Trans. 1990;18(1):109–111. - PubMed
-
- Henquin JC. Regulation of insulin secretion: a matter of phase control and amplitude modulation. Diabetologia. 2009;52(5):739–751. - PubMed
-
- Henquin JC. Triggering and amplifying pathways of regulation of insulin secretion by glucose. Diabetes. 2000;49(11):1751–1760. - PubMed
Publication types
MeSH terms
Substances
Grants and funding
LinkOut - more resources
Full Text Sources
Other Literature Sources
Molecular Biology Databases
Miscellaneous
