Comparative Study
. 2019 Jan 1;21(1):163-174.
doi: 10.1093/europace/euy192.

Implications of bipolar voltage mapping and magnetic resonance imaging resolution in biventricular scar characterization after myocardial infarction

Affiliations
Comparative Study

Implications of bipolar voltage mapping and magnetic resonance imaging resolution in biventricular scar characterization after myocardial infarction

Mariña López-Yunta et al. Europace. .

Abstract

Aims: We aimed to study the differences in biventricular scar characterization using bipolar voltage mapping compared with state-of-the-art in vivo delayed gadolinium-enhanced cardiac magnetic resonance (LGE-CMR) imaging and ex vivo T1 mapping.

Methods and results: Ten pigs with established myocardial infarction (MI) underwent in vivo scar characterization using LGE-CMR imaging and high-density voltage mapping of both ventricles using a 3.5-mm tip catheter. Ex vivo post-contrast T1 mapping provided a high-resolution reference. Voltage maps were registered onto the left and right ventricular (LV and RV) endocardium, and epicardium of CMR-based geometries to compare voltage-derived scars with surface-projected 3D scars. Voltage-derived scar tissue of the LV endocardium and the epicardium resembled surface projections of 3D in vivo and ex vivo CMR-derived scars using 1-mm of surface projection distance. The thinner wall of the RV was especially sensitive to lower resolution in vivo LGE-CMR images, in which differences between normalized low bipolar voltage areas and CMR-derived scar areas did not decrease below a median of 8.84% [interquartile range (IQR) (3.58, 12.70%)]. Overall, voltage-derived scars and surface scar projections from in vivo LGE-CMR sequences showed larger normalized scar areas than high-resolution ex vivo images [12.87% (4.59, 27.15%), 18.51% (11.25, 24.61%), and 9.30% (3.84, 19.59%), respectively], despite having used optimized surface projection distances. Importantly, 43.02% (36.54, 48.72%) of voltage-derived scar areas from the LV endocardium were classified as non-enhanced healthy myocardium using ex vivo CMR imaging.

Conclusion: In vivo LGE-CMR sequences and high-density voltage mapping using a conventional linear catheter fail to provide accurate characterization of post-MI scar, limiting the specificity of voltage-based strategies and imaging-guided procedures.


Figures
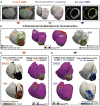
Figure 1
Figure 1
Experimental workflow. (A) In vivo and ex vivo imaging modalities for biventricular scar characterization. (B) 3D scar reconstructions obtained from each imaging modality. (C, D) Surface scar projections on the in vivo (C) and ex vivo (D) CMR-based geometries, and voltage-derived maps registered onto the endocardial and epicardial CMR geometries for comparisons. CMR, cardiac magnetic resonance; ENDO, endocardium; EPI, epicardium; LV, left ventricle; RV, right ventricle.
Figure 2
Figure 2
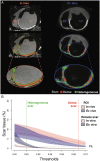
Myocardial and scar segmentation process. (A) Sample case of myocardial and scar segmentations from in vivo LGE-CMR images (left column) and ex vivo R1 images (right column). (B) Median (colour-coded lines) and interquartile range (colour-coded shadows) of normalized scar areas in each CMR slice at different signal intensity thresholds for in vivo and ex vivo images. Remote scar tissue (outside the infarct region), especially in ex vivo images, rapidly decreased from 0.40 to 0.45 cut-points of maximum signal intensity, which indicated the presence of false positive scar tissue and aided to establish the appropriate cut-off value for scar tissue. LV, left ventricle; ROI, region of interest; RV, right ventricle.
Figure 3
Figure 3
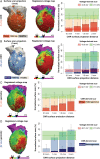
Left ventricular scar comparisons between registered voltage maps and CMR images. (A, B, left panel) Representative case of surface scar projections from in vivo (A) and ex vivo (B) CMR images, and registered voltage maps (middle-panel) using a very low voltage cut-off <0.5 mV onto the left ventricular geometries. On the right, surface scar projections of dense and heterogeneous scars at different projection distances from the endocardial border of in vivo (A) and ex vivo (B) CMR images. The median (red and green lines) and interquartile range (red and green shadows) of registered very low and low voltage-derived scars (<0.5 mV and <1.5 mV, respectively) are also represented. (C, D, left panel) Same representative registered voltage maps as in A (in vivo geometry), B (ex vivo geometry), using a very low voltage cut-off ≤0.1 mV. On the right, same data as in A, B using the ≤0.1 mV cut-off criterion for very low voltage-derived scars. Right panels show data from the entire group of animals (n = 10). Ao, aorta; CMR, cardiac magnetic resonance; MA, mitral annulus.
Figure 4
Figure 4
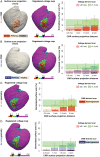
Epicardial scar comparisons between registered voltage maps and CMR images. (A, B, left panel) Representative case of surface scar projections from in vivo (A) and ex vivo (B) CMR images, and registered voltage maps (middle-panel) using a very low voltage cut-off <0.5 mV onto the epicardial geometries. On the right, surface scar projections of dense and heterogeneous scars at different projection distances from the epicardial border of in vivo (A) and ex vivo (B) CMR images. The median (red and green lines) and interquartile range (red and green shadows) of registered very low and low voltage-derived scars (<0.5 mV and <1.5 mV, respectively) are also represented. (C, D, left panel) Same representative registered voltage maps as in A (in vivo geometry), B (ex vivo geometry), using a very low voltage cut-off ≤0.1 mV. On the right, same data as in A, B using the ≤0.1 mV cut-off criterion for very low voltage-derived scars. Right panels show data from the entire group of animals (n = 10). CMR, cardiac magnetic resonance; RVOT, right ventricular outflow tract.
Figure 5
Figure 5
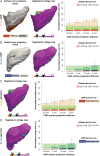
Right ventricular scar comparisons between registered voltage maps and CMR images. (A, B, left panel) Representative case of surface scar projections from in vivo (A) and ex vivo (B) CMR images, and registered voltage maps (mid-panel) using a very low voltage cut-off <0.5 mV onto the right ventricular geometries. On the right, surface scar projections of dense and heterogeneous scars at different projection distances from the endocardial border of in vivo (A) and ex vivo (B) CMR images. The median (red and green lines) and interquartile range (red and green shadows) of registered very low and low voltage-derived scars (<0.5 mV and <1.5 mV, respectively) are also represented. (C, D, left panel) Same representative registered voltage maps as in A (in vivo geometry), B (ex vivo geometry), using a very low voltage cut-off ≤0.1 mV. On the right, same data as in A, B using the ≤0.1 mV cut-off criterion for very low voltage-derived scars. Right panels show data from the entire group of animals (n = 10). CMR, cardiac magnetic resonance; RVOT, right ventricular outflow tract; TA, tricuspid annulus.
Figure 6
Figure 6
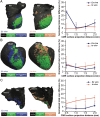
Scar differences among registered voltage maps and CMR images at different surface projection distances. (A–C, left panels) Overlapping scar regions (in green) between registered voltage maps onto the in vivo and ex vivo CMR geometries (A, LV; B, epicardium; C, RV) and CMR-derived scars. No overlapping scar regions, either voltage-derived or CMR-derived, are shown in blue. Right panels show normalized total scar differences (|voltage-derived scar – surface-projected CMR scar|/LV, RV, or epicardial surface) using sequential surface projection distances from in vivo and ex vivo CMR images. CMR, cardiac magnetic resonance; LV, left ventricle; RV, right ventricle. Ao, aorta; CMR, cardiac magnetic resonance; MA, mitral annulus; RVOT, right ventricular outflow tract; TA, tricuspid annulus.

Similar articles

Cited by

References

    1. Andreu D, Penela D, Acosta J, Fernandez-Armenta J, Perea RJ, Soto-Iglesias D. et al. Cardiac magnetic resonance-aided scar dechanneling: influence on acute and long-term outcomes. Heart Rhythm 2017;14:1121.. - PubMed
    1. Nuhrich JM, Kaiser L, Akbulak RO, Schaffer BN, Eickholt C, Schwarzl M. et al. Substrate characterization and catheter ablation in patients with scar-related ventricular tachycardia using ultra high-density 3-D mapping. J Cardiovasc Electrophysiol 2017;28:1058–67. - PubMed
    1. Amado LC, Gerber BL, Gupta SN, Rettmann DW, Szarf G, Schock R. et al. Accurate and objective infarct sizing by contrast-enhanced magnetic resonance imaging in a canine myocardial infarction model. J Am Coll Cardiol 2004;44:2383–9. - PubMed
    1. Santangeli P, Marchlinski FE.. Substrate mapping for unstable ventricular tachycardia. Heart Rhythm 2016;13:569–83. - PubMed
    1. Schuleri KH, Centola M, George RT, Amado LC, Evers KS, Kitagawa K. et al. Characterization of peri-infarct zone heterogeneity by contrast-enhanced multidetector computed tomography: a comparison with magnetic resonance imaging. J Am Coll Cardiol 2009;53:1699–707. - PMC - PubMed

Publication types

MeSH terms