Meta-Analysis
. 2019 Jan 1;28(1):166-174.
doi: 10.1093/hmg/ddy327.

Meta-analysis of genome-wide association studies for body fat distribution in 694 649 individuals of European ancestry

Affiliations
Meta-Analysis

Meta-analysis of genome-wide association studies for body fat distribution in 694 649 individuals of European ancestry

Sara L Pulit et al. Hum Mol Genet. .

Abstract

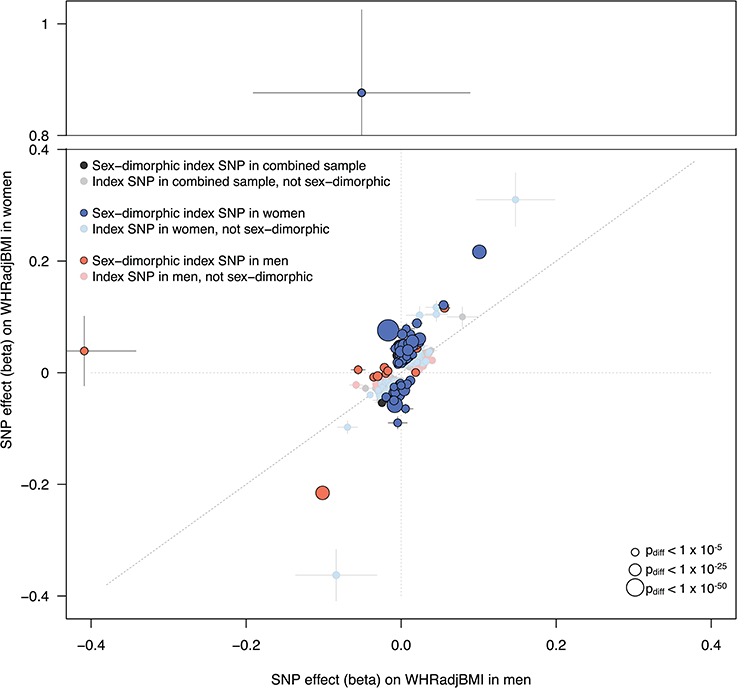
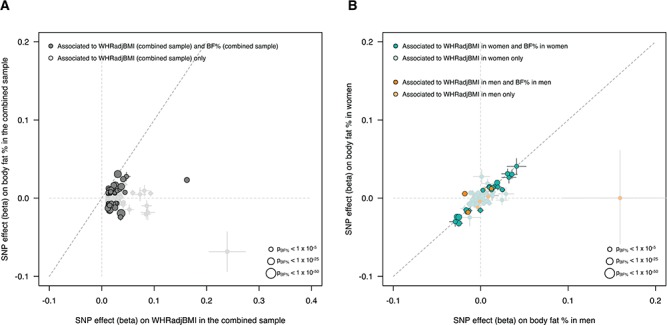
More than one in three adults worldwide is either overweight or obese. Epidemiological studies indicate that the location and distribution of excess fat, rather than general adiposity, are more informative for predicting risk of obesity sequelae, including cardiometabolic disease and cancer. We performed a genome-wide association study meta-analysis of body fat distribution, measured by waist-to-hip ratio (WHR) adjusted for body mass index (WHRadjBMI), and identified 463 signals in 346 loci. Heritability and variant effects were generally stronger in women than men, and we found approximately one-third of all signals to be sexually dimorphic. The 5% of individuals carrying the most WHRadjBMI-increasing alleles were 1.62 times more likely than the bottom 5% to have a WHR above the thresholds used for metabolic syndrome. These data, made publicly available, will inform the biology of body fat distribution and its relationship with disease.


Figures

Figure 1
Figure 1
Sex-dimorphic association signals in fat distribution. For each associated locus from either the combined or sex-specific meta-analyses, we tested the index SNP for sex dimorphism. We plot here all index SNPs from each of the three meta-analyses (combined, women only and men only). SNPs that are significantly sex-dimorphic (Pdiff < 3.3 × 10−5) are represented by boldly colored circles, while index SNPs that are not sex-dimorphic are plotted with faded colors. Despite the expectation that SNPs identified in the combined sample (men and women, grey points) will be biased away from sex dimorphism and index SNPs identified in the sex-specific sample will be biased towards sex dimorphism (due to winner’s curse), we observed stronger effects in women across all SNPs. Of the index SNPs from the men-only analysis (orange points), 14% showed evidence of sex dimorphism. In contrast, ∼29% of the index SNPs from the women-only analysis (blue points) show evidence of dimorphism. Of all sex-dimorphic SNPs, 92.4% show a stronger effect in women compared to men. Points are sized by the -log10(Pdiff) of the sex-dimorphism test. Horizontal bars indicate standard error in men; vertical bars indicate standard error in women.
Figure 2
Figure 2
Effects of WHRadjBMI-associated SNPs on body fat percentage. (A) We investigated the impact of the 346 WHRadjBMI index SNPs (discovered in the combined analysis) on BF% in 449 001 UK Biobank individuals. Of the 346 SNPs, 59 (17.1%) are associated with BF% (P < 0.05/346 = 1.44 × 10−4, dark grey points). We oriented the effects of the SNPs to the WHRadjBMI-increasing effect and found that 34 of the 59 BF%-associated SNPs associate with increased BF%, while 25 of the 59 associate with decreased BF%, indicating that WHRadjBMI-associated SNPs can affect BF% in both directions. (B) Given the sex-dimorphic signature observed in WHRadjBMI-associated SNPs and the increased number of SNPs with stronger effects on WHRadjBMI in women, we investigated the effect of the 105 sex-dimorphic index SNPs identified from the three meta-analyses (in the combined sample, in women only, in men only) on BF% in men or women separately. Of the 105 dimorphic SNPs, 97 were female specific (aquamarine points) and conferred a stronger effect on WHRadjBMI (on average) compared to the eight male-specific SNPs (orange points). We plot the 105 sex-dimorphic SNPs by their effect on BF% in men (x-axis) and in women (y-axis). Of the 105 SNPs, 56 associate with BF% (P < 0.05/05 = 4.8 × 10−3). Despite the fact that these SNPs confer different effects on WHRadjBMI within sex-specific groups, we found that they confer relatively similar effects in BF% in sex-specific groups. All points are scaled in size to their strength of association in BF%.

References

    1. GBD 2015 Obesity Collaborators, Afshin A., Forouzanfar M.H., Reitsma M.B., Sur P., Estep K., Lee A., Marczak L., Mokdad A.H., Moradi-Lakeh M. et al. (2017) Health effects of overweight and obesity in 195 countries over 25 years.N. Engl. J. Med., 377, 13–27. - PMC - PubMed
    1. WHO | Obesity and overweight (2018) WHO | Obesity and overweight. http://www.who.int/mediacentre/factsheets/fs311/en/Accessed February 22, 2018.
    1. Heymsfield S.B. and Wadden T.A. (2017) Mechanisms, pathophysiology, and management of obesity. N. Engl. J. Med., 376, 254–266. - PubMed
    1. Wang Y., Rimm E.B., Stampfer M.J., Willett W.C. and Hu F.B. (2005) Comparison of abdominal adiposity and overall obesity in predicting risk of type 2 diabetes among men1–3. Am. J. Clin. Nutr., 81, 555–563. - PubMed
    1. Shungin D., Winkler T.W., Croteau-Chonka D.C., Ferreira T., Locke A.E., Mägi R., Strawbridge R.J., Pers T.H., Fischer K., Justice A.E. et al. (2015) New genetic loci link adipose and insulin biology to body fat distribution. Nature, 518,187–196. - PMC - PubMed

Publication types