. 2018 Nov 2;46(19):10225-10245.
doi: 10.1093/nar/gky841.

COPII vesicles can affect the activity of antisense oligonucleotides by facilitating the release of oligonucleotides from endocytic pathways

Affiliations

COPII vesicles can affect the activity of antisense oligonucleotides by facilitating the release of oligonucleotides from endocytic pathways

Xue-Hai Liang et al. Nucleic Acids Res. .

Abstract

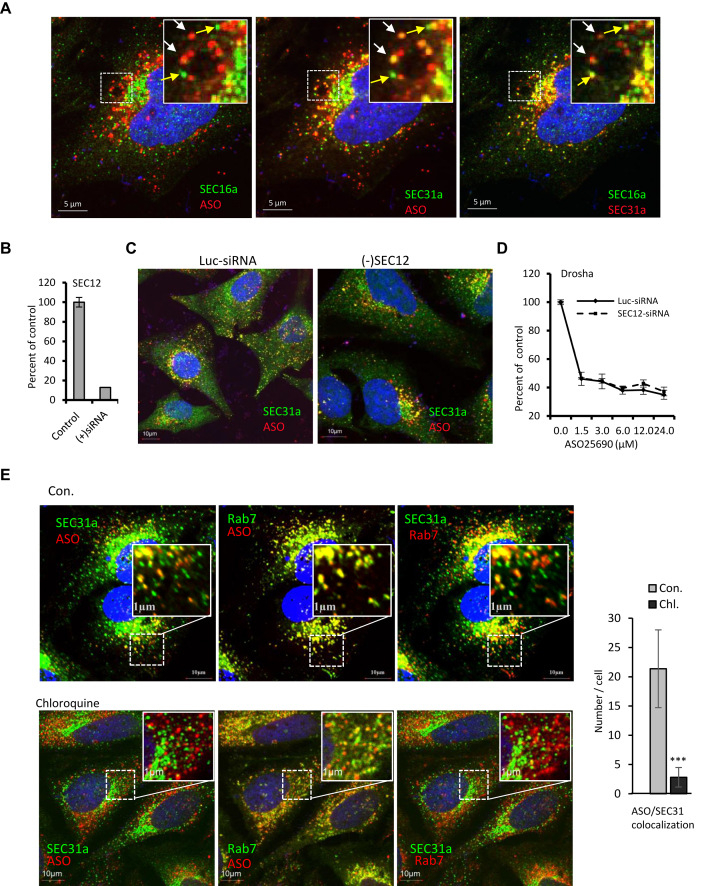
RNase H1-dependent, phosphorothioate-modified antisense oligonucleotides (PS-ASOs) can enter cells through endocytic pathways and need to be released from the membrane-enclosed organelles, a limiting step for antisense activity. Accumulating evidence has suggested that productive PS-ASO release mainly occurs from late endosomes (LEs). However, how PS-ASOs escape from LEs is not well understood. Here, we report that upon PS-ASO incubation, COPII vesicles, normally involved in ER-Golgi transport, can re-locate to PS-ASO-containing LEs. Reduction of COPII coat proteins significantly decreased PS-ASO activity, without affecting the levels of PS-ASO uptake and early-to-late endosome transport, but caused slower PS-ASO release from LEs. COPII co-localization with PS-ASOs at LEs does not require de novo assembly of COPII at ER. Interestingly, reduction of STX5 and P115, proteins involved in tethering and fusion of COPII vesicles with Golgi membranes, impaired COPII re-localization to LEs and decreased PS-ASO activity. STX5 can re-locate to LEs upon PS-ASO incubation, can bind PS-ASOs, and the binding appears to be required for this pathway. Our study reveals a novel release pathway in which PS-ASO incubation causes LE re-localization of STX5, which mediates the recruitment of COPII vesicles to LEs to facilitate endosomal PS-ASO release, and identifies another key PS-ASO binding protein.


Figures

Figure 1.
Figure 1.
COPII coat proteins can co-localize with ASOs. (A) Immunofluorescent staining for SEC31a in HeLa cells incubated with 2 μM ASO446654 for 16 h. (B) Immunofluorescent staining for Sar1b in HeLa cells incubated with 2 μM ASO446654 for 16 h. (C) Co-staining of SEC31a and Sar1 in HeLa cells incubated with ASOs for 16 h. ASO–protein or protein–protein co-localization is exemplified by arrows. The nucleus was stained with DAPI (blue). ASOs are shown in red. Proteins are shown in green or cyan, as indicated in the figures; scale bars, 10 μm. (D) Immunofluorescent staining for SEC31a and Sar1b as in panel (B). Co-localizations are exemplified by arrows. (E) 3D-imaging of the same view as in panel (D). The same foci are marked by arrows and numbered as in panel (D).
Figure 2.
Figure 2.
ASO/COPII co-localization is time dependent. (A) Staining of SEC31a (green) in HeLa cells incubated with 2 μM ASOs (red) for different times, as indicated. Examples of ASO-SEC31a co-localization are circled; scale bars,10 μm. (B) Quantification of ASO/SEC31a co-localization, as detected in panel (A). P-values were calculated based on unpaired t-test using prism. (C) qRT-PCR quantification for the levels of NCL and Drosha mRNAs in cells incubated for different times with 10 μM NCL-targeting ASO110080 or Drosha-targeting ASO25960. The error bars represent standard deviations from three independent experiments. (D) Quantification of ASO/COPII co-localization in HeLa cells incubated with 2 μM ASOs for different times, as indicated. Error bars are standard deviations of co-localization events counted from 20 cells in each case. P-values were calculated based on unpaired t-test using prism. NS, not significant; *, P<0.05; **, P<0.01; ***, P<0.001. We note that the experiments were performed three times and similar trends were observed.
Figure 3.
Figure 3.
COPII vesicles can co-localize with ASOs at LEs. (A) Immunofluorescent staining of SEC31a and Rab7 in HeLa cells incubated with 2 μM ASOs for 16 h. Nucleus was stained with DAPI; scale bars, 10 μm. (B) Co-staining of SEC31a and LAMP1 in HeLa cells incubated with ASOs as above. Yellow arrows exemplify SEC31a overlapping with LAMP1-stained foci. White arrows indicate COPII/ASO foci partially overlapping with the limiting membranes of LAMP1-stained foci; scale bars, 5 μm. The boxed region was enlarged and Z-section image was taken, as shown in panels (C), (D) and (E), using the same color code. (C) An enlarged image area as boxed in Figure 3B–f. The dashed line indicates the section used to analyze signal intensity profile, as shown in panel (D). The LAMP1 staining boundaries of one organelle (a,b) and the center of another organelle (c) are indicated. (E) A 3D image for the enlarged foci.
Figure 4.
Figure 4.
Reduction of COPII coat proteins decreased ASO activity. (A) Reduction of SEC23 and SEC31a proteins in HeLa cells treated with siRNAs for 72 h. Left panel, qRT-PCR quantification for the levels of two isoforms of SEC23. Right panel, western analyses for SEC23a and SEC31a proteins. P32 was as a control for loading. (B) qRT-PCR quantification for the levels of NCL mRNA in siRNA-treated HeLa cells that were incubated with ASO for overnight. (C) qRT-PCR quantification for the levels of Drosha mRNA, as in panel (B). (D) Western analyses of the levels of SEC31a and Sar1 proteins in A431 cells treated with siRNAs for 72 h. Sar1 was detected using an antibody that recognizes both isoforms (07-692, Millipore). The levels of other proteins known to be important for ASO activity were also determined. GAPDH was served as a control for loading. The siRNA-treated A431 cells were incubated for overnight with different ASOs targeting NCL (panel (E)), Drosha (F and G), or Malat1 (H) RNAs. The levels of the targeted RNAs were determined by qRT-PCR. The error bars represent standard deviations from three independent experiments. P-values were calculated with F-test using Prism.
Figure 5.
Figure 5.
Reduction of COPII coat proteins can impair ASO release from endocytic pathways. (A) Flow cytometry analysis of the levels of ASO uptake in control or SAR1 siRNA-treated HeLa cells. (B) Flow cytometry analysis of the levels of ASO uptake in control or SEC31a siRNA-treated HeLa cells; RSU, relative fluorescence unit. The error bars represent standard deviations from three independent experiments. P-values were calculated using unpaired t-test. (C) quantification of ASO localization to EE or LE at 20 or 40 min after ASO incubation in HeLa cells treated with different siRNAs. The error bars represent standard deviations of the results counted from 20 cells in each case. P-values were calculated using unpaired t-test. (D) Reduction of SEC31a decreased ASO activity when ASO uptake was terminated early. Upper panel indicates the procedure of ASO incubation, removal and time points for cell harvest. Lower panel indicates the qRT-PCR quantification of Drosha mRNA in HeLa cells incubated with ASOs for different times. The error bars represent standard deviations from three independent experiments. P-values were calculated with F-test using Prism.
Figure 6.
Figure 6.
COPII/ASO co-localization does not require de novo COPII assembly at ERES. (A) Immunofluorescent staining of SEC16a and SEC31a in HeLa cells incubated with 2 μM ASO446654 for 16 h. ASO/SEC31a co-localization is indicated with white arrows, whereas SEC16a/SEC31a co-localization is marked with yellow arrows. (B) qRT-PCR quantification for the level of SEC12 mRNA in HeLa cells treated with luciferase siRNA (control) or SEC12 specific siRNA [(+)siRNA]. (C) Immunofluorescent staining of SEC31a in siRNA-treated HeLa cells incubated with 2 μM ASO446654 for 16 h. (D) qRT-PCR quantification for the levels of Drosha mRNA in siRNA-treated HeLa cells incubated with ASOs. The error bars represent standard deviations from three independent experiments. (E) Immunofluorescent staining of SEC31a and Rab7 in HeLa cells incubated with 2 μM ASOs for 16 h, followed by treatment with control DMSO for 1 h (upper panel), or with 100 μM chloroquine for 1 h (lower panel); scale bars, 10 μm. ASO/SEC31a co-localization events were quantified and plotted in right panel. P-value was calculated based on unpaired t-test. ***, P<0.001.
Figure 7.
Figure 7.
STX5 can re-locate to LEs upon ASO incubation. (A) Co-staining of STX5 and SEC31a in HeLa cells without ASO incubation. Occasional co-localization in scattered cytoplasmic foci is marked with arrows. (B) Co-staining of STX5 and SEC31a in HeLa cells incubated with 2 μM ASO446654 for 16 h. STX5/SEC31a/ASO co-localization is marked with white arrows in the enlarged images, whereas ASO negative STX5/SEC31a co-localization is exemplified with yellow arrows; scale bars, 10 μm. (C) Co-staining of STX5 and SEC31a in HeLa cells treated with 2 μM ASO446654 for 16 h, following by treatment with chloroquine for an additional 1 h; scale bars, 5 μm. (D) Quantification of ASO/STX5 and ASO/SEC31a co-localization at different times after ASO incubation in HeLa cells. Error bars indicate standard deviations of co-localization events as counted in 20 cells in each case. P-values were calculated using unpaired t-test. **, P<0.01; ***, P<0.001.
Figure 8.
Figure 8.
Reduction of STX5 and P115 reduced ASO Activity and ASO/COPII co-localization. (A) Western analysis for the levels of STX5 proteins in A431 cells treated with different siRNAs. P32 was served as a control for loading. Control or STX5-reduced cells were incubated with ASOs targeting Drosha mRNA (B) or Malat1 RNA (C), and the levels of the targeted RNAs were analyzed using qRT-PCR. (D) Western analysis for the levels of P115 in siRNA-treated A431 cells. P32 was served as a control for loading. Control or P115-reduced cells were incubated with ASOs targeting Drosha (E) or Malat1 (F), and the levels of the targeted RNAs were analyzed using qRT-PCR. The error bars represent standard deviations from three independent experiments. (G) Immunofluorescent staining of SEC31a in HeLa cells treated with different siRNAs for 56 h, followed by incubation with 2 μM ASO446654 for an additional 16 h. The co-localization between ASO and SEC31a is marked with circle; scale bars, 5 μm. (H) Quantification of ASO/COPII co-localization in HeLa cells treated with different siRNAs as in panel (G). Error bars indicate standard deviations of co-localization events as counted in 20 cells in each case. P-values were calculated using F-test except panel (H), which was calculated using t-test; ***P < 0.001. (I) qRT-PCR quantification for the levels of mRNAs in A431 cells treated with different siRNAs. (J) qRT-PCR quantification for the levels of Drosha mRNA in different test cells treated with ASO25691 for overnight. (K) qRT-PCR quantification for the levels of Malat1 RNA in different test cells treated with ASO395254 for overnight. The error bars represent standard deviations from three independent experiments. P-values were calculated using F-test with Prism.
Figure 9.
Figure 9.
ASO/STX5 co-localization at LEs is most likely mediated by ASO–protein interactions. (A) Western analyses for STX5 protein co-selected with a biotinylated PS-MOE ASO. Ku80 was used as a positive control. *, a non-specific protein band. (B) BRET assay for binding of STX5 and ASOs (XL948-XL952) with different numbers of continuous PS using a competition study. The binding kd are present below the curves. (C) Immunofluorescent staining of SEC31a and STX5 in HeLa cells incubated for 16 h with 3 μM Cy3-labeled ASOs (XL953-XL958) containing different numbers of PS-modified nucleotides, as indicated above the panels. ASO/Protein co-localization is exemplified with arrows. (D) Quantification of ASO/STX5 co-localization events. Error bars indicate standard deviations of co-localization events as determined from 20 cells. The experiments were performed twice and similar trends were observed. P-values were calculated based on unpaired t-test. ***, P<0.001; ****, P<0.0001. (E) Immunofluorescent staining of STX5 and SEC31a in HepG2 cells incubated with 2 μM GalNAc-conjugated ASO730437 linked with PS backbones. (F) Immunofluorescent staining of STX5 and SEC31a in HepG2 cells incubated with 2 μM GalNAc-conjugated ASO841226 linked with PO backbones; scale bars, 10 μm.
Figure 10.
Figure 10.
A proposed model for COPII vesicle-mediated ASO release from endosomes. (A) A potential pathway of COPII recruitment to the LEs upon ASO incubation. ASOs present in LEs can interact with STX5, leading to re-localization of STX5 to LEs. This process may be mediated by other ASO-binding proteins that can either translocate from EE to LE during ASO trafficking, or be recruited from cytosol upon ASO incubation, as indicated by question marks. LE-localized STX5 may in turn recruit COPII vesicles that are pre-assembled and budded from ER, in a way mediated by P115. STX5/COPII re-localization to LEs occurs at later time (6–8 h) after ASO incubation, in contrast to ANXA2, which can be co-transported from EE to LE during ASO trafficking, and re-locate to LEs within 1–2 h after ASO incubation, and can also be present in ILVs. (B) A proposed model for COPII-mediated ASO release from LEs. Upon internalization, ASOs enter EEs and LEs, and ultimately reach lysosomes. Accumulation of ASOs in LEs may recruit some proteins, including STX5 and other proteins, to LEs. These proteins can mediate the LE re-localization of COPII vesicles, which are pre-assembled at ERES and already leave ER. Interaction of COPII vesicles with LE may trigger membrane deformation, leading to ASO release from LE to the cytosol. On the other hand, COPII vesicles may also extract some ASOs from LEs. In addition, ASOs present in ILVs inside LEs can also be released via back-fusion processes mediated by ANXA2 and likely other proteins as well. Thus, in this model we show two independent pathways that can result in LE accumulation and release of PS-ASOs and we suspect that there are other pathways yet to be discovered.

References

    1. Dias N., Stein C.A.. Antisense oligonucleotides: basic concepts and mechanisms. Mol. Cancer Ther. 2002; 1:347–355. - PubMed
    1. Crooke S.T., Vickers T., Lima W.F., Wu H.-J.. Crooke ST. Mechanisms of Antisense Drug Action, an Introduction. Antisense Drug Technology: Principles, Strategies, and Applications. 2008; 2nd ednBoca Raton: CRC Press; 3–46.
    1. Crooke S.T., Witztum J.L., Bennett C.F., Baker B.F.. RNA-Targeted therapeutics. Cell metabolism. 2018; 27:714–739. - PubMed
    1. Bennett C.F., Baker B.F., Pham N., Swayze E., Geary R.S.. Pharmacology of antisense drugs. Annu. Rev. Pharmacol. Toxicol. 2017; 57:81–105. - PubMed
    1. Bennett C.F., Swayze E.E.. RNA targeting therapeutics: molecular mechanisms of antisense oligonucleotides as a therapeutic platform. Annu. Rev. Pharmacol. Toxicol. 2010; 50:259–293. - PubMed

Publication types

Substances

LinkOut - more resources