

Type 2 diabetes genetic loci informed by multi-trait associations point to disease mechanisms and subtypes: A soft clustering analysis
- PMID: 30240442
- PMCID: PMC6150463
- DOI: 10.1371/journal.pmed.1002654
Type 2 diabetes genetic loci informed by multi-trait associations point to disease mechanisms and subtypes: A soft clustering analysis
Abstract
Background: Type 2 diabetes (T2D) is a heterogeneous disease for which (1) disease-causing pathways are incompletely understood and (2) subclassification may improve patient management. Unlike other biomarkers, germline genetic markers do not change with disease progression or treatment. In this paper, we test whether a germline genetic approach informed by physiology can be used to deconstruct T2D heterogeneity. First, we aimed to categorize genetic loci into groups representing likely disease mechanistic pathways. Second, we asked whether the novel clusters of genetic loci we identified have any broad clinical consequence, as assessed in four separate subsets of individuals with T2D.
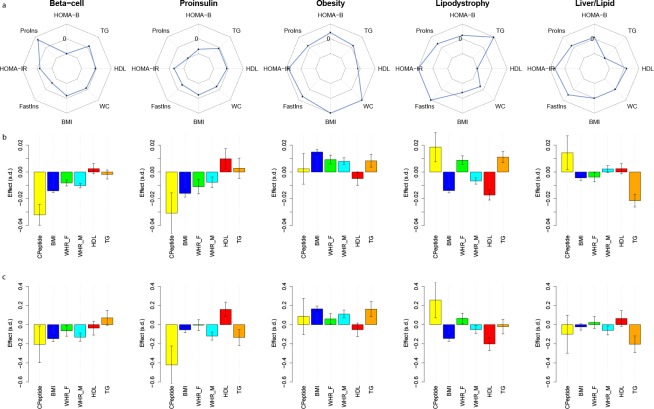
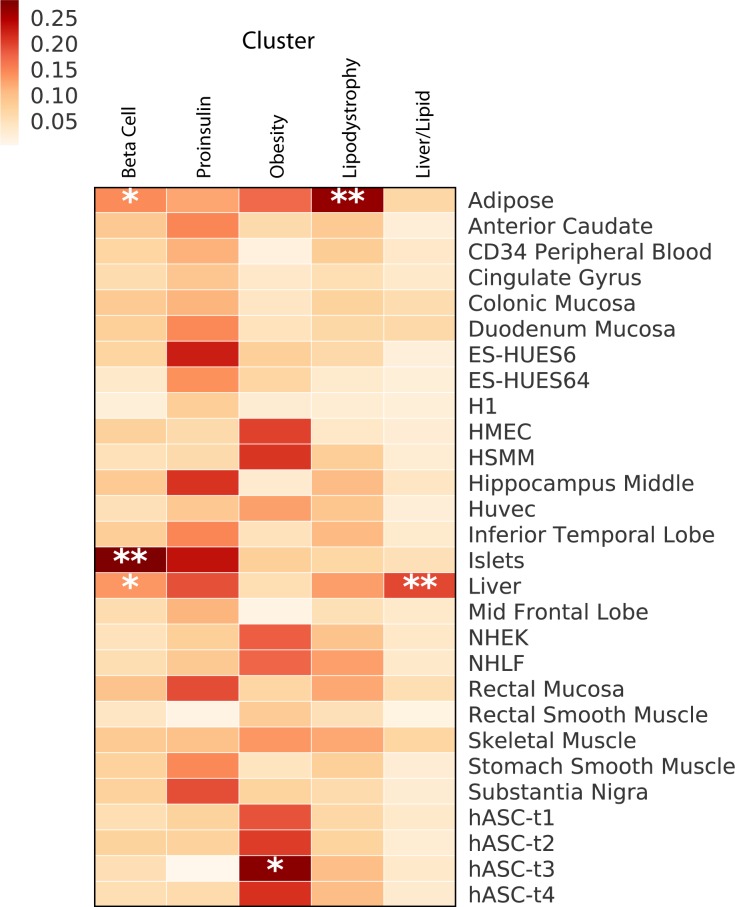
Methods and findings: In an effort to identify mechanistic pathways driven by established T2D genetic loci, we applied Bayesian nonnegative matrix factorization (bNMF) clustering to genome-wide association study (GWAS) results for 94 independent T2D genetic variants and 47 diabetes-related traits. We identified five robust clusters of T2D loci and traits, each with distinct tissue-specific enhancer enrichment based on analysis of epigenomic data from 28 cell types. Two clusters contained variant-trait associations indicative of reduced beta cell function, differing from each other by high versus low proinsulin levels. The three other clusters displayed features of insulin resistance: obesity mediated (high body mass index [BMI] and waist circumference [WC]), "lipodystrophy-like" fat distribution (low BMI, adiponectin, and high-density lipoprotein [HDL] cholesterol, and high triglycerides), and disrupted liver lipid metabolism (low triglycerides). Increased cluster genetic risk scores were associated with distinct clinical outcomes, including increased blood pressure, coronary artery disease (CAD), and stroke. We evaluated the potential for clinical impact of these clusters in four studies containing individuals with T2D (Metabolic Syndrome in Men Study [METSIM], N = 487; Ashkenazi, N = 509; Partners Biobank, N = 2,065; UK Biobank [UKBB], N = 14,813). Individuals with T2D in the top genetic risk score decile for each cluster reproducibly exhibited the predicted cluster-associated phenotypes, with approximately 30% of all individuals assigned to just one cluster top decile. Limitations of this study include that the genetic variants used in the cluster analysis were restricted to those associated with T2D in populations of European ancestry.
Conclusion: Our approach identifies salient T2D genetically anchored and physiologically informed pathways, and supports the use of genetics to deconstruct T2D heterogeneity. Classification of patients by these genetic pathways may offer a step toward genetically informed T2D patient management.
Conflict of interest statement
The authors have declared that no competing interests exist.
Figures
References
-
- National Diabetes Statistics Report. Centers for Disease Control and Prevention, Services UDoHaH; 2017 [cited 2018 May 8]. Available from: https://www.cdc.gov/diabetes/data/statistics/statistics-report.html.
Publication types
MeSH terms
Substances
Grants and funding
LinkOut - more resources
Full Text Sources
Other Literature Sources
Medical
Miscellaneous
