. 2019 Jan;40(1):262-283.
doi: 10.1002/hbm.24370. Epub 2018 Sep 21.

Mapping adolescent reward anticipation, receipt, and prediction error during the monetary incentive delay task

Affiliations

Mapping adolescent reward anticipation, receipt, and prediction error during the monetary incentive delay task

Zhipeng Cao et al. Hum Brain Mapp. 2019 Jan.

Abstract

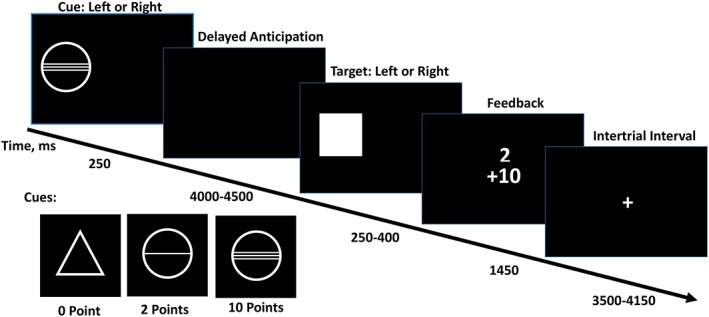
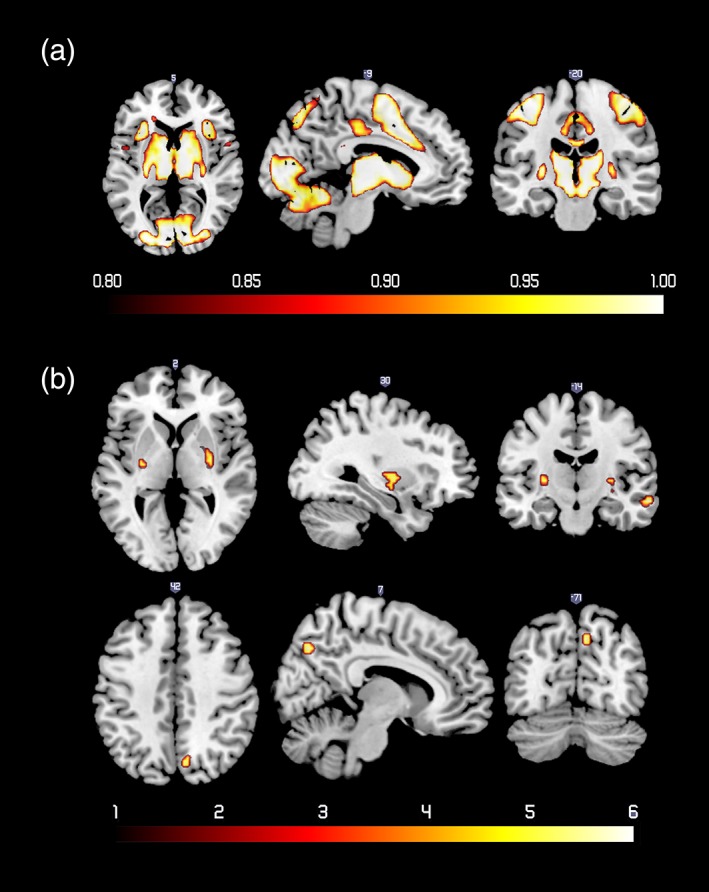
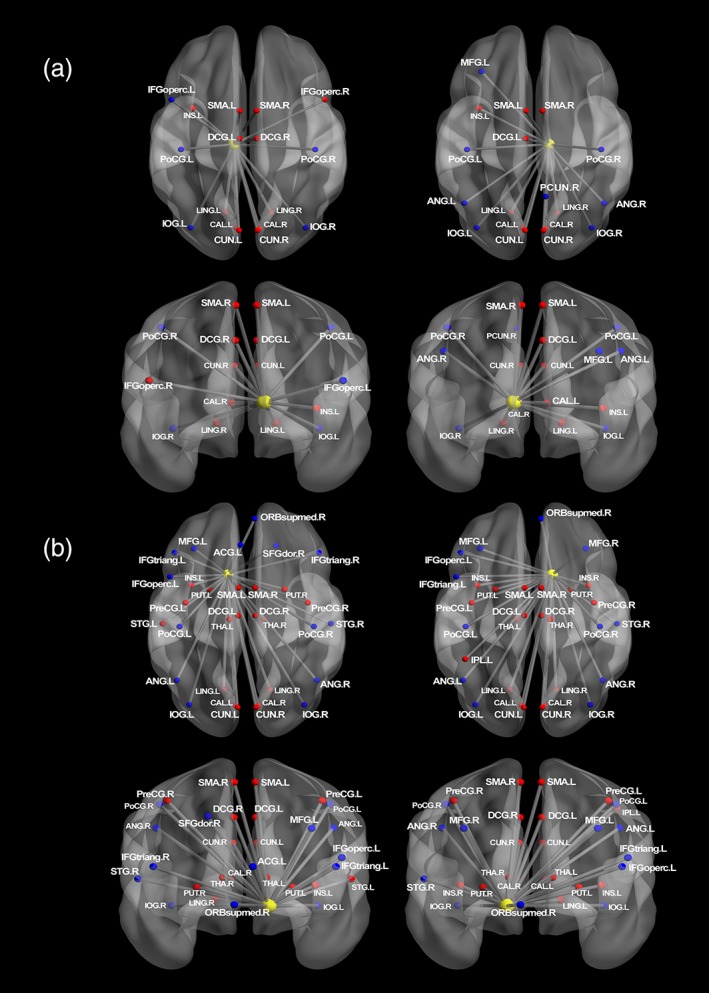
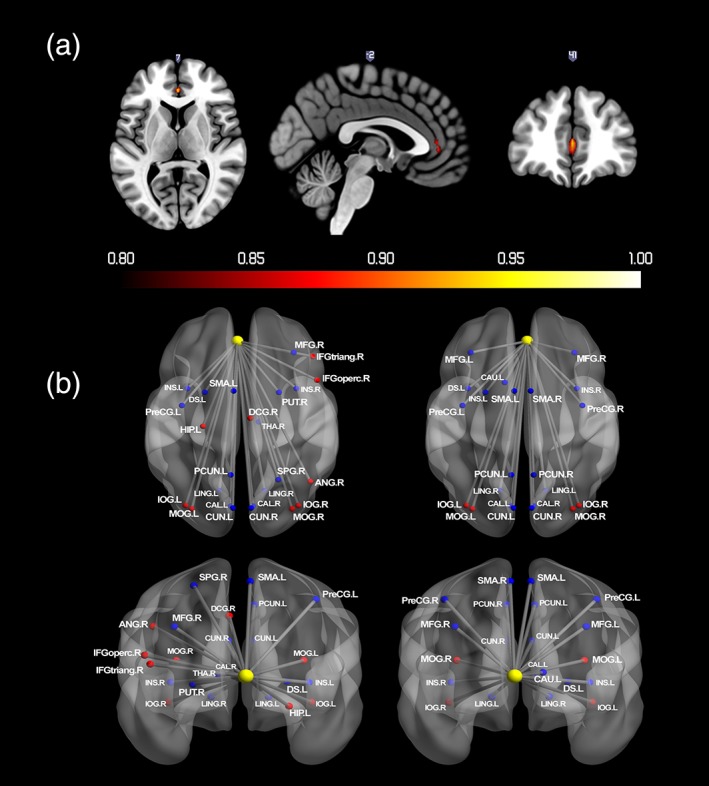
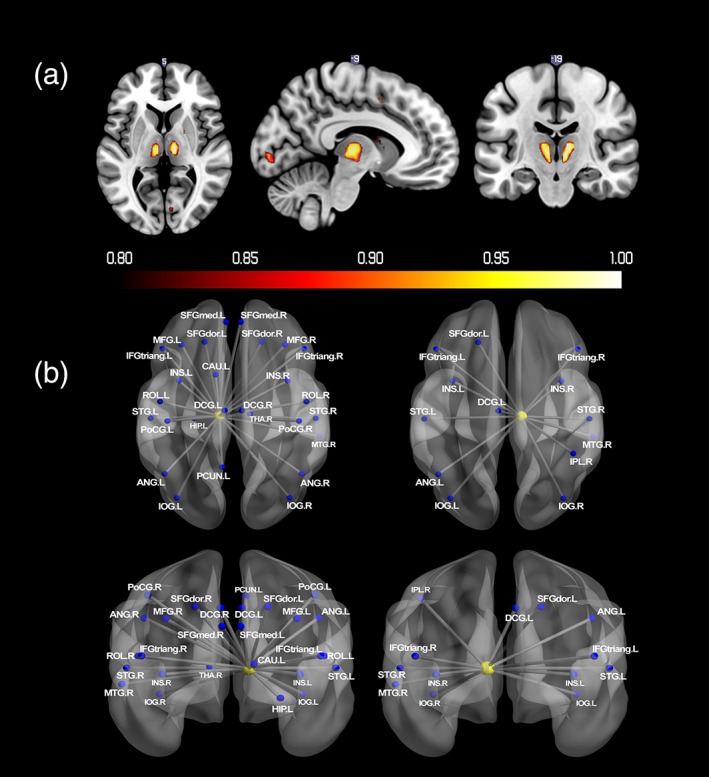
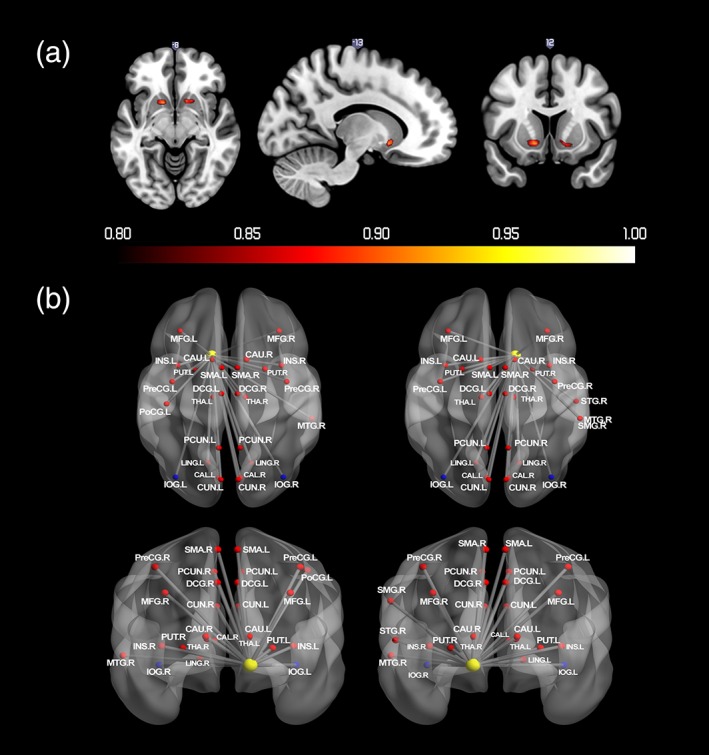
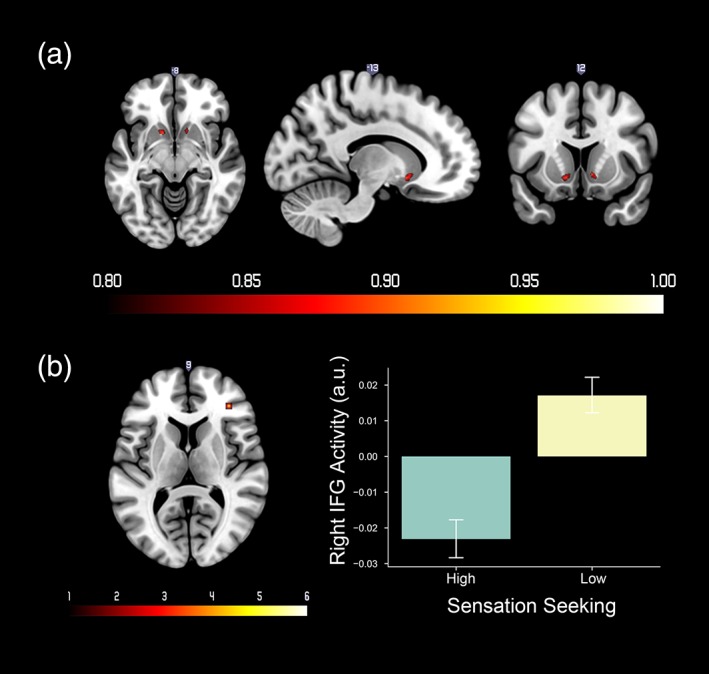
The functional neuroanatomy and connectivity of reward processing in adults are well documented, with relatively less research on adolescents, a notable gap given this developmental period's association with altered reward sensitivity. Here, a large sample (n = 1,510) of adolescents performed the monetary incentive delay (MID) task during functional magnetic resonance imaging. Probabilistic maps identified brain regions that were reliably responsive to reward anticipation and receipt, and to prediction errors derived from a computational model. Psychophysiological interactions analyses were used to examine functional connections throughout reward processing. Bilateral ventral striatum, pallidum, insula, thalamus, hippocampus, cingulate cortex, midbrain, motor area, and occipital areas were reliably activated during reward anticipation. Bilateral ventromedial prefrontal cortex and bilateral thalamus exhibited positive and negative activation, respectively, during reward receipt. Bilateral ventral striatum was reliably active following prediction errors. Previously, individual differences in the personality trait of sensation seeking were shown to be related to individual differences in sensitivity to reward outcome. Here, we found that sensation seeking scores were negatively correlated with right inferior frontal gyrus activity following reward prediction errors estimated using a computational model. Psychophysiological interactions demonstrated widespread cortical and subcortical connectivity during reward processing, including connectivity between reward-related regions with motor areas and the salience network. Males had more activation in left putamen, right precuneus, and middle temporal gyrus during reward anticipation. In summary, we found that, in adolescents, different reward processing stages during the MID task were robustly associated with distinctive patterns of activation and of connectivity.

Keywords: adolescence; functional connectivity; gender differences; reward processing; sensation seeking.


Conflict of interest statement

Dr. Banaschewski served in an advisory or consultancy role for Actelion, Hexal Pharma, Lilly,Lundbeck, Medice, Novartis, Shire. He received conference support or speaker's fee by Lilly, Medice Novartis and Shire. He has been involved in clinical trials conducted by Shire & Viforpharma. He received royalities from Hogrefe, Kohlhammer, CIP Medien, Oxford University Press. The present work is unrelated to the above grants and relationships. Dr Barker has received funding for a PhD student and honoraria for teaching on scanner programming courses from General Electric Healthcare; he acts as a consultant for IXICO. Dr Walter received a speaker honorarium from Servier (2014).The other authors report no biomedical financial interests or potential conflicts of interest.

Figures

Figure 1
Figure 1
Stimuli in the monetary incentive delay (MID) task. Cues signaling the task condition (no reward, small reward, large reward) were displayed for 4,000 to 4,500 ms. the response and feedback phase lasted a total of 2 s, during which target was displayed for 250–400 ms and feedback was displayed for 1,450 ms. trials were separated by 3,500–4,150 ms intertrial interval [Color figure can be viewed at http://wileyonlinelibrary.com]
Figure 2
Figure 2
(a) Probabilistic map of positive activation during reward anticipation. The color bar denotes the probability of activation. (b) Regions that showed more activity for male compared with female adolescents during reward anticipation. The color bar denotes t values [Color figure can be viewed at http://wileyonlinelibrary.com]
Figure 3
Figure 3
(a) Regions that showed significant changes in functional connectivity with left and right thalamus during reward anticipation. (b) Regions that showed significant changes in functional connectivity with left and right VS during reward anticipation. The connectivity maps were generated using BrainNet viewer (Xia, Wang, & He, 2013). Nodes drawn in red indicate regions showed positive connectivity with the seed region. Blue indicates negative connectivity. Unified MNI coordinates are used for the display purpose. The MNI coordinates used for plots are shown in the Supporting Information Materials. ANG, angular gyrus; ACG, anterior cingulate gyri; CAL, calcarine; CAU, caudate; CUN, cuneus; IFGoperc, inferior frontal gyrus; opercular part, IFGtriang, inferior frontal gyrus; triangular part; IOG, inferior occipital gyrus; IPL, inferior parietal gyrus; INS, insula; LING, lingual gyrus; DCG, median cingulate gyri; MFG, middle frontal gyrus; PoCG, postcentral gyrus; PreCG, precentral gyrus; PUT, putamen; SFGdor, superior frontal gyrus; ORBsupmed, superior frontal gyrus; medial orbital; STG, superior temporal gyrus; SMA, supplementary motor area; THA, thalamus; L, left; R, right [Color figure can be viewed at http://wileyonlinelibrary.com]
Figure 4
Figure 4
(a) Probabilistic map for positive activation during reward receipt. The color bar denotes the probability of activation. (b) Regions that showed significant changes in functional connectivity with vmPFC during reward receipt. Nodes drawn in red indicate regions showed positive connectivity with the seed region. Blue indicates negative connectivity. Unified MNI coordinates are used for the display purpose. The MNI coordinates used for plots are shown in the Supporting Information Materials. ACG, anterior cingulate gyri; CAL, calcarine; CAU, caudate; CUN, cuneus; DS, dorsal striatum; HIP, hippocampus; IFGoperc, inferior frontal gyrus; opercular part; IFGtriang, inferior frontal gyrus; triangular part; IOG, inferior occipital gyrus; INS, insula; LING, lingual gyrus; DCG, median cingulate gyri; MFG, middle frontal gyrus; MOG, middle occipital gyrus; PreCG, precentral gyrus; PCUN, Precuneus; PUT, putamen; SMA, supplementary motor area; THA, thalamus; L, left; R, right [Color figure can be viewed at http://wileyonlinelibrary.com]
Figure 5
Figure 5
(a) Probabilistic map for negative activation during reward receipt. The color bar denotes the probability of activation. (b) Regions that showed significant changes in functional connectivity with thalamus during reward receipt. Nodes drawn in red indicate regions showed positive connectivity with the seed region. Blue indicates negative connectivity. Unified MNI coordinates are used for the display purpose. The MNI coordinates used for plots are shown in the Supporting Information Materials. ANG, angular gyrus; HIP, hippocampus; IFGtriang, inferior frontal gyrus; triangular part; IOG, inferior occipital gyrus; IPL, inferior parietal gyrus; INS, insula; DCG, median cingulate gyri; MFG, middle frontal gyrus; PoCG, postcentral gyrus; PCUN, precuneus; ROL, rolandic operculum; SFGdor, superior frontal gyrus; SFGmed, superior frontal gyrus; medial; STG, superior temporal gyrus; THA, thalamus; L, left; R, right [Color figure can be viewed at http://wileyonlinelibrary.com]
Figure 6
Figure 6
(a) Probabilistic map for negative activation during infrequent reward omission. The color bar denotes the probability of activation. (b) Regions that showed significant changes in functional connectivity with VS during infrequent reward omission. Nodes drawn in red indicate regions showed positive connectivity with the seed region. Blue indicates negative connectivity. Unified MNI coordinates are used for the display purpose. The MNI coordinates used for plots are shown in the Supporting Information Materials. CAL, calcarine; CAU, caudate; CUN, cuneus; IOG, inferior occipital gyrus; INS, insula; LING, lingual gyrus; DCG, median cingulate gyri; MFG, middle frontal gyrus; MTG, middle temporal gyrus; PoCG, postcentral gyrus; PCG, posterior cingulate gyrus; PreCG, precentral gyrus; PCUN, precuneus; PUT, putamen; SMA, supplementary motor area; SMG, supramarginal gyrus; L, left; R, right [Color figure can be viewed at http://wileyonlinelibrary.com]
Figure 7
Figure 7
(a) Probabilistic map of positive activation in response to reward prediction error (PE). The color bar denotes the probability of activation. (b) Left: Regions that showed different activity associated with reward PE between low sensation seeking group versus high sensation seeking group. The color bar denotes t values. Right: Mean and standard error of right IFG activity for high and low sensation seeking groups. Right IFG activity from the contrast image was extracted from a 3‐mm spherical ROI at MNI coordinates: 36, 38, 10 [Color figure can be viewed at http://wileyonlinelibrary.com]

References

    1. Akkal, D. , Dum, R. P. , & Strick, P. L. (2007). Supplementary motor area and presupplementary motor area: Targets of basal ganglia and cerebellar output. The Journal of Neuroscience, 27, 10659–10673. - PMC - PubMed
    1. Anderson, B. A. (2016). The attention habit: How reward learning shapes attentional selection. Annals of the New York Academy of Sciences, 1369, 24–39. - PubMed
    1. Anderson, B. A. (2017). Reward processing in the value‐driven attention network: Reward signals tracking cue identity and location. Social Cognitive and Affective Neuroscience, 12, 461–467. - PMC - PubMed
    1. Asemi, A. , Ramaseshan, K. , Burgess, A. , Diwadkar, V. A. , & Bressler, S. L. (2015). Dorsal anterior cingulate cortex modulates supplementary motor area in coordinated unimanual motor behavior. Frontiers in Human Neuroscience, 9, 309. - PMC - PubMed
    1. Azim, E. , Mobbs, D. , Jo, B. , Menon, V. , & Reiss, A. L. (2005). Sex differences in brain activation elicited by humor. Proceedings of the National Academy of Sciences of the United States of America, 102, 16496–16501. - PMC - PubMed

Publication types

Grants and funding