

Benchmarks of Significant Change After Aphasia Rehabilitation
- PMID: 30240594
- PMCID: PMC6422764
- DOI: 10.1016/j.apmr.2018.08.177
Benchmarks of Significant Change After Aphasia Rehabilitation
Abstract
Objective: To establish benchmarks of significant change for aphasia rehabilitation outcome measures (ie, Western Aphasia Battery-Aphasia Quotient [WAB-AQ], Communicative Effectiveness Index [CETI], Boston Naming Test [BNT]) and assess if those benchmarks significantly differ across subgroups (ie, time post onset, dose frequency, treatment type).
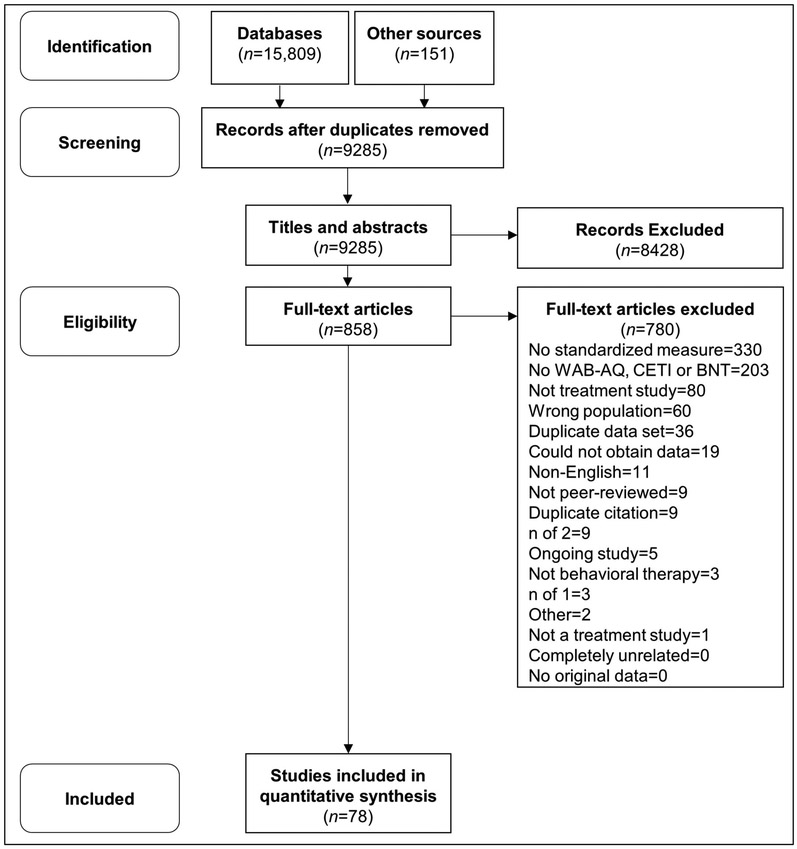
Data sources: A comprehensive literature search of 12 databases, reference lists of previous reviews, and evidence-based practice materials was conducted.
Study selection: Randomized controlled trials, quasi-experimental studies, single-subject design, and case studies that used a standardized outcome measure to assess change were included. Titles and full-text articles were screened using a dual review process. Seventy-eight studies met criteria for inclusion.
Data extraction: Data were extracted independently, and 25% of extractions were checked for reliability. All included studies were assigned quality indicator ratings and an evidence level.
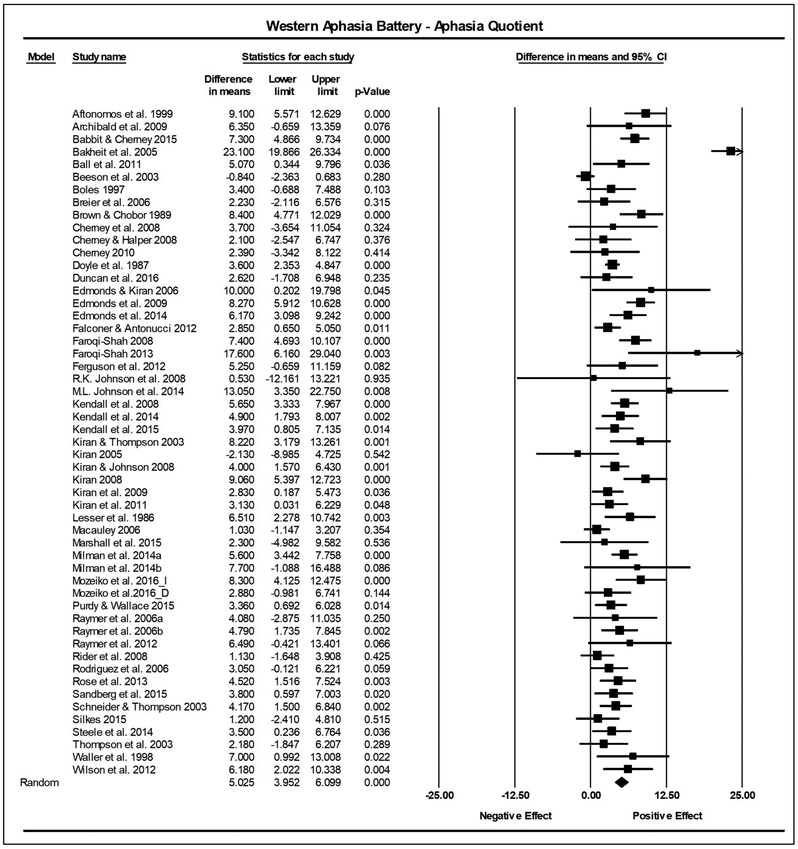
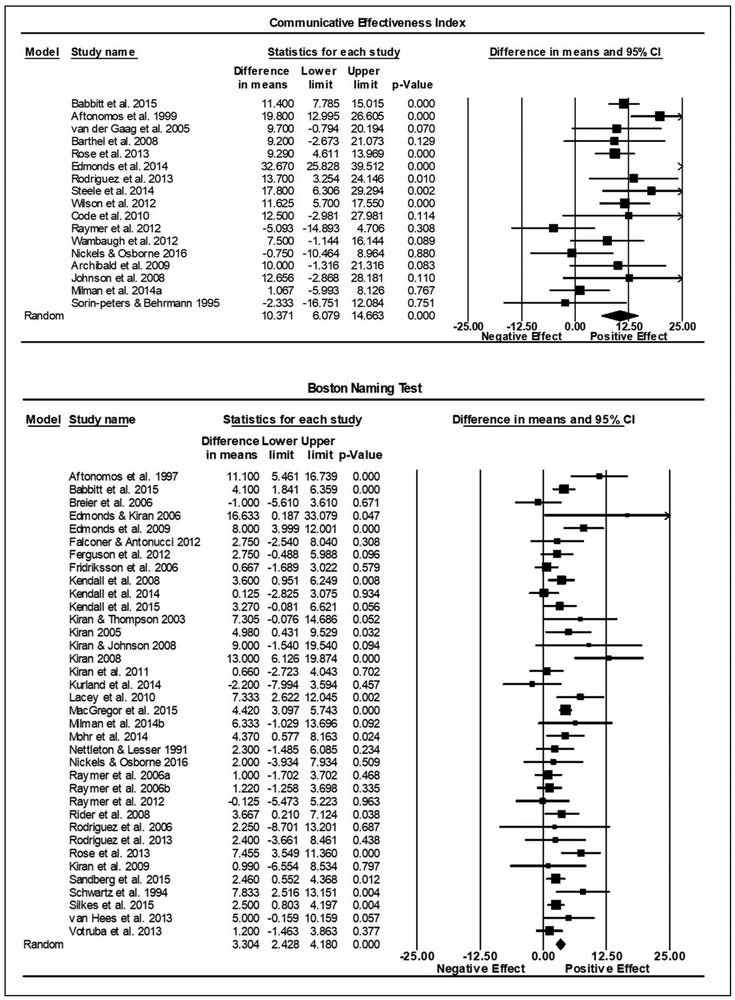
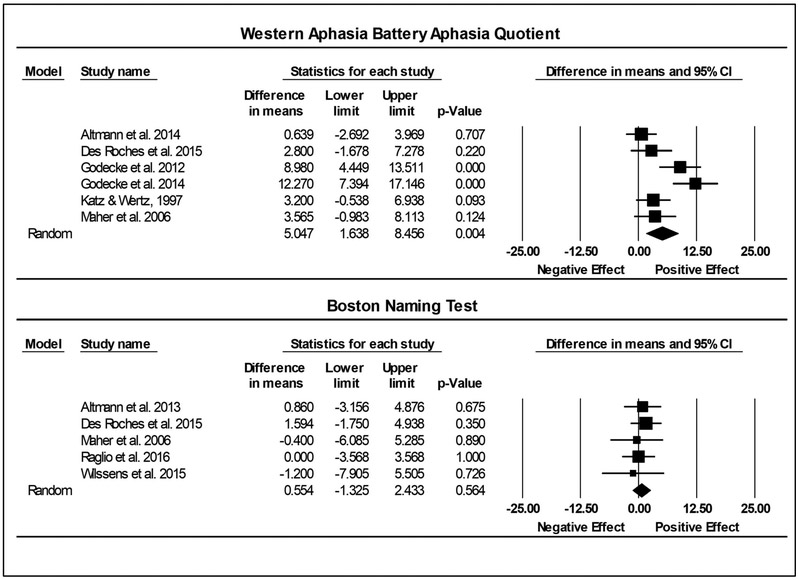
Data synthesis: Random-effects meta-analyses were conducted separately for each study design group (ie, within-/between-group comparisons). For within-group designs, the summary effect size after aphasia rehabilitation was 5.03 points (95% confidence interval, 3.95-6.10, P<.001) on the WAB-AQ, 10.37 points (6.08-14.66, P<.001) on the CETI, and 3.30 points (2.43-4.18, P<.001) on the BNT. For between-group designs, the summary effect size was 5.05 points (1.64-8.46, P=.004) on the WAB-AQ and 0.55 points (-1.33 to 2.43, P=.564) on the BNT, the latter of which was not significant. Subgroup analyses for the within-group designs showed no significant differences in the summary effect size as a function of dose frequency or treatment type.
Conclusions: This study established benchmarks of significant change on 3 standardized outcome measures used in aphasia rehabilitation.
Keywords: Aphasia; Outcome; Rehabilitation; Speech therapy; Stroke.
Copyright © 2018 American Congress of Rehabilitation Medicine. Published by Elsevier Inc. All rights reserved.
Figures
References
-
- Robey RR. A meta-analysis of clinical outcomes in the treatment of aphasia. J Speech Lang Hear Res. 1998;41(1):172–187. - PubMed
-
- Brady MC, Kelly H, Godwin J, Enderby P, Campbell P. Speech and language therapy for aphasia following stroke In: The Cochrane Collaboration, ed. Cochrane Database of Systematic Reviews. Chichester, UK: John Wiley & Sons, Ltd; 2016. http://doi.wiley.com/10.1002/14651858.CD000425.pub4. Accessed July 22, 2016. - DOI - PMC - PubMed
-
- Robey R The Efficacy of Treatment for Aphasia Persons: A Meta-analysis. Brain Lang. 1994;47:582–608. - PubMed
-
- Robey R, Schultz M, Crawford A, Sinner C. Review: Single-subject clinical-outcome research: designs, data, effect sizes, and analyses. Aphasiology. 1999;13(6):445–473.
Publication types
MeSH terms
Grants and funding
LinkOut - more resources
Full Text Sources
Other Literature Sources
Medical
Miscellaneous
