. 2018 Aug 31:6:38-51.
doi: 10.1016/j.isci.2018.07.008. Epub 2018 Jul 18.

Highly Selective Transmission Success of Dengue Virus Type 1 Lineages in a Dynamic Virus Population: An Evolutionary and Fitness Perspective

Affiliations

Highly Selective Transmission Success of Dengue Virus Type 1 Lineages in a Dynamic Virus Population: An Evolutionary and Fitness Perspective

Carmen Koo et al. iScience. .

Abstract

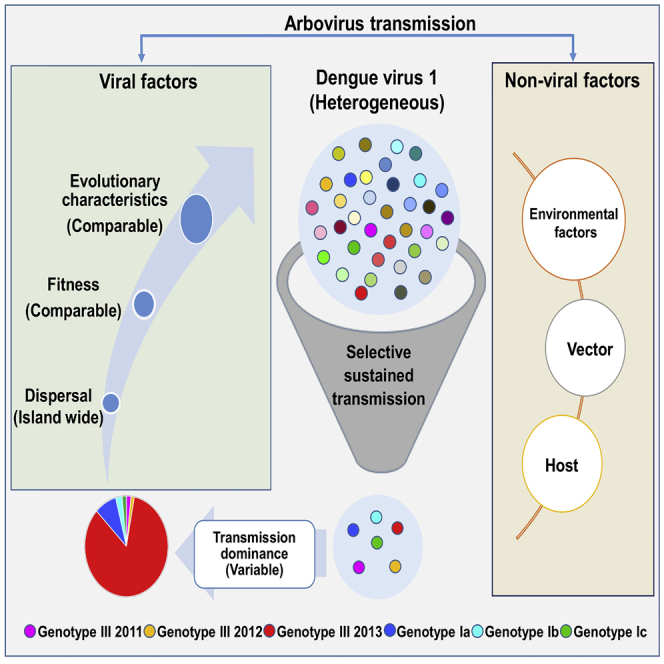
Arbovirus transmission is modulated by host, vector, virus, and environmental factors. Even though viral fitness plays a salient role in host and vector adaptation, the transmission success of individual strains in a heterogeneous population may be stochastic. Our large-scale molecular epidemiological analyses of a dengue virus type 1 population revealed that only a subset of strains (16.7%; n = 6) were able to sustain transmission, despite the population being widely dispersed, dynamic, and heterogeneous. The overall dominance was variable even among the "established" lineages, albeit sharing comparable evolutionary characteristics and replication profiles. These findings indicated that virological parameters alone were unlikely to have a profound effect on the survival of viral lineages, suggesting an important role for non-viral factors in the transmission success of lineages. Our observations, therefore, emphasize the strategic importance of a holistic understanding of vector, human host, and viral factors in the control of vector-borne diseases.

Keywords: Disease; Evolutionary Biology; Phylogenetics; Virology.


Figures

None
Graphical abstract
Figure 1
Figure 1
Phylogenetic and tMRCA Analysis of DENV-1 The time-scaled maximum clade credibility tree was constructed using the Bayesian Markov Chain Monte Carlo (MCMC) method implemented in the BEAST package v1.7.4. The analysis included 93 complete polyprotein sequences selected to cover all possible viral genetic diversity observed during this study (highlighted in red) and 94 sequences retrieved from GenBank database. Each genotype is shown in different colors as per the tree legend. The local strain (imported case from India) that clustered in the outgroup of genotype III lineages is shown with an asterisk. Numbers on branches represent the posterior probability values. The tMRCA values in years are shown in italics, with 95% highest posterior density (HPD) values in brackets. The scale bar shown above the time scale is substitutions/site/year.
Figure 2
Figure 2
Time of Emergence, Extinction and Temporal Fluctuations of Each “Established” Lineage from 2011 to 2016 The figure was generated based on the genotype information gathered from the analysis of 1,963 complete E gene sequences. The longitudinal pattern of total reported cases is shown in a broken line to demonstrate the varying dominance of six “established” lineages during periods of different transmission intensity. D1, DENV-1; GI, genotype I; GIII, genotype III.
Figure 3
Figure 3
Dispersal Pattern of DENV-1 Population in Singapore from 2011 to 2016 The dataset included 792 complete E gene sequences of local DENV-1 isolates, and the sampling locations were classified into 10 clusters; cluster 1, Toa Payoh/Beach Road/Kim Keat Road; cluster 2, Clementi/Leedon Heights; cluster 3, Bukit Batok/Bukit Timah; cluster 4, Ang Mo Kio/Serangoon/Hougang; cluster 5, Geylang; cluster 6, Kaki Bukit/Ubi/Telok Kurau; cluster 7, Tampines; cluster 8, Jurong West/East, cluster 9, Choa Chu Kang/Sungei Kadut; cluster 10, Yishun/Woodlands. The figure shows 35 well-supported epidemiological links (Bayes factor, BF > 3). The branches are colored based on the BF values; red, orange, and green indicate high, intermediate, and low values, respectively. The highest BF values are shown in numbers. See also Figure S1; Tables S1 and S2.
Figure 4
Figure 4
Evolutionary Characteristics of DENV-1 Genotype III Lineages that Established Transmission from 2011 to 2016 The analysis included 144 complete genome sequences of genotype III collected between 2009 and 2016. The isolate in 2009 [SG(EHI)D1/0091Y09] was detected in a sporadic case. It was ancestral to all three “established” genotype III lineages. The 10-amino acid signature is shown next to each lineage/strain, amino acid substitutions in red and reverse mutations in italics. The percentage of nucleotide and amino acid sequence identity is indicated in blue. GIII, genotype III.
Figure 5
Figure 5
Mutation Profiles of Variants of DENV-1 Genotype III 2013 and Genotype Ia Lineages The figure illustrates temporal pattern of emergence, maintenance, and extinction of each variant during the study period. The classification of DENV-1 genotype III variants (variant 13.01–13.13) has been described in details elsewhere (Hapuarachchi et al., 2016a). Arrows indicate the transmission period of each variant. A timeline is given below the figure with numbers 1–4 to represent each quarter of the year (1: Jan–Mar; 2: Apr–Jun; 3: Jul–Sep; 4: Oct–Dec). Substitutions shown are the E-gene-based signature mutations of each variant. Initial substitutions were considered as founder substitutions and have been shown with an asterisk. Those that appeared later in respective variants were named as “secondary” substitutions (without an asterisk) in the text. Those shown in red are “fixed” non-synonymous substitutions. Remaining residues are “fixed” synonymous substitutions. Positions of all amino acid substitutions are shown at the E gene level, whereas the synonymous substitutions are numbered from the beginning of the polyprotein. D1GIII, genotype III 2013 lineage; D1GIa, genotype Ia lineage; n, number of sequences belonging to each variant, WT, wild-type.
Figure 6
Figure 6
Replication Kinetics and Viral RNA Copy Fluctuations (gRNA and sfRNA) of DENV-1 Lineages and Strains in Huh-7 Mammalian Cells In vitro experiments were conducted at an MOI of 0.1. The y axis represents virus titers (pfu/mL), whereas the x axis refers to hours post infection (hpi). The bar chart shows the sfRNA:gRNA ratio for each isolate at 24 hpi. SG(EHI)D1/0091Y09, SG(EHI)D1/15834Y11, SG(EHI)D1/18640Y12, and SG(EHI)D1/44259Y12 isolates possess the 21-nucleotide deletion in the hypervariable region of the 3′ UTR (please see also Figure S2). The deletion is absent in SG(EHI)D1/09106Y11; SG(EHI)D1/04009Y13; SG(EHI)D1/30889Y14; SG(EHI)D1/09063Y15; 05K4441DK1/2005; and 05K4443DK1/2005 isolates. D1, DENV-1; GI, genotype I; GIII, genotype III; w/o, without; del, deletion. ***p ≤ 0. 001.
Figure 7
Figure 7
Replication Kinetics and Viral RNA Copy Fluctuations (gRNA and sfRNA) of DENV-1 Lineages and Strains in C6/36 Aedes albopictus Cells In vitro experiments were conducted at an MOI of 0.1. The y-axis represents virus titers (pfu/mL) whereas the x axis refers to hours post infection (hpi). The bar chart shows the sfRNA:gRNA ratio for each isolate at 24 hpi. SG(EHI)D1/0091Y09, SG(EHI)D1/15834Y11, SG(EHI)D1/18640Y12, and SG(EHI)D1/44259Y12 isolates possess the 21-nucleotide deletion in the hypervariable region of the 3′ UTR (please see also Figure S2). The deletion is absent in SG(EHI)D1/09106Y11; SG(EHI)D1/04009Y13; SG(EHI)D1/30889Y14; SG(EHI)D1/09063Y15; 05K4441DK1/2005; and 05K4443DK1/2005 isolates. D1, DENV-1; GI, genotype I; GIII, genotype III; w/o, without; del, deletion.
Figure 8
Figure 8
3′ UTR Structure of DENV-1 Strains The secondary structure of DENV-1 3′ UTR were predicted using the mfold web server under standard conditions (37°C). The analysis was performed by using complete 3′ UTR sequences. SG(EHI)D1/0091Y09; SG(EHI)D1/15834Y11; SG(EHI)D1/18640Y12; and SG(EHI)D1/44259Y12 isolates possess the 21-nucleotide deletion in the hypervariable region of the 3′ UTR (please see also Figure S2). The deletion is absent in SG(EHI)D1/09106Y11; SG(EHI)D1/04009Y13; SG(EHI)D1/30889Y14; SG(EHI)D1/09063Y15; 05K4441DK1/2005; and 05K4443DK1/2005 isolates. The circles represent SLII structure of 2005 genotype I epidemic strains and genotype Ia. D1, DENV-1; GI, genotype I; GIII, genotype III; SL, stem loop; DB, dumbbell. See also Figure S3.

Similar articles

Cited by

References

    1. Adams B., Holmes E.C., Zhang C., Mammen M.P., Jr., Nimmannitya S., Kalayanarooj S., Boots M. Cross-protective immunity can account for the alternating epidemic pattern of dengue virus serotypes circulating in Bangkok. Proc. Natl. Acad. Sci. USA. 2006;103:14234–14239. - PMC - PubMed
    1. Chen R., Vasilakis N. Dengue–quo tu et quo vadis? Viruses. 2011;3:1562–1608. - PMC - PubMed
    1. Christofferson R.C., Mores C.N. Potential for extrinsic incubation temperature to alter interplay between transmission potential and mortality of dengue-infected Aedes aegypti. Environ. Health Insights. 2016;10:119–123. - PMC - PubMed
    1. Coffey L.L., Vasilakis N., Brault A.C., Powers A.M., Tripet F., Weaver S.C. Arbovirus evolution in vivo is constrained by host alternation. Proc. Natl. Acad. Sci. USA. 2008;105:6970–6975. - PMC - PubMed
    1. Condreay L.D., Brown D.T. Exclusion of superinfecting homologous virus by Sindbis virus-infected Aedes albopictus (mosquito) cells. J. Virol. 1986;58:81–86. - PMC - PubMed

LinkOut - more resources