. 2018 Aug 31:6:68-82.
doi: 10.1016/j.isci.2018.07.013. Epub 2018 Jul 20.

Histone H2A.Z Suppression of Interferon-Stimulated Transcription and Antiviral Immunity Is Modulated by GCN5 and BRD2

Affiliations

Histone H2A.Z Suppression of Interferon-Stimulated Transcription and Antiviral Immunity Is Modulated by GCN5 and BRD2

Nancy Au-Yeung et al. iScience. .

Abstract

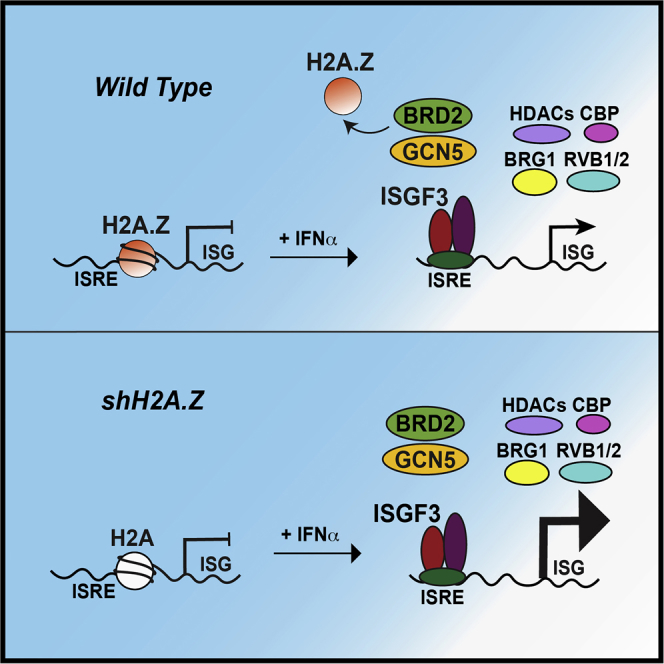
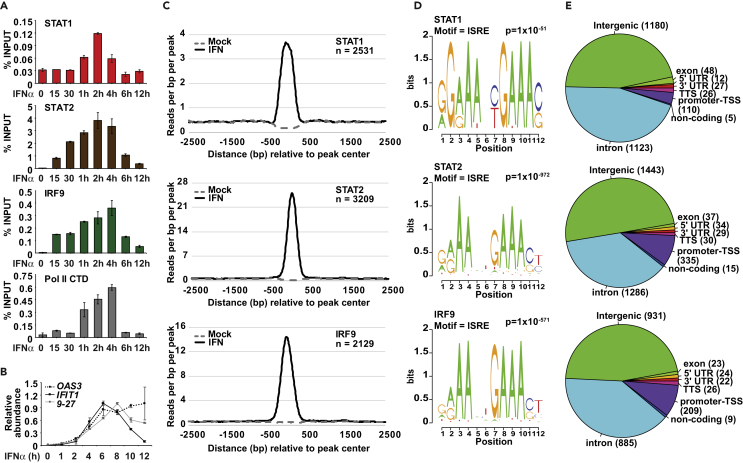
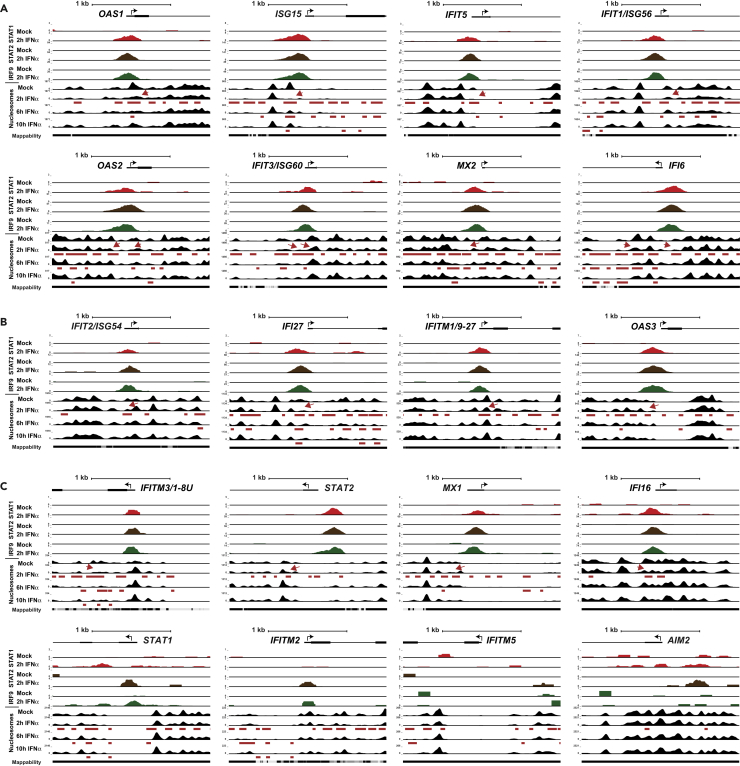
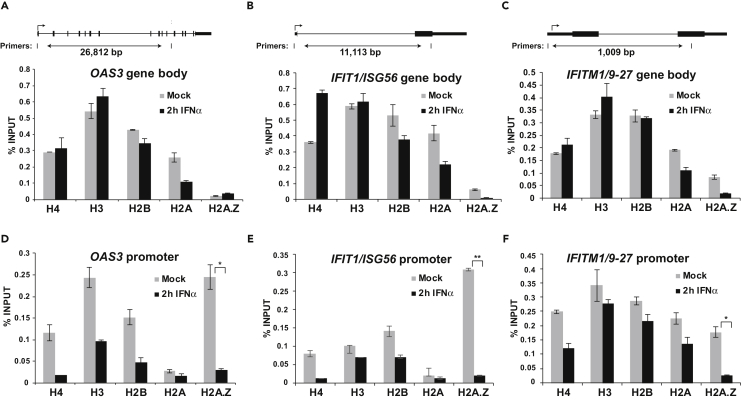
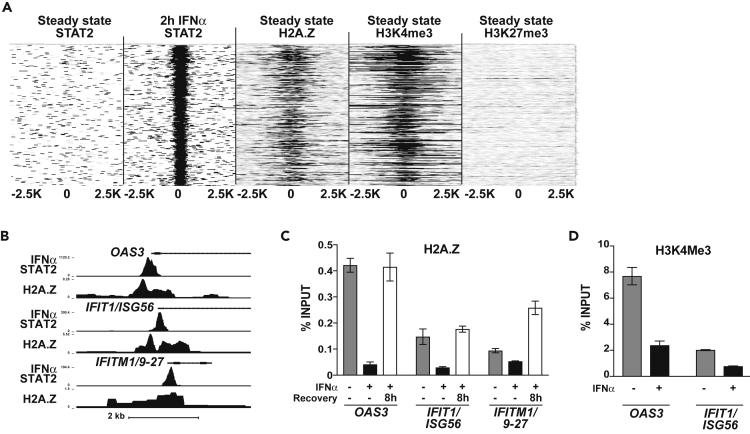
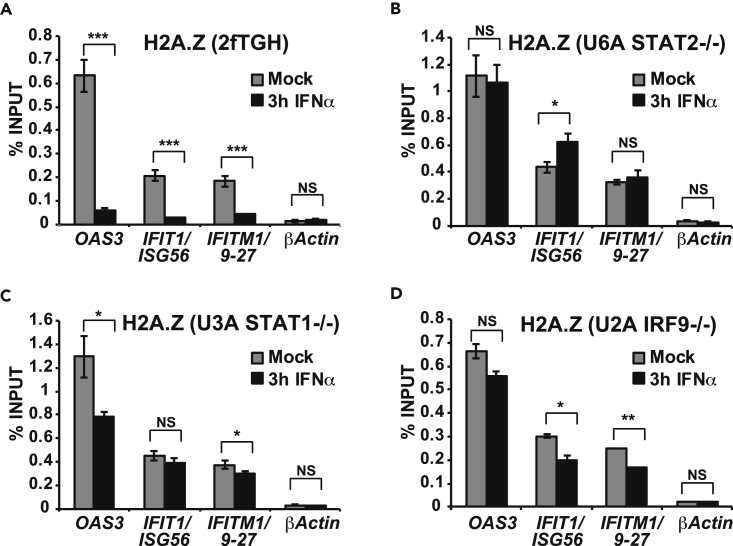
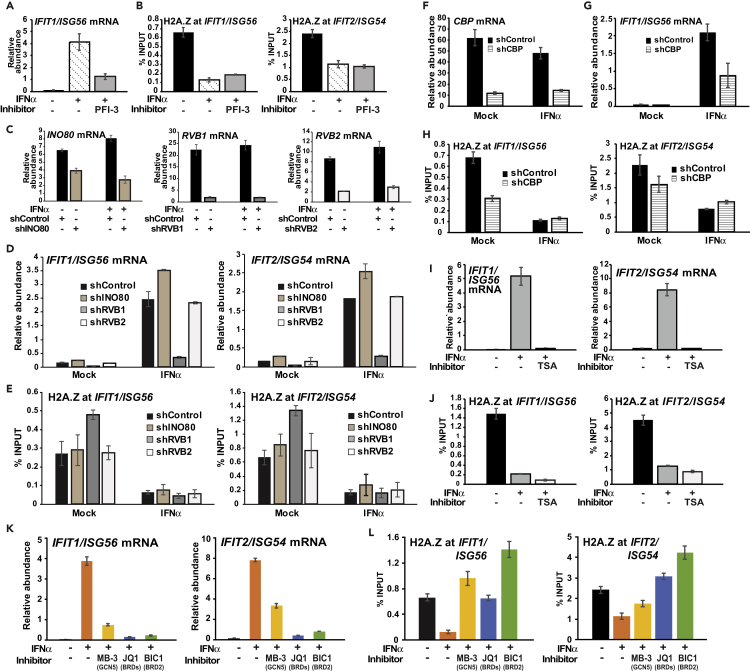
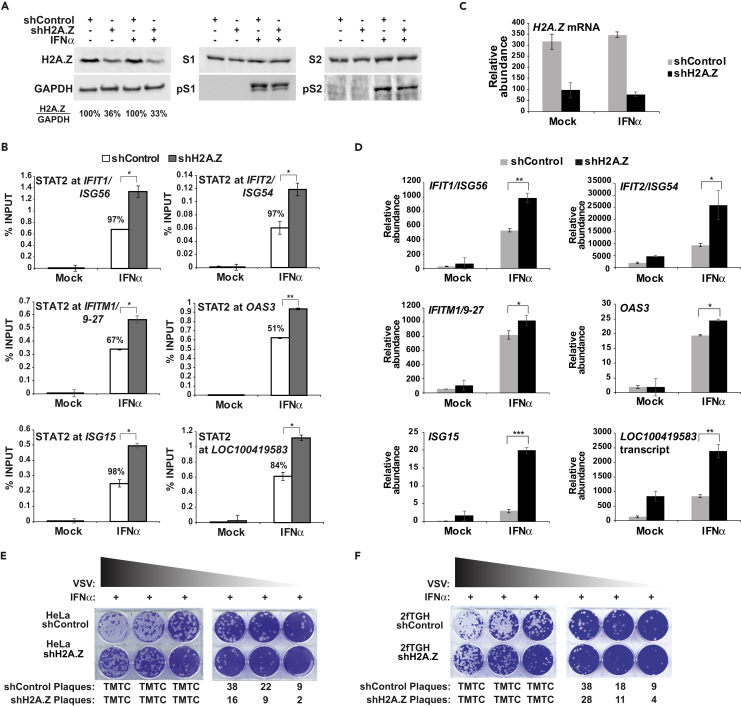
Type I interferon (IFN)-stimulated gene (ISG) expression requires interaction between a transcription factor complex, ISGF3, and target gene promoters to initiate transcription and protection against infection. To uncover chromatin regulatory features of this antiviral immune response, IFN-induced nucleosome and histone dynamics of human ISG loci were examined. ISGF3 recruitment after IFN stimulation was accompanied by nucleosome reorganization at promoters and gene bodies. IFN stimulation induced loss of core histones H2B, H3, and H4, as well as H2A.Z at ISG promoters. A strong correlation was found between H2A.Z occupancy and ISGF3 target sites, and IFN-stimulated H2A.Z removal requires STAT1, STAT2, and IRF9. Neither INO80 nor SWI/SNF participate in IFN-driven H2A.Z eviction, but GCN5 and BRD2 are required. Interference with H2A.Z expression enhanced ISGF3 recruitment to ISG promoters, ISG mRNA expression, and IFN-stimulated antiviral immunity. This indicates that H2A.Z nucleosomes at ISG promoters restrict optimal ISGF3 engagement and modulate the biological response to IFN.

Keywords: Immune Response; Immunology; Transcriptomics.


Figures

None
Graphical abstract
Figure 1
Figure 1
IFN-Stimulated ISGF3 Recruitment and Transcriptional Activity (A) ChIP analysis of IFNα-induced STAT1, STAT2, IRF9, and Pol II C-terminal domain (CTD) recruitment at the OAS3 promoter locus in HeLa cells after mock treatment (0 min) or IFNα stimulation for 15 min, 30 min, 1 hr, 2 hr, 4 hr, 6 hr, and 12 hr. Error bars denote mean ± SD of three technical replicates. (B) Gene expression analysis of OAS3, IFIT1/ISG56, and IFITM1/9–27 after mock treatment (0 hr) or 1-, 2-, 4-, 6-, 8-, 10-, or 12-hr IFNα treatment. Relative abundance is normalized to GAPDH. Error bars denote mean ± SD of three technical replicates. (C) Normalized sequencing tag density of mock-treated (dashed) and IFNα-stimulated (solid) STAT1 (top), STAT2 (middle), and IRF9 (bottom) binding at 2,531, 3,209 and 2,129 genomic loci representing sites with a ≥ 2-fold increase in occupancy after IFNα treatment. Tag density is computed 2,500 bp upstream and downstream of the peak center and is grouped into 10 bp bins. (D) DNA sequence logo of the most frequent de novo motif identified from 2,531 STAT1 peaks (top), 3,209 STAT2 peaks (middle), and 2,129 IRF9 peaks (bottom) as described in Table S1. For each position, the sequence logo bit height corresponds to its relative frequency within the sequence. The associated motif name and p value are identified above the logo. (E) Distribution of specific annotated DNA (intergenic, intron, promoter-TSS, exon, 5′ UTR, 3′ UTR, non-coding) and the corresponding number of peaks from 2,531 STAT1 peaks (top), 3,209 STAT2 peaks (middle), and 2,129 IRF9 peaks (bottom). See also Table S1.
Figure 2
Figure 2
IFN-Stimulated Nucleosome Reorganization Genome browser diagram of IFN-induced ISGF3 recruitment and nucleosome dynamics at select ISGs with (A) high to (B) moderate to (C) low or no nucleosome loss shown within 2000 bp +/− TSS. (A–C) (Top) 5′ End of gene depicted with the black arrow depicting the direction of transcription; the small and large black bars representing untranslated and exonic regions, respectively; and the line representing intronic regions. (Middle) ChIP-seq density of STAT1, STAT2, and IRF9 occupancy after mock or 2-hr IFNα treatment in HeLa cells. (Bottom) Nucleosome occupancy after mock, 2-hr, 6-hr or 10-hr IFNα treatment in HeLa cells. Red arrows highlight nucleosome loss at ISGF3-ISRE proximal regions. Red bars beneath nucleosome maps denote nucleosome loss due to 2, 6, or 10-hr IFNα treatment compared with mock (Poisson p value ≤ 1 × 105). All sequencing reads are normalized to 10 million reads. See also Table S2.
Figure 3
Figure 3
IFN-Stimulated Loss of Histones H2A.Z, H2B, H3, and H4 at ISG Promoters (A–F) ChIP analysis of histones H4, H3, H2B, H2A, and H2A.Z occupancy at the gene body (A–C) or gene promoter (D–F) of OAS3, IFIT1/ISG56, IFITM1/9–27 during steady state and after 2-hr IFNα stimulation. The position of the gene body and promoter-specific primers and their relative distance are indicated in the upper panel of A–C. Error bars denote mean ± SD of three technical replicates from one representative experiment. Statistical analysis was computed using the Student's t test with n ≥ 2 (*p < 0.05, **p < 0.005).
Figure 4
Figure 4
Histone Variant, H2A.Z, Is a Dynamic Component of ISG Promoters (A) Heatmap depicting steady-state and IFNα-recruited STAT2 occupancy (in-house ChIP-seq) compared with steady-state H2A.Z, H3K4me3, and H3K27me3 occupancy (ENCODE ChIP-seq) at the top 250 enriched STAT2 target loci spanning ±2,500 bp from the STAT2 peak center. H2A.Z and STAT2 occupancy at these loci had a Pearson correlation coefficient of R2 = 0.83. (B) Genome browser view of H2A.Z occupancy at steady state and STAT2 occupancy after 2-hr IFNα stimulation at three ISGs, OAS3, IFIT1/ISG56, and IFITM1/9–27. (C) ChIP analysis of H2A.Z removal and recovery after 3-hr IFNα treatment followed by recovery without IFNα for 0 hr or 8 hr at the OAS3, IFIT1/ISG56, and IFITM1/9–27 promoters. Error bars denote mean ± SD of a representative experiment with three technical replicates. (D) ChIP analysis of steady-state and IFN-stimulated H3K4me3 at OAS3 and IFIT1/ISG56 promoters. Error bars denote mean ± SD of a representative experiment with three technical replicates. See also Table S1.
Figure 5
Figure 5
H2A.Z Removal Requires ISGF3 (A) ChIP analysis of H2A.Z in 2fTGH cells with intact ISGF3 at the promoter region of OAS3, IFIT1/ISG56, and IFITM1/9–27 with mock or 3-hr IFNα treatment. Error bars denote mean ± SD of one representative experiment with three technical replicates. Statistical analysis was computed using the Student's t test with n ≥ 2 (*p < 0.05, **p < 0.005, ***p < 0.0005, NS, not significant). (B) Same as A but with STAT2-deficient U6A cells. (C) Same as A but with STAT1-deficient U3A cells. (D) Same as A but with IRF9-deficient U2A cells.
Figure 6
Figure 6
GCN5 and BRD2 Are Essential to IFN-Induced H2A.Z Loss (A and B) HeLa cells were mock-treated or IFNα-treated with or without PFI-3 for 3 hr, and then analyzed for (A) IFIT1/ISG56 mRNA expression by RT-qPCR and (B) ChIP assays of H2A.Z occupancy at IFIT1/ISG56 and IFIT2/ISG54 promoters. Error bars denote mean ± SD of one representative experiment with technical triplicates. (C–E) HeLa cells were transduced with shRNA vectors targeting INO80, RVB1, RVB2, or control. (C) Expression of shRNA targets in mock and 3-hr IFNα-treated cells was measured by RT-qPCR. (D) IFIT1/ISG54 and IFIT2/ISG56 mRNA expression in mock and 3-hr IFNα-treated cells harboring the indicated shRNA was measured by RT-qPCR. (E) ChIP assay of H2A.Z occupancy at IFIT1/ISG56 and IFIT2/ISG54 promoters in mock and 2-hr IFNα-treated cells containing the indicated shRNA target. Error bars denote mean ± SD of three biological replicates and three technical replicates. For siRNA knockdown of SRCAP, see Figure S1. (F–H) HeLa cells were transduced with CBP shRNA or control shRNA. (F) Expression of shRNA target in mock and 3-hr IFNα-treated cells was measured by RT-qPCR. (G) IFIT1/ISG56 mRNA expression in mock and 3-hr IFNα-treated cells harboring the indicated shRNA was measured by RT-qPCR. (H) ChIP assay of H2A.Z occupancy at IFIT1/ISG56 and IFIT2/ISG54 promoters in mock and 2-hr IFNα-treated cells containing the indicated shRNA target. Error bars denote mean ± SD of a representative experiment with technical triplicates. (I and J) HeLa cells were mock-treated or IFNα-treated with or without trichostatin A (TSA) for 3 hr and then analyzed for (I) IFIT1/ISG56 and IFIT2/ISG54 mRNA expression and (J) H2A.Z occupancy at IFIT1/ISG56 and IFIT2/ISG54 promoters. Error bars denote mean ± SD of one representative experiment with technical triplicates. (K and L) HeLa cells were pretreated with MB-3 or BET inhibitors JQ1 and BIC1 for 1 hr, mock-treated or stimulated with IFNα for 3 hr (+/− inhibitor), then analyzed for (K) IFIT1/ISG56 and IFIT2/ISG54 mRNA expression and (L) H2A.Z occupancy at IFIT1/ISG56 and IFIT2/ISG54. Error bars denote mean ± SD of one representative experiment with technical triplicates. See also Figures S1–S3.
Figure 7
Figure 7
H2A.Z Suppresses ISGF3 Occupancy, ISG Expression, and IFN-Mediated Antiviral Protection HeLa cells were transduced with an shRNA vector targeting H2A.Z or a non-targeting control. (A) Immunoblot of H2A.Z, STAT1, phosphotyrosine 701 STAT1, STAT2, phosphotyrosine 690 STAT2, and GAPDH protein expression in control or H2A.Z knockdown HeLa cells with or without 1-hr IFNα treatment. H2A.Z expression level normalized to GAPDH indicated as % of control. (B) ChIP analysis of STAT2 occupancy in H2A.Z knockdown or control HeLa cells with or without 1-hr IFNα stimulation at promoters of IFIT1/ISG56, IFIT2/ISG54, IFITM1/9–27, OAS3, ISG15, and LOC100419583. % Indicates the increased percentage of STAT2 occupation in shH2A.Z cells compared with non-targeting control cells. Error bars denote mean ± SD of a representative experiment with technical triplicates. Statistical analysis was computed using Student's t test with n ≥ 2 (*p < 0.05, **p < 0.005.). (C) H2A.Z mRNA levels were quantified by RT-qPCR in unstimulated and 10-hr IFNα-stimulated H2A.Z knockdown or control cells. Error bars denote mean ± SD of a representative experiment with technical triplicates. (D) Levels of ISG mRNAs, IFIT1/ISG56, IFIT2/ISG54, IFITM1/9–27, OAS3, ISG15, and LOC100419583 were measured as in (C). Statistical analysis was computed using Student's t test with n ≥ 3 (*p < 0.05, **p < 0.005, ***p< 0.0005). (E) Plaque assay in HeLa cells harboring control shRNA or H2A.Z shRNA. Cells were treated for 9 hr with IFNα, followed by 1.5 hr inoculation with a titration of vesicular stomatitis virus (VSV), and then overlaid with DMEM-agar at 37°C for 72 hr before staining with crystal violet. TMTC, too many to count. (F) Same as E, but in control or H2A.Z-deficient 2fTGH cells. See also Figure S4.

References

    1. Aaronson D.S., Horvath C.M. A road map for those who don't know JAK-STAT. Science. 2002;296:1653–1655. - PubMed
    1. Anamika K., Krebs A.R., Thompson J., Poch O., Devys D., Tora L. Lessons from genome-wide studies: an integrated definition of the coactivator function of histone acetyl transferases. Epigenetics Chromatin. 2010;3:18. - PMC - PubMed
    1. Au-Yeung N., Mandhana R., Horvath C.M. Transcriptional regulation by STAT1 and STAT2 in the interferon JAK-STAT pathway. JAKSTAT. 2013;2:e23931. - PMC - PubMed
    1. Banninger G., Reich N.C. STAT2 nuclear trafficking. J. Biol. Chem. 2004;279:39199–39206. - PubMed
    1. Barski A., Cuddapah S., Cui K., Roh T.Y., Schones D.E., Wang Z., Wei G., Chepelev I., Zhao K. High-resolution profiling of histone methylations in the human genome. Cell. 2007;129:823–837. - PubMed