. 2019 Apr;143(4):1426-1443.e6.
doi: 10.1016/j.jaci.2018.08.042. Epub 2018 Sep 19.

Injury, dysbiosis, and filaggrin deficiency drive skin inflammation through keratinocyte IL-1α release

Affiliations

Injury, dysbiosis, and filaggrin deficiency drive skin inflammation through keratinocyte IL-1α release

Nathan K Archer et al. J Allergy Clin Immunol. 2019 Apr.

Abstract

Background: Atopic dermatitis (AD) is associated with epidermal barrier defects, dysbiosis, and skin injury caused by scratching. In particular, the barrier-defective epidermis in patients with AD with loss-of-function filaggrin mutations has increased IL-1α and IL-1β levels, but the mechanisms by which IL-1α, IL-1β, or both are induced and whether they contribute to the aberrant skin inflammation in patients with AD is unknown.

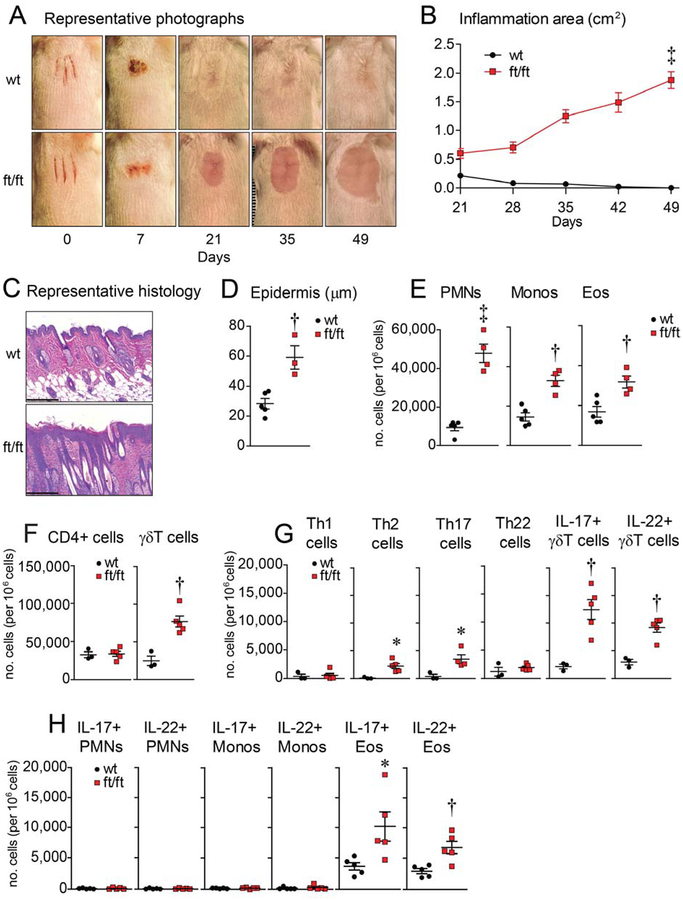
Objective: We sought to determine the mechanisms through which skin injury, dysbiosis, and increased epidermal IL-1α and IL-1β levels contribute to development of skin inflammation in a mouse model of injury-induced skin inflammation in filaggrin-deficient mice without the matted mutation (ft/ft mice).

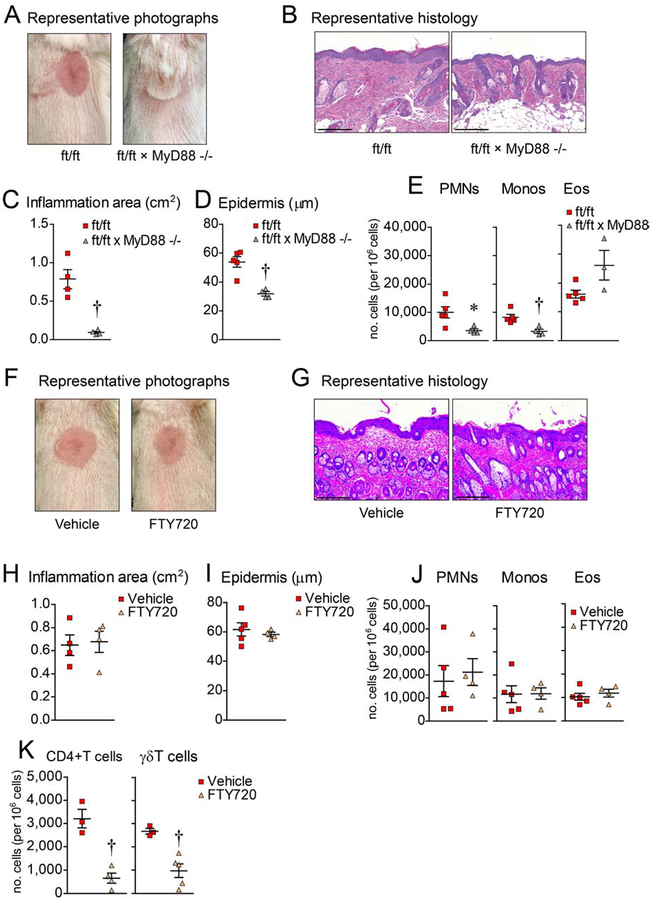
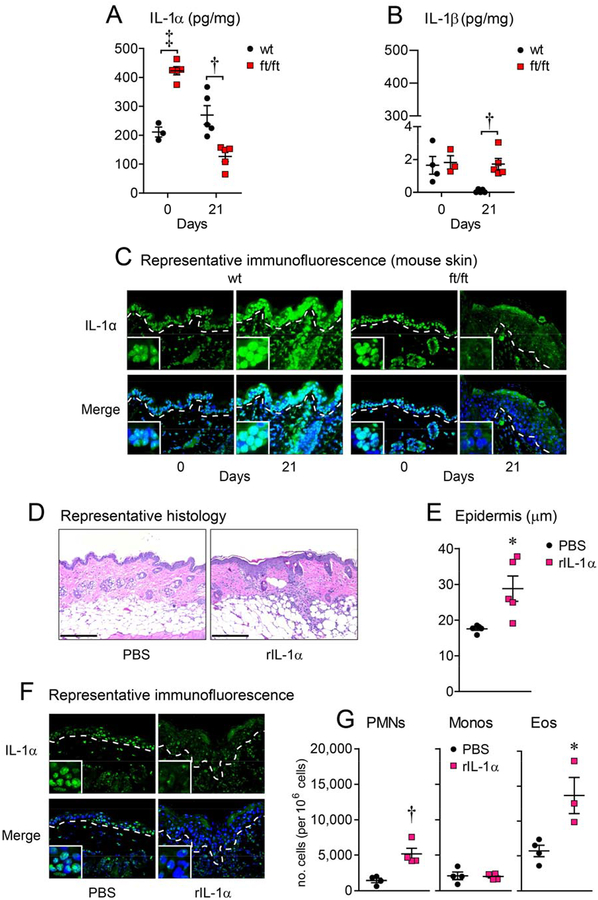
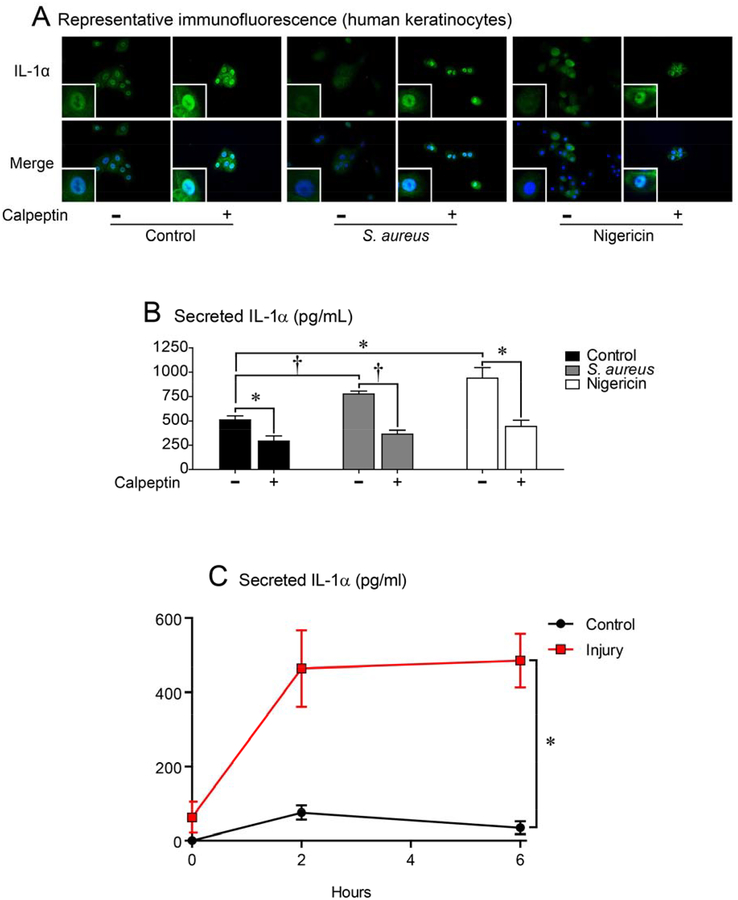
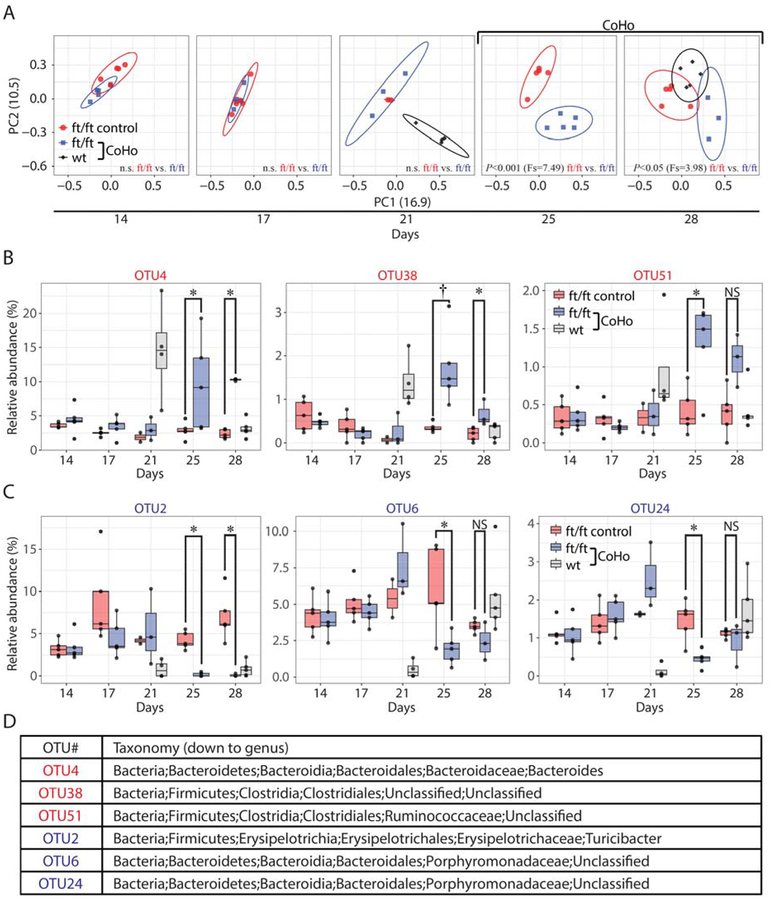
Methods: Skin injury of wild-type, ft/ft, and myeloid differentiation primary response gene-88-deficient ft/ft mice was performed, and ensuing skin inflammation was evaluated by using digital photography, histologic analysis, and flow cytometry. IL-1α and IL-1β protein expression was measured by means of ELISA and visualized by using immunofluorescence and immunoelectron microscopy. Composition of the skin microbiome was determined by using 16S rDNA sequencing.

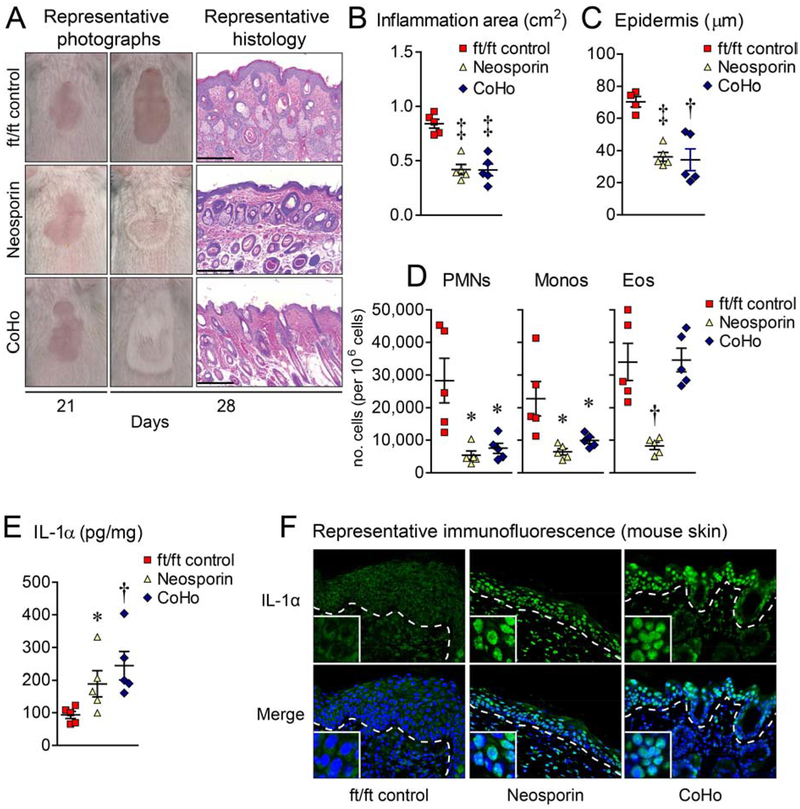
Results: Skin injury of ft/ft mice induced chronic skin inflammation involving dysbiosis-driven intracellular IL-1α release from keratinocytes. IL-1α was necessary and sufficient for skin inflammation in vivo and secreted from keratinocytes by various stimuli in vitro. Topical antibiotics or cohousing of ft/ft mice with unaffected wild-type mice to alter or intermix skin microbiota, respectively, resolved the skin inflammation and restored keratinocyte intracellular IL-1α localization.

Conclusions: Taken together, skin injury, dysbiosis, and filaggrin deficiency triggered keratinocyte intracellular IL-1α release that was sufficient to drive chronic skin inflammation, which has implications for AD pathogenesis and potential therapeutic targets.

Keywords: IL-1α; Skin; atopic dermatitis; filaggrin; inflammation; keratinocytes.


Conflict of interest statement

Conflict of interest: L.S.M. has received grant support from MedImmune, Pfizer, Regeneron Pharmaceuticals, Moderna Therapeutics, and Boehringer Ingelheim, and is on the scientific advisory board for Integrated Biotherapeutics, and is a shareholder of Noveome Biotherapeutics, which are all unrelated to the work reported in this manuscript.

Figures

Figure 1.
Figure 1.. Filaggrin-deficient mice develop chronic skin inflammation following injury.
Skin injury was performed on ft/ft and wt mice. (A) Representative digital photographs. (B) Mean area of skin inflammation cm2 ± s.e.m. (C) Representative histology (H&E) at day 21 (scale bars = 200 μm). (D) Mean epidermal thickness (m) ± s.e.m. (E) Mean numbers of PMNs, monocytes and eosinophils per million cells ± s.e.m. from day 21 skin. (F) Mean number of stimulated CD4+ and γδ T cells per million cells ± s.e.m. from day 21 skin. (G) Mean number of various stimulated T cell subsets per million cells ± s.e.m. from day 21 skin. (H) Mean number of stimulated PMNs, monocyte, and eosinophils per million cells ± s.e.m. from day 21 skin. *P<0.05, †P<0.01, ‡P<0.001, wt versus ft/ft mice, as calculated by two-way ANOVA (B) or two-tailed Student’s t-test (D-H). Results are representative of at least 2 independent experiments (n = 3–5 mice/group per experiment).
Figure 2.
Figure 2.. Skin inflammation is dependent on MyD88 signaling.
Skin injury was performed on ft/ft and ft/ft × MyD88−/− mice. (A) Representative digital photographs on day 21. (B) Representative histology (H&E) from day 21 (scale bars = 200 μm). (C) Mean area of skin inflammation cm2 ± s.e.m. (D) Mean epidermal thickness (μm) ± s.e.m. (E) Mean number ± s.e.m. of PMNs, monocytes and eosinophils per million cells from day 21 skin. (F) Representative digital photographs on day 21 of ft/ft mice treated with Vehicle (sterile water) or FTY720. (G) Representative histology (H&E) from day 21 (scale bars = 200 μm). (H) Mean area of skin inflammation cm2 ± s.e.m. (I) Mean epidermal thickness (μm) ± s.e.m. (J) Mean number ± s.e.m. of PMNs, monocytes and eosinophils per million cells from day 21 skin. (K) Mean number of unstimulated CD4+ and γδ T cells per million cells ± s.e.m. from day 21 skin of ft/ft mice treated with PBS or FTY720. *P<0.05, †P<0.01, ‡P<0.001, ft/ft vs. ft/ft × MyD88−/− mice or Vehicle vs. FTY720, as calculated by two-tailed Student’s t-test. Results are representative of 2 independent experiments (n = 3–5 mice/group per experiment).
Figure 3.
Figure 3.. IL-1α is sufficient for skin inflammation.
(A-C) Skin injury was performed on ft/ft and wt mice and skin samples were collected on days 0 (prior to injury) and 21. (A, B) Mean IL-1α and IL-1β protein levels (pg/mg) ± s.e.m. (C) Representative immunofluorescence of sections (400×) labeled with anti-IL-1α (green, upper panels) and DAPI (blue, lower panels) with merged labeling (cyan, lower panels). Dashed line = dermoepidermal junction and insets = 4× higher digital magnification of the nuclei. (D-G) wt mice were injected intradermally with PBS or rIL-1α. (D) Representative histology (H&E) at day 21 (scale bar = 200 μm). (E) Mean epidermal thickness (μm) ± s.e.m. (F) Representative immunofluorescence as described in (C), above. (G) Mean numbers of PMNs, monocytes and eosinophils per million cells ± s.e.m. from day 21 skin. *P<0.05, †P<0.01, ‡P<0.001, ft/ft vs. wt mice or PBS vs. rIL-1α, as calculated by two-tailed Student’s t-test. Results are representative of 2 independent experiments (n = 3–5 mice/group per experiment).
Figure 4.
Figure 4.. IL-1α signaling is required for skin inflammation in ft/ft mice.
On day 21, ft/ft mice with skin inflammation were treated with PBS (ft/ft control) or IL-1Ra twice daily for 7 days (A-D) or with isotype control mAb (ft/ft control), anti-IL-1β mAb, or anti-IL-1α mAb (E-H) and skin samples collected on day 28. (A, E) Representative histology (H&E) (scale bar = 200 μm). (B, F) Mean epidermal thickness (μm) ± s.e.m. (C, G) Representative immunofluorescence of sections (400×) labeled with anti-IL-1α (green, upper panels) and DAPI (blue, lower panels) with merged labeling (cyan, lower panels). Dashed line = dermoepidermal junction and insets = 4× higher digital magnification of the nuclei. (D, H) Mean number ± s.e.m. of PMNs, monocytes and eosinophils per million cells from day 28 skin. *P<0.05, ‡P<0.001, vs. ft/ft control, as calculated by two-tailed Student’s t-test. Results are representative of 2 independent experiments (n = 4–5 mice/group per experiment).
Figure 5.
Figure 5.. Human keratinocytes release nuclear IL-1α upon stimulation.
(A,B) Primary human keratinocytes were cultured alone (─) or with live S. aureus (1:100 multiplicity of infection [MOI]) or nigericin ± calpeptin (+) for 2 hours. (A) Representative immunofluorescence of sections (400×) labeled with anti-IL-1α (green, upper panels) and DAPI (blue, lower panels) with merged labeling (cyan, lower panels). Insets = 3× higher digital magnification of the nuclei. (B) Mean IL-1α protein levels in culture supernatants (pg/mL) ± s.e.m. *P<0.05, ‡P<0.001, between indicated groups, as calculated by two-tailed Student’s t-test. Cell cultures were performed in triplicate and results are representative of 3 independent experiments. (C) Keratinocytes were injured by scalpel cut and IL-1α protein levels measured in culture supernatants at the indicated times (pg/mL) ± s.e.m. *P<0.05 as calculated by two-way ANOVA. Cell cultures were performed in triplicate.
Figure 6.
Figure 6.
Immuno-electron microscopy of IL-1α localization in keratinocytes. (A) Representative transmission electron microscopy (TEM) images of vehicle and nigericin treated cells (4,200× magnification). (B,C) Vehicle and nigericin treated primary human keratinocytes were labeled with anti-human IL-1α primary antibody followed by 12 nm gold-conjugated secondary antibody and imaged by TEM (black dots). Representative images of the (B) nucleus/cytoplasm interface and (C) cytoplasm (top panels = 1.6× digital zoom from 24,500× magnification and bottom panels = 2.5× digital zoom of black boxed area in the top panels). Black arrows point to antibody-labeled IL-1α. Nuc = nucleus, Cyto = cytoplasm, AV = autophagosomal vacuole. Dashed line represents nuclear envelope. Black scale bars = 250 nm. (D) Representative confocal microscopy images of ft/ft skin sections (400×) with 2× digital zoom labeled with anti-IL-1α (green) and DAPI (blue) with merged labeling (cyan). Dashed line = dermoepidermal junction. White scale bars = 10 μm. (E) Quantification of epidermal co-localization of anti-IL-1α mAb green fluorescence with DAPI blue fluorescence using the Pearson’s coefficient for a value range of 0 to 1 in which 0 = no pixels co-localize and 1 = all pixels co-localize. †P<0.01, ft/ft day 0 vs. day 21, as calculated by two-tailed Student’s t-test. n = 3–6 mice/group per experiment.
Figure 7.
Figure 7.
Dysbiosis drives nuclear IL-1α release and skin inflammation. On day 21, ft/ft mice with skin inflammation were treated topically with vehicle (ft/ft control) or Neosporin, or co-housed 1:1 with naïve wt mice (CoHo) for 7 days and skin samples collected on day 28. (A) Representative digital photographs and histology (H&E) (scale bars = 200 m). (B) Mean area of skin inflammation cm2 ± s.e.m. (C) Mean epidermal thickness (m) ± s.e.m. (D) Mean number ± s.e.m. of PMNs, monocytes and eosinophils per million cells from day 28 skin. (E) Mean IL-1α protein levels (pg/mg) ± s.e.m. (F) Representative immunofluorescence of sections (400×) labeled with anti-IL-1α (green, upper panels) and DAPI (blue, lower panels) with merged labeling (cyan, lower panels). Dashed line = dermoepidermal junction and insets = 4× higher digital magnification of the nuclei. *P<0.05, †P<0.01, ‡P<0.001, ft/ft control vs. treated mice, as calculated by two-tailed Student’s t-test (B-E). Results are representative of 2 independent experiments (n = 4–5 mice/group per experiment).
Figure 8.
Figure 8.
Co-housing drives a microbial shift in ft/ft mice. (A) Skin microbiome of ft/ft control (not co-housed) and co-housed ft/ft mice with skin inflammation and wt mice from skin swabs collected before (day 14 and 17), just prior (day 21) and after co-housing (day 25 and 28) by principal coordinate analysis (PCoA) clustering using theta coefficient. Statistical difference of the microbial community was performed by analysis of molecular variance (AMOVA). Statistically significant increased operational taxonomic units (OTUs) (B) or decreased OTUs (C) in co-housed ft/ft mice compared to ft/ft control mice (at day 25 and 28). *P<0.05, †P<0.01, as calculated by Wilcoxon test. (D) Taxonomic classification of altered OTUs.

References

    1. Nestle FO, Di Meglio P, Qin JZ, Nickoloff BJ. Skin immune sentinels in health and disease. Nat Rev Immunol 2009; 9:679–91. - PMC - PubMed
    1. Heath WR, Carbone FR. The skin-resident and migratory immune system in steady state and memory: innate lymphocytes, dendritic cells and T cells. Nat Immunol 2013; 14:978–85. - PubMed
    1. Kupper TS, Fuhlbrigge RC. Immune surveillance in the skin: mechanisms and clinical consequences. Nat Rev Immunol 2004; 4:211–22. - PMC - PubMed
    1. Pasparakis M, Haase I, Nestle FO. Mechanisms regulating skin immunity and inflammation. Nat Rev Immunol 2014; 14:289–301. - PubMed
    1. Drucker AM, Wang AR, Li WQ, Sevetson E, Block JK, Qureshi AA. The Burden of Atopic Dermatitis: Summary of a Report for the National Eczema Association. J Invest Dermatol 2017; 137:26–30. - PubMed

Publication types