. 2018 Jun 29:4:1-19.
doi: 10.1016/j.isci.2018.05.001. Epub 2018 May 5.

A Small Chaperone Improves Folding and Routing of Rhodopsin Mutants Linked to Inherited Blindness

Affiliations

A Small Chaperone Improves Folding and Routing of Rhodopsin Mutants Linked to Inherited Blindness

Petra Behnen et al. iScience. .

Abstract

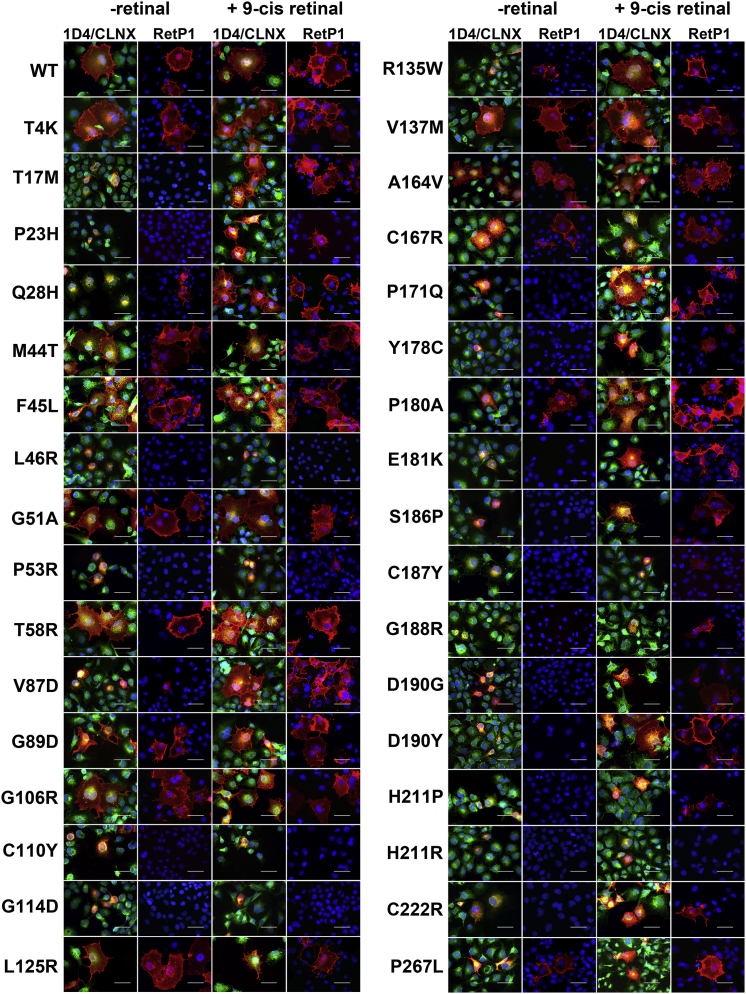
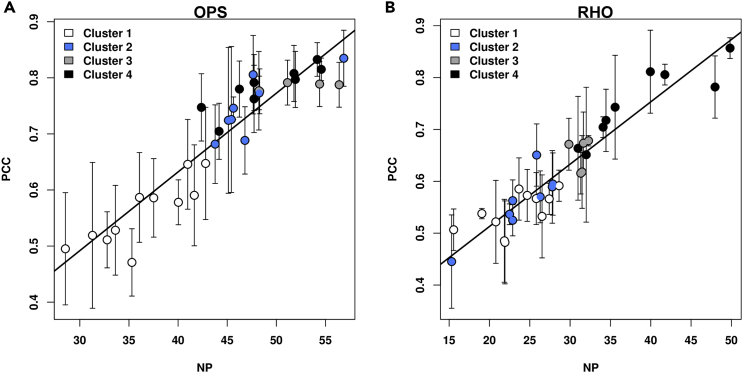
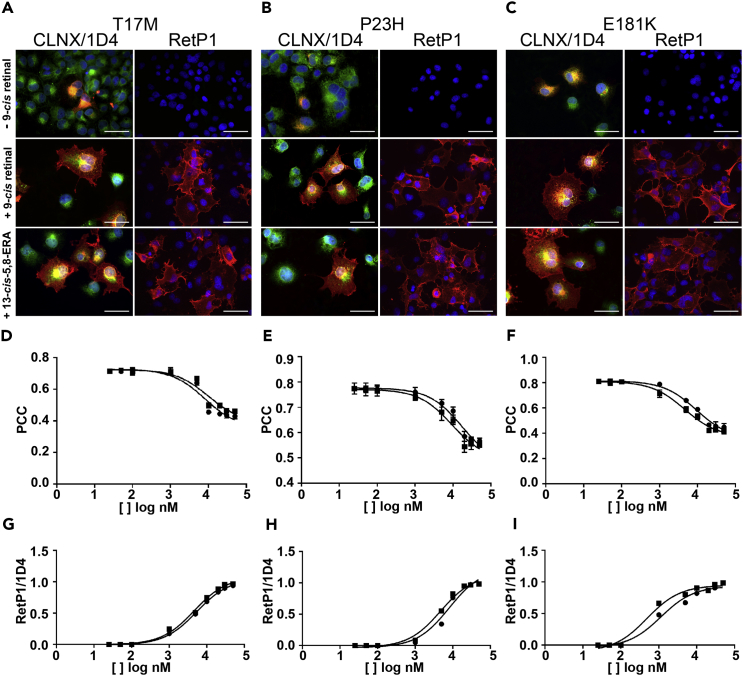
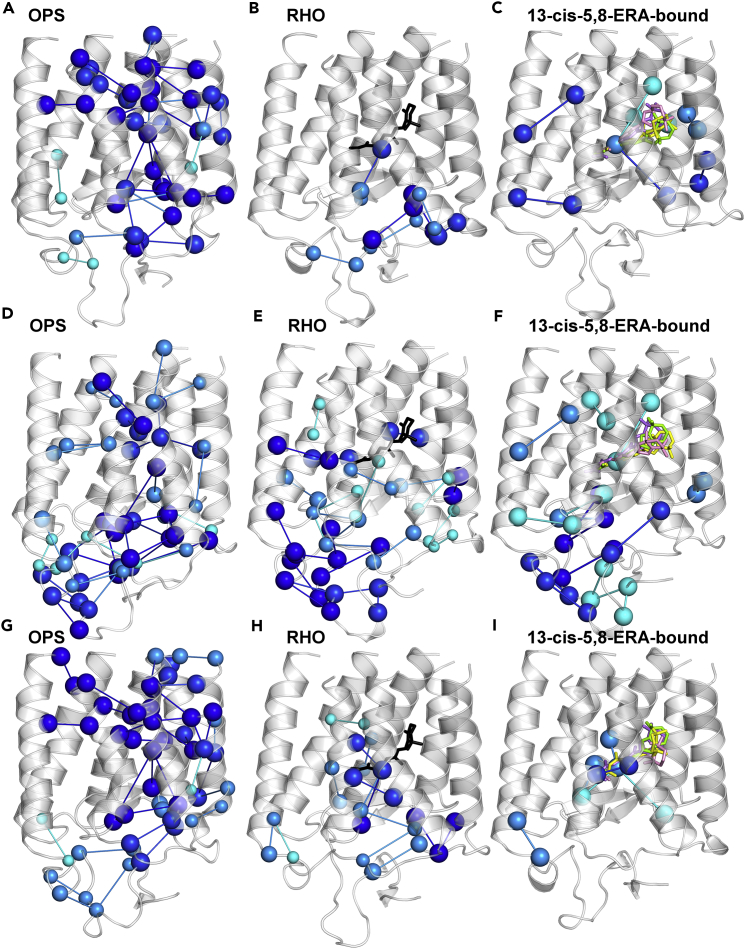
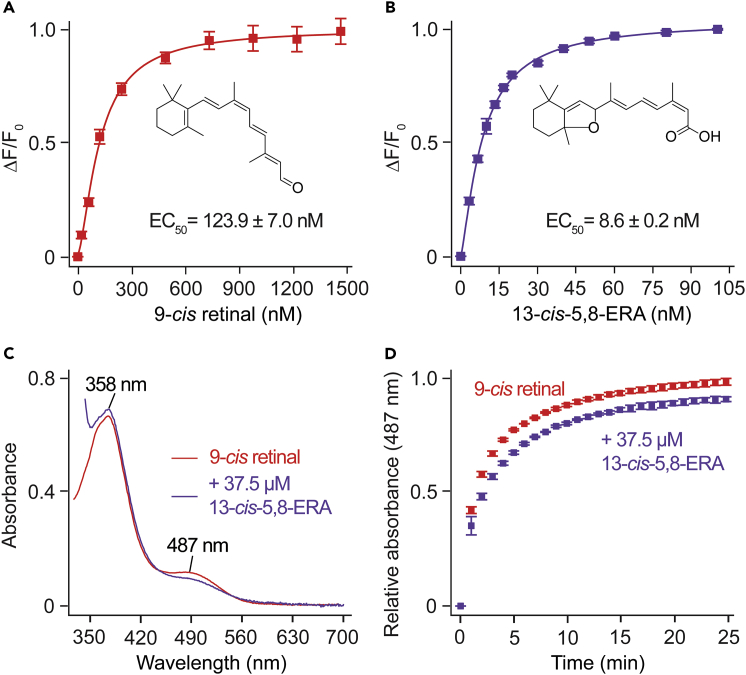
The autosomal dominant form of retinitis pigmentosa (adRP) is a blindness-causing conformational disease largely linked to mutations of rhodopsin. Molecular simulations coupled to the graph-based protein structure network (PSN) analysis and in vitro experiments were conducted to determine the effects of 33 adRP rhodopsin mutations on the structure and routing of the opsin protein. The integration of atomic and subcellular levels of analysis was accomplished by the linear correlation between indices of mutational impairment in structure network and in routing. The graph-based index of structural perturbation served also to divide the mutants in four clusters, consistent with their differences in subcellular localization and responses to 9-cis retinal. The stability core of opsin inferred from PSN analysis was targeted by virtual screening of over 300,000 anionic compounds leading to the discovery of a reversible orthosteric inhibitor of retinal binding more effective than retinal in improving routing of three adRP mutants.

Keywords: Biophysics; Protein Folding; Protein Structure Aspects; Structural Biology.


Figures

None
Graphical abstract
Figure 1
Figure 1
AdRP Mutation Sites and Thermally Stable Structure Networks of RHO and OPS (A–C) (A) The illustration of the crystal structure of dark RHO is shown. Like all GPCRs, OPS comprises an up-down bundle of seven transmembrane helices (H) linked to three intracellular (IL) and three extracellular (EL) loops as well as to extracellular and intracellular termini. The intracellular side is on top. Herein, H1, H2, H3, H4, H5, H6, and H7 are blue, orange, green, pink, yellow, cyan, and violet, respectively. H8, the N- and C-termini are red, EL1 and IL1 are light green, EL2 and IL2 are gray, and EL3 and IL3 are magenta. Mutated sites are represented as spheres centered on the Cα-atoms. Black sticks represent 11-cis retinal. The stable structure networks of native RHO (B) and OPS (C) are shown on the crystal structures (PDB: 1GZM and 3CAP, respectively). Labeled and black (retinal) spheres are the stable native hubs (i.e., those amino acids involved in ≥4 links). Major structural differences between dark RHO and OPS essentially concern the cytosolic half of the H5-H6 portion, in particular H6 that in OPS is tilted outward from the helix bundle by 6–7 Å. See also Tables S1, S2, and S3.
Figure 2
Figure 2
Network Perturbation (NP) Score and Outer van der Waals Volume (Vout) of Retinal as Markers of Structural Mutational Effects (A–C) Plots of the NP score for OPS (A) and RHO (B) and the difference between them (C) are shown. Colors indicate the four clusters obtained by using the NP scores and the ΔNP between them. White, blue, gray, and black indicate clusters 1, 2, 3, and 4, respectively. (D and E) (D) The average values of NP OPS, NP RHO, and ΔNP for each cluster of mutants are shown in a 3-axis plot that highlights the subdivision of the four clusters. The outer van der Waals volume (Vout, Å3) of 11-cis retinal in the average minimized structure of a given mutant relative to the 11-cis retinal van der Waals volume in the average minimized structure of WT RHO is shown (E). See also Tables S1, S4, and S5 and Figures S1 and S2.
Figure 3
Figure 3
Native Stable Links Weakened by Mutation (A–H) Native stable links undergoing an average reduction in frequency ≥25% within each cluster are shown on the crystal structures of OPS (A, C, E, and G) and RHO (B, D, F, and H). Nodes and links are colored according to their average frequency reduction. Cyan, dark cyan, blue, and dark blue represent average reductions up to 30%, 40%, 50%, and greater than 50%, respectively. See also Table S6.
Figure 4
Figure 4
Subcellular Localization of All Analyzed OPS Mutants in the Absence and Presence of Retinal Representative images of the WT and all analyzed OPS mutants in the absence and presence of 10 μM 9-cis retinal are shown. 1D4/CLNX: merged image of the 1D4 (anti OPS/RHO intracellular C-terminus antibody, red) and the CLNX (anti-ER antibody, green) staining; RetP1 (anti extracellular N-terminus antibody, red) staining. Scale bars, 50 μm. See also Videos S1 and S2, Table S4, and Figures S3–S7.
Figure 5
Figure 5
Linear Correlation between NP and PCC (A and B) The scatterplots show the linear correlation between the NP accounting for mutational effects on the native structure network and the PCC index accounting for ER retention in the OPS (A) and RHO (B) states. The linear regression equations are PCC = 0.014NP + 0.071, r = 0.932 for OPS and PCC = 0.012NP + 0.273, r = 0.938 for RHO. The error-weighted correlation coefficients are 0.910 for OPS and 0.960 for RHO. The colors of circles reflect the structural cluster assignment for each mutant (see the legend to Figure 2). See also Figure S2.
Figure 6
Figure 6
Effects of 13-cis-5,8-ERA on Three Mutants (A–C) Representative immunofluorescence images depicting the subcellular localization of T17M (A), P23H (B), and E181K (C) mutants in the OPS state (i.e. - 9-cis retinal), in the presence of 10 μM 9-cis retinal, and in the presence of 10 μM 13-cis-5,8-ERA. CLNX/1D4: merged image of the anti-CLNX antibody staining (green) and the anti-OPS/RHO 1D4 antibody staining against the intracellular C-terminus (red); RetP1: staining of membrane localized OPS/RHO with the RetP1 antibody against the extracellular N-terminus. Scale bars, 50 μm. (D–I) COS-7 transfected cells were exposed to different concentrations of 9-cis retinal (black circles) or 13-cis-5,8-ERA (black squares). Values are the means (±SD) from the analysis of at least ten transfected cells from three independent experiments. PCC values were derived from the analysis of co-localization of calnexin and OPS/RHO (CLNX/1D4) for the T17M (D), P23H (E), and E181K (F) mutants. Ratios of RetP1-positive cells and 1D4-positive cells were computed for the T17M (G), P23H (H), and E181K (I) mutants. See also Table S8.
Figure 7
Figure 7
Effects of 13-cis-5,8-ERA on the Native Structure Network (A–I) Native stable links undergoing reduction in frequency ≥25% are shown in the T17M (A, B, and C), P23H (D, E, and F), and E181K (G, H, and I) adRP mutants. Panels A, D, and G portray the OPS state; panels B, E, and H illustrate the RHO state; and panels C, F, and I show the 13-cis-5,8-ERA-bound forms. For each mutant, the native stable links in the complexes with the four isomers of 13-cis-5,8-ERA that undergo an average reduction in frequency ≥25% are shown. Cyan, dark cyan, blue, and dark blue represent average reductions up to 30%, 40%, 50%, and greater than 50%, respectively. Perturbed links are mapped onto the average minimized structures from 300 K simulations. As for the 13-cis-5,8-ERA-bound forms, perturbed links are mapped onto the average minimized structure of the complexes with the 5S8R isomer. All four isomers are represented by sticks and extracted from the respective average minimized structures (5S8R is green, 5R8S is yellow, 5R8R is violet, and 5S8S is pink). See also Figures S8 and S9.
Figure 8
Figure 8
13-cis-5,8-ERA Binding to Bovine Opsin (A and B) Changes in tryptophan fluorescence at 332 nm (ΔF/F0) with increasing concentrations of 9-cis retinal (A) or 13-cis-5,8-ERA (B). Results are expressed as the mean ± SD, n = 2, each with three biological replicates. (C and D) UV-visible absorption spectra measured at 4 min after 9-cis retinal addition (C) and time-dependent absorption at 487 nm (D) showing the effect of 13-cis-5,8-ERA pre-treatment on the formation of iso-rhodopsin pigment. Results are expressed as the mean ± SD, n = 2, each with three biological replicates. OPS membranes treated with 7.5 μM 9-cis retinal for 4 min showed a new absorption peak at 487 nm owing to the formation of iso-rhodopsin pigment (red). A decrease in iso-rhodopsin formation and regeneration rate was observed when OPS membranes were pre-treated with 37.5 μM of 13-cis-5,8-ERA for 15 min (purple) followed by the addition of 7.5 μM 9-cis retinal.

References

    1. Andres A., Garriga P., Manyosa J. Altered functionality in rhodopsin point mutants associated with retinitis pigmentosa. Biochem. Biophys. Res. Commun. 2003;303:294–301. - PubMed
    1. Athanasiou D., Aguila M., Bellingham J., Li W.W., Mcculley C., Reeves P.J., Cheetham M.E. The molecular and cellular basis of rhodopsin retinitis pigmentosa reveals potential strategies for therapy. Prog. Retin. Eye Res. 2018;62:1–23. - PMC - PubMed
    1. Bernier V., Lagace M., Lonergan M., Arthus M.F., Bichet D.G., Bouvier M. Functional rescue of the constitutively internalized V2 vasopressin receptor mutant R137H by the pharmacological chaperone action of SR49059. Mol. Endocrinol. 2004;18:2074–2084. - PubMed
    1. Bhattacharya S., Ridge K.D., Knox B.E., Khorana H.G. Light-stable rhodopsin. I. A rhodopsin analog reconstituted with a nonisomerizable 11-cis retinal derivative. J. Biol. Chem. 1992;267:6763–6769. - PubMed
    1. Brinda K.V., Vishveshwara S. A network representation of protein structures: implications for protein stability. Biophys. J. 2005;89:4159–4170. - PMC - PubMed