. 2018 Jun 29:4:312-325.
doi: 10.1016/j.isci.2018.05.021. Epub 2018 Jun 28.

Marked Global DNA Hypomethylation Is Associated with Constitutive PD-L1 Expression in Melanoma

Affiliations

Marked Global DNA Hypomethylation Is Associated with Constitutive PD-L1 Expression in Melanoma

Aniruddha Chatterjee et al. iScience. .

Abstract

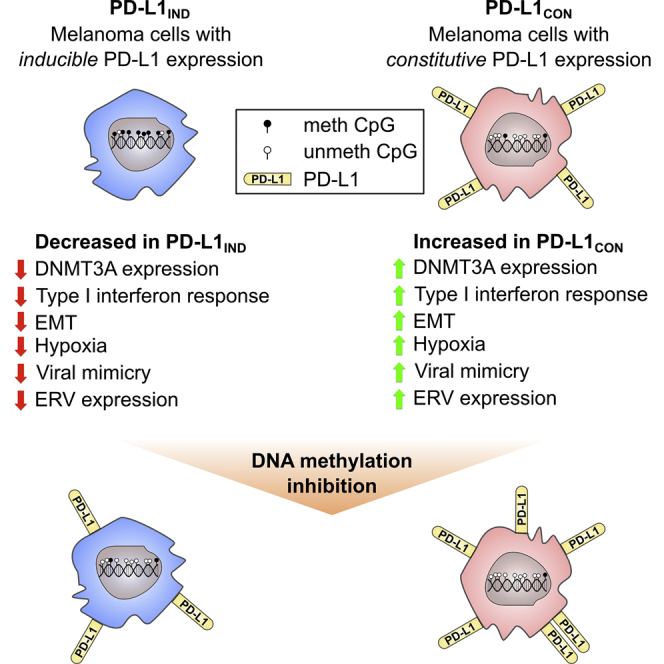
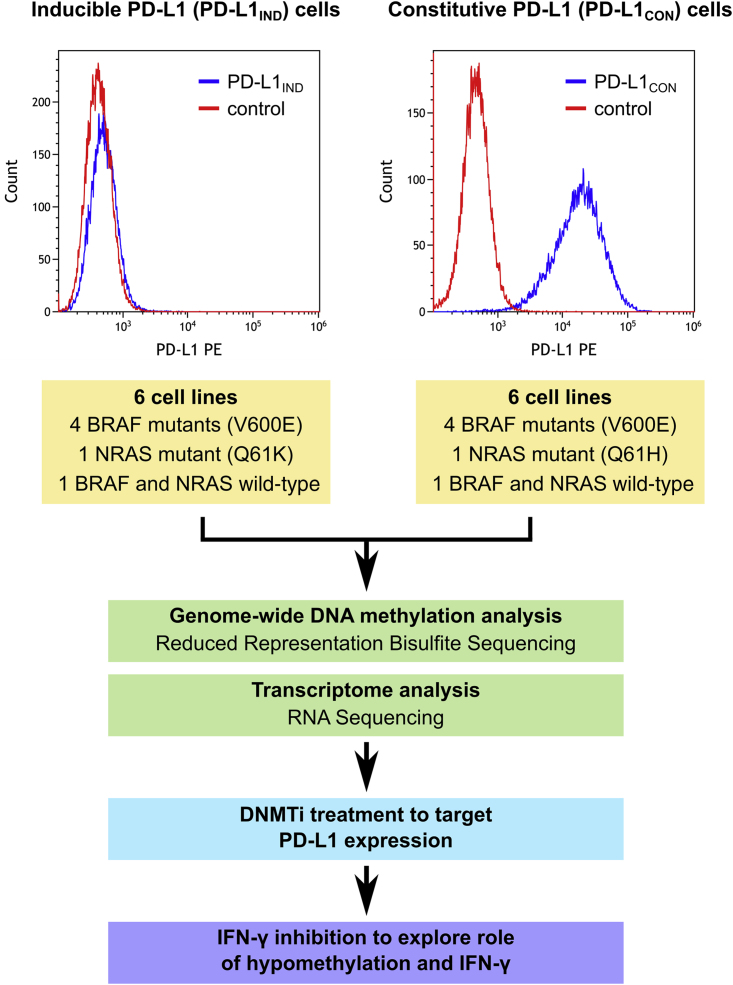
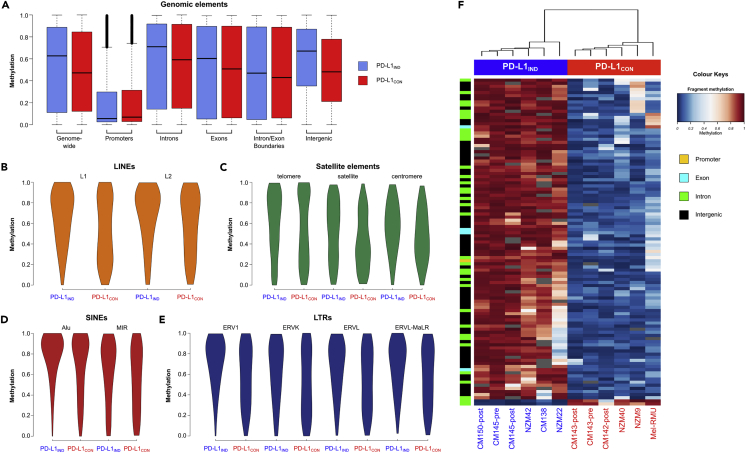
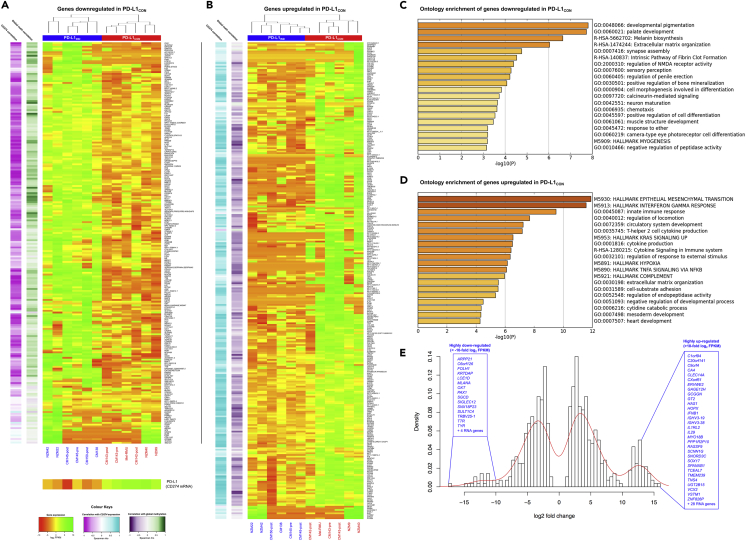
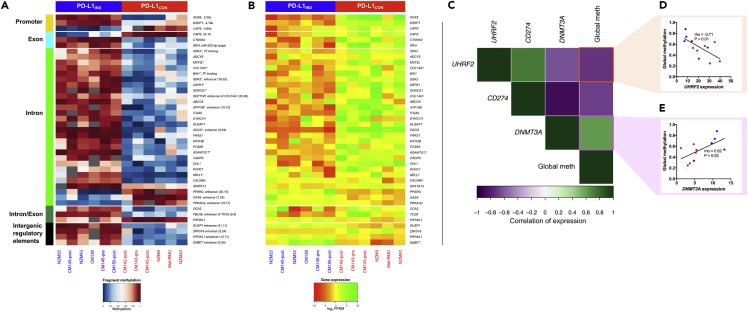
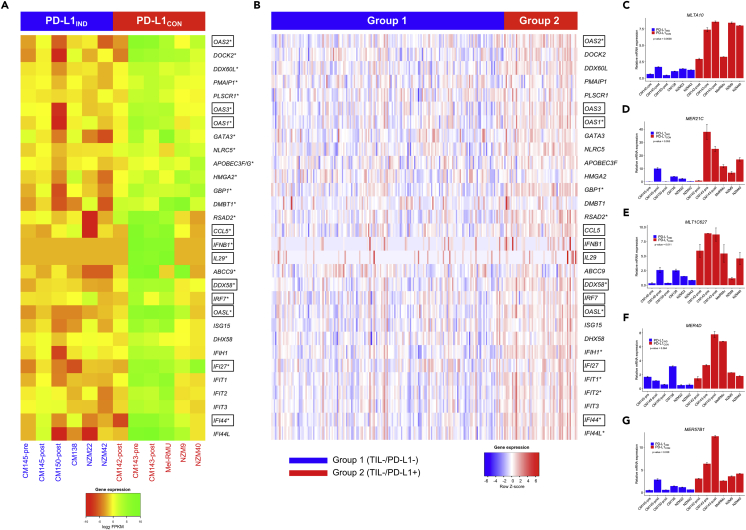
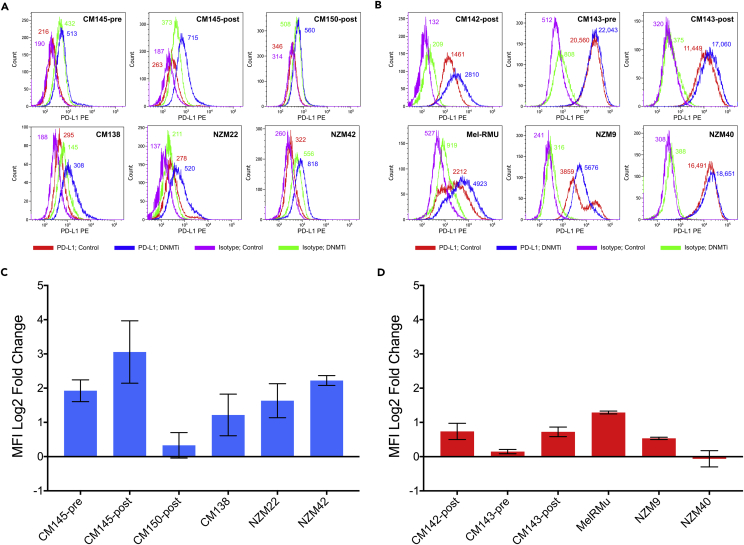
Constitutive expression of the immune checkpoint, PD-L1, inhibits anti-tumor immune responses in cancer, although the factors involved in PD-L1 regulation are poorly understood. Here we show that loss of global DNA methylation, particularly in intergenic regions and repeat elements, is associated with constitutive (PD-L1CON), versus inducible (PD-L1IND), PD-L1 expression in melanoma cell lines. We further show this is accompanied by transcriptomic up-regulation. De novo epigenetic regulators (e.g., DNMT3A) are strongly correlated with PD-L1 expression and methylome status. Accordingly, decitabine-mediated inhibition of global methylation in melanoma cells leads to increased PD-L1 expression. Moreover, viral mimicry and immune response genes are highly expressed in lymphocyte-negative plus PD-L1-positive melanomas, versus PD-L1-negative melanomas in The Cancer Genome Atlas (TCGA). In summary, using integrated genomic analysis we identified that global DNA methylation influences PD-L1 expression in melanoma, and hence melanoma's ability to evade anti-tumor immune responses. These results have implications for combining epigenetic therapy with immunotherapy.

Keywords: Cancer; Genetics; Genomics; Transcriptomics.


Figures

None
Graphical abstract
Figure 1
Figure 1
Summary of Experimental Design and the Analysis Pipeline for PD-L1IND and PD-L1CON Cell Lines to Identify Epigenetic Regulation of PD-L1 in Melanoma For a Figure360 author presentation of Figure 1, see http//dx.doi:10.1016/j.isci.2018.05.021#mmc3. The upper panel shows representative FACS figures from PD-L1CON and PD-L1IND cells. See also Figures S1–S3, and Table S1.
Figure 2
Figure 2
Whole-Genome-Scale and Element-Wise Methylation Profiles in PD-L1IND and PD-L1CON Cell Lines (A) Boxplots showing genome-wide and genomic element RRBS methylation profiles for PD-L1IND (blue) and PD-L1CON (red) cell lines; black bars indicate the median methylation. (B–E) Equal-area violin plots of PD-L1CON and PD-L1IND DNA methylation levels for different classes of repeat elements. (B) LINE elements (L1 and L2), (C) Satellite elements (satellite, telomeric, and centromeric repeats), (D) SINE elements (Alu and MIR), and (E) LTRs (ERV1, ERVK, ERVL, and ERVL-MaLR). In all cases the y axis represents the methylation level on a 0–1 scale. Annotations for repeat elements were downloaded from the UCSC repeat masker database. (F) Methylation levels for the 105 differentially methylated fragments (DMFs) showing >70% methylation difference between the PD-L1IND and PD-L1CON cell lines (blue = unmethylated, red = fully methylated). See also Figures S4–S9 and Tables S2–S4. The methylation data are available at Database: NCBI GEO, accession number GSE107622.
Figure 3
Figure 3
Differential Expression Patterns in PD-L1IND and PD-L1CON Cell Lines (A) Mean-centered heatmap of the expression level (log2 FPKMs) of 222 significantly down-regulated genes in PD-L1CON. (B) Mean-centered heatmap of the expression level (log2 FPKMs) of 286 significantly up-regulated genes in PD-L1CON. The correlations of these genes with CD274 (PD-L1) expression and global methylation status in the analyzed cell lines are shown in the colored sidebars (left) in both figures. (C) Enriched gene ontology terms relative to the 222 genes down-regulated in PD-L1CON cell lines. (D) Enriched gene ontology terms relative to the 286 genes up-regulated in PD-L1CON cell lines. In figure (C) and (D), the x axis represents –log10 of the p value. (E) Density histogram of the log2 fold changes for the significantly up-regulated (n = 286, right side of the histogram) and down-regulated (n = 222, left side of the histogram) genes. Genes with log2 fold change >10 are indicated. See also Figures S10–S12. The RNA-Seq data are available at Database: NCBI GEO, accession number GSE107622.
Figure 4
Figure 4
Differential Methylation Pattern and Relationship with Differential Expression in PD-L1IND and PD-L1CON Cell Lines and Role of Epigenetic Regulators (A) Methylation heatmap of PD-L1CON and PD-L1IND cell lines for the differentially methylated fragments (DMFs) in different genomic elements showing the relationship with differential mRNA expression (blue = unmethylated, red = fully methylated). For several genes, multiple DMFs showed a strong correlation and are indicated as *. (B) Mean-centered heatmap of the expression level (log2 FPKMs) of the 39 genes that are regulated by methylation levels. (C) Correlogram showing cross-correlation of the key epigenetic regulator genes with CD274 (PD-L1) expression and global RRBS methylome levels. (D and E) Relationship between mRNA level and RRBS methylome for the analyzed cell lines for de novo methylation machinery genes UHRF2 (D) and DNMT3A (E). Spearman rho and statistical significance are shown. See also Figures S13–S15 and Table S5.
Figure 5
Figure 5
Expression Pattern of Viral Mimicry Genes in PD-L1IND and PD-L1CON Cell Lines and Patients with Melanoma (A) Mean-centered heatmap of the expression level (log2 FPKMs) of 30 viral mimicry and immune-system-related genes in PD-L1IND and PD-L1CON cell lines. (B) Heatmap of the expression level (scaled Z score) of the same set of 30 genes in TCGA skin cutaneous melanoma data stratified by TIL−/PD-L1− (group 1, representative of inducible in patient group) or TIL−/PD-L1+ (group 2, representative of constitutive in patient group). In both (A) and (B), significantly differentially expressed genes are indicated with an asterisk (*) and the gene names in a box are DNMTi-responsive genes (i.e., previously shown to be silenced and re-expressed upon DNMTi treatment in cancer). (C–G) Gene expression of five of the nine selected ERV genes as measured by RT-qPCR. There is a higher expression of five ERV genes (MLTA10, MER21C, MLT1C627, MER4D, MER57B1) in the PD-L1CON cell lines compared with the PD-L1IND group. Error bars represent SE of two technical replicates. See also Tables S6 and S7.
Figure 6
Figure 6
Up-regulation of PD-L1 Cell Surface Expression Upon DNMTi (Demethylation) Treatment in PD-L1IND and PD-L1CON Cell Lines Flow cytometry analysis for PD-L1IND (A) and PD-L1CON (B) cell lines was performed at day 6 following 3 days treatment with decitabine (DNMTi; 0.5μM) or mock treatment (DMSO). Changes of PD-L1 expression between DNMTi treated and the control for PD-L1IND (C) and PD-L1CON (D) cell lines were calculated using medium fluorescence intensities (MFI) and the formula log2 ([(MFIantibody, treated)−(MFIisotype, treated)]/[(MFIantibody, mock)−(MFIisotype, mock)]) (Wrangle et al., 2013). Error bars represent SE of two technical replicates. See also Figures S16 and S17.

References

    1. Ansell S.M., Lesokhin A.M., Borrello I., Halwani A., Scott E.C., Gutierrez M., Schuster S.J., Millenson M.M., Cattry D., Freeman G.J. PD-1 blockade with nivolumab in relapsed or refractory Hodgkin's lymphoma. N. Engl. J. Med. 2015;372:311–319. - PMC - PubMed
    1. Aran D., Toperoff G., Rosenberg M., Hellman A. Replication timing-related and gene body-specific methylation of active human genes. Hum. Mol. Genet. 2011;20:670–680. - PubMed
    1. Baylin S.B., Jones P.A. A decade of exploring the cancer epigenome - biological and translational implications. Nat. Rev. Cancer. 2011;11:726–734. - PMC - PubMed
    1. Bird A.P. Gene number, noise reduction and biological complexity. Trends Genet. 1995;11:94–100. - PubMed
    1. Chatterjee A., Macaulay E.C., Ahn A., Ludgate J.L., Stockwell P.A., Weeks R.J., Parry M.F., Foster T.J., Knarston I.M., Eccles M.R. Comparative assessment of DNA methylation patterns between reduced representation bisulfite sequencing and sequenom EpiTyper methylation analysis. Epigenomics. 2017;9:823–832. - PubMed