. 2018 Dec:143:49-62.
doi: 10.1016/j.neuropharm.2018.09.014. Epub 2018 Sep 18.

Acute inflammation sensitizes knee-innervating sensory neurons and decreases mouse digging behavior in a TRPV1-dependent manner

Affiliations

Acute inflammation sensitizes knee-innervating sensory neurons and decreases mouse digging behavior in a TRPV1-dependent manner

Sampurna Chakrabarti et al. Neuropharmacology. 2018 Dec.

Abstract

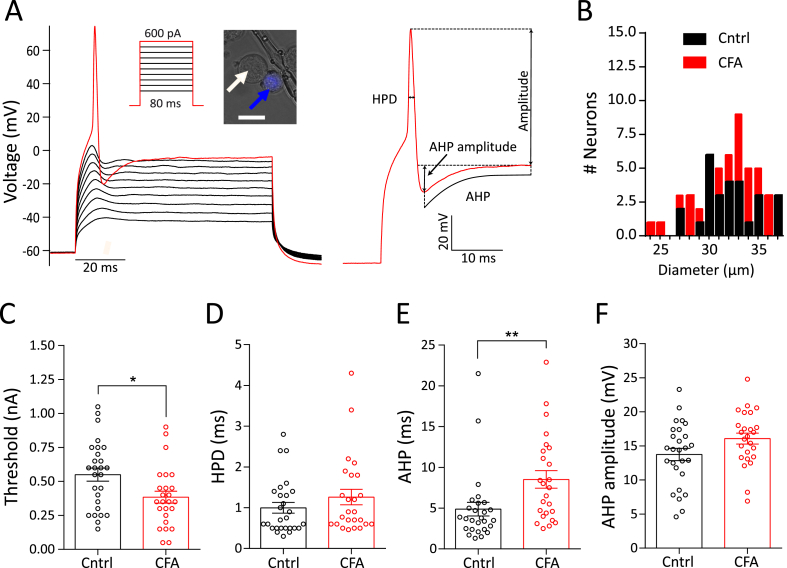
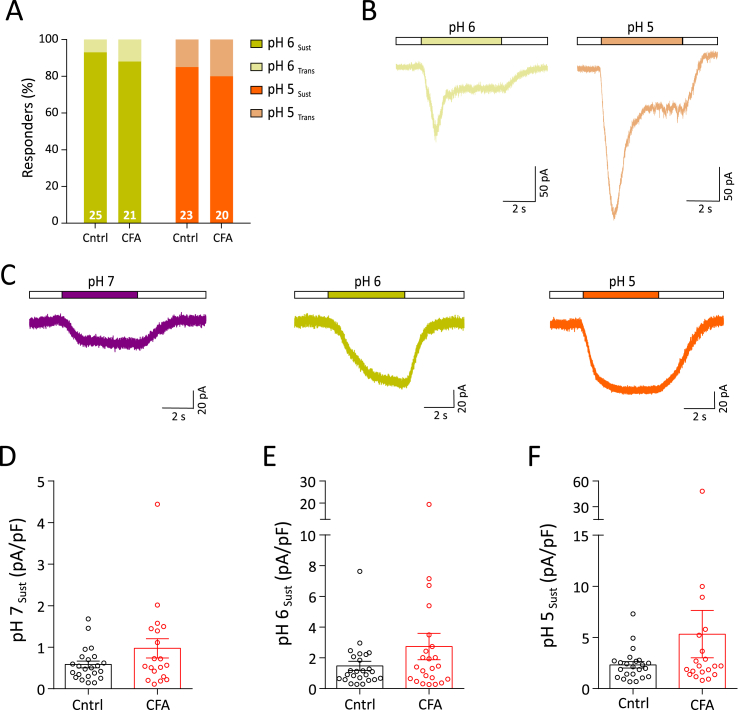
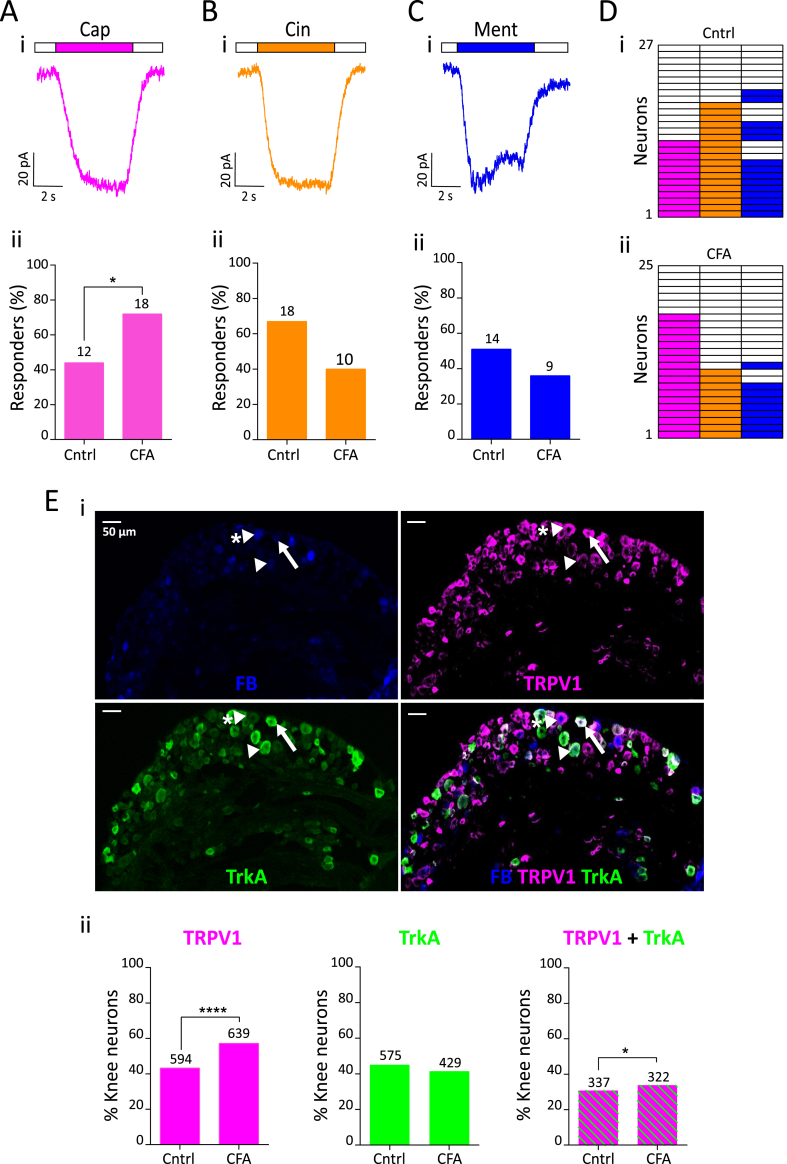
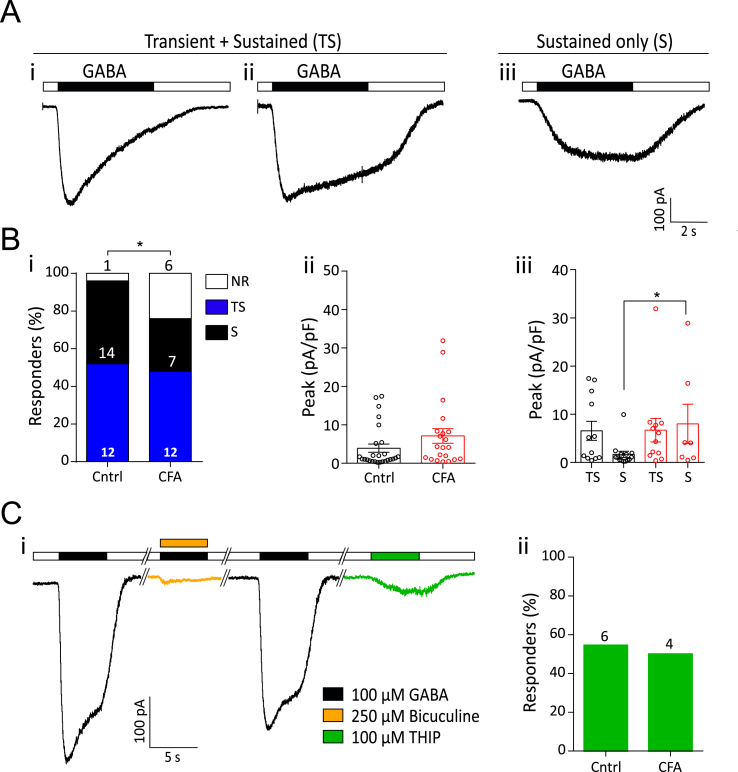
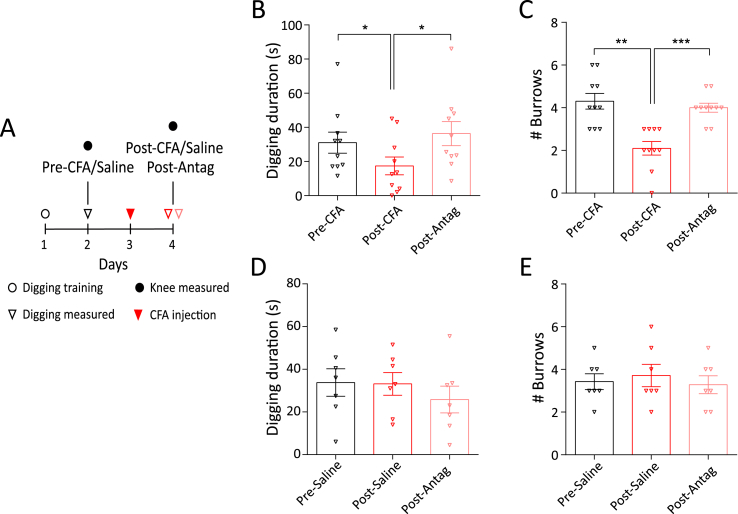
Ongoing, spontaneous pain is characteristic of inflammatory joint pain and reduces an individual's quality of life. To understand the neural basis of inflammatory joint pain, we made a unilateral knee injection of complete Freund's adjuvant (CFA) in mice, which reduced their natural digging behavior. We hypothesized that sensitization of knee-innervating dorsal root ganglion (DRG) neurons underlies this altered behavior. To test this hypothesis, we performed electrophysiological recordings on retrograde labeled knee-innervating primary DRG neuron cultures and measured their responses to a number of electrical and chemical stimuli. We found that 24-h after CFA-induced knee inflammation, knee neurons show a decreased action potential generation threshold, as well as increased GABA and capsaicin sensitivity, but have unaltered acid sensitivity. The inflammation-induced sensitization of knee neurons persisted for 24-h in culture, but was not observed after 48-h in culture. Through immunohistochemistry, we showed that the increased knee neuron capsaicin sensitivity correlated with enhanced expression of the capsaicin receptor, transient receptor potential vanilloid 1 (TRPV1) in knee-innervating neurons of the CFA-injected side. We also observed an increase in the co-expression of TRPV1 with tropomyosin receptor kinase A (TrkA), which is the receptor for nerve growth factor (NGF), suggesting that NGF partially induces the increased TRPV1 expression. Lastly, we found that systemic administration of the TRPV1 antagonist, A-425619, reversed the decrease in digging behavior induced by CFA injection, further confirming the role of TRPV1, expressed by knee neurons, in acute inflammatory joint pain.

Keywords: Digging behavior; Dorsal root ganglion neurons; Inflammation; Joint pain; Sensitization; TRPV1.


Figures

Fig. 1
Fig. 1
CFA model of acute knee inflammation in mice. A) Experimental timeline indicating when intra-articular injections, behavioral training and measurements were conducted. B) Representative picture of CFA injected (ipsilateral) and non-injected (contralateral) knee (shaved before injections). Arrows indicate where knee width was measured. C) Knee width on the day of CFA injection (pre) and 24-h after CFA injection (post) in the ipsilateral (red dots) and contralateral (black dots) knee (n = 17). **** indicates p < 0.0001, paired t-test. Plots of (D) time spent digging and (E) the number of visible burrows after a 3-min digging test (n = 7). * indicates p < 0.05, ** indicates p < 0.01, repeated measures ANOVA, Holm-Sidak multiple comparison test. Error bars indicate SEM. (For interpretation of the references to colour in this figure legend, the reader is referred to the Web version of this article.)
Fig. 2
Fig. 2
Action potential properties of knee neurons following acute knee inflammation. A) Action potential generation protocol (inset) and response along with a close-up of an evoked action potential from a knee neuron showing the different parameters measured. Example of a labeled knee neuron (blue arrow) and an unlabeled neuron (white arrow) shown in inset. Scale bar indicates 25 μm. B) Frequency distribution of neuronal diameter in μm of CFA (red, n = 25) and Cntrl (black, n = 27) neurons. C-F) Distribution of threshold (C), half peak duration (HPD) (D), afterhyperpolarization (AHP) (E) and AHP amplitude (F) after 4-h in culture. Error bars indicate SEM, * indicates p < 0.05, ** indicates p < 0.01, unpaired t-test. (For interpretation of the references to colour in this figure legend, the reader is referred to the Web version of this article.)
Fig. 3
Fig. 3
Acid sensitivity of knee neurons after acute inflammation. A) Percentage frequency of transient + sustained vs. sustained only response to pH 6 (transient + sustained, light yellow; sustained, dark yellow) and pH 5 (transient + sustained, light orange; sustained, orange) B) Example traces of transient + sustained acid currents in response to pH 6 (light yellow) and pH 5 (light orange). C) Example traces of sustained response to pH 7 (purple), pH 6 (dark yellow) and pH 5 (orange). D-F) Peak current density of sustained pH 7, pH 6 and pH 5 responses (CFA: red dots, Cntrl: black dots). (For interpretation of the references to colour in this figure legend, the reader is referred to the Web version of this article.)
Fig. 4
Fig. 4
TRP agonist response profile of knee neurons following acute knee inflammation. Representative traces of 10 μM capsaicin (pink, Ai), 100 μM cinnamaldehyde (orange, Bi) and 100 μM menthol (blue, Ci) response from a CFA neuron and their respective percentage frequency (Aii, Bii, Cii). The numbers above the bars indicate the number of responsive neurons. D) Heat map of Cntrl (i, n = 27) and CFA (ii, n = 25) neurons responding to capsaicin, cinnamaldehyde and menthol. E (i) Representative images of a whole DRG section from L4 showing fast blue (FB) labeling from the knee (blue), TRPV1 expression (pink), TrkA expression (green) and a merged image; sections from an animal injected with CFA. White arrowhead shows a knee neuron that only expresses TrkA, white arrowhead with asterisk shows a knee neuron that expresses only TRPV1 and white arrow shows a knee neuron that co-expresses TRPV1 and TrkA. (ii) Proportion of knee neurons (L2-L5) that express TRPV1 (pink), TrkA (green) and both TRPV1 and TrkA (green and pink stripes) from Cntrl (n = 1334) and CFA (n = 1089) injected side. Numbers above the bars represent neurons stained positive with respective antibodies. * indicates p < 0.05, **** indicates p < 0.0001, chi-sq test. (For interpretation of the references to colour in this figure legend, the reader is referred to the Web version of this article.)
Fig. 5
Fig. 5
GABA-evoked currents from knee neurons after acute inflammation. A) Representative traces of 100 μM GABA-evoked currents showing both transient and sustained phases (i, ii) and currents with only a sustained phase (iii). B (i) Percentage frequency of GABA-evoked transient + sustained currents (blue bars), sustained currents (black bars) and non-responders (white bars) in Cntrl and CFA neurons. (ii) Peak current density of all GABA-evoked currents (Cntrl: n = 26, CFA: 19) and (iii) GABA-evoked currents split into TS and S type (Cntrl: black dots; CFA: red dots). TS = transient + sustained currents, S = sustained only currents, error bars indicate SEM, * indicates p < 0.05, unpaired t-test. C) i - Example trace of bicuculline block (yellow) of GABA-evoked currents and THIP-evoked current (green) in a single neuron. ii – percentage frequency of Cntrl (n = 11) and CFA (n = 8) neurons with a GABA response that also responded to THIP. The numbers above the bars indicate the number of responsive neurons. (For interpretation of the references to colour in this figure legend, the reader is referred to the Web version of this article.)
Fig. 6
Fig. 6
Digging behavior after injection of the TRPV1 antagonist A-425619. A) Experimental timeline highlighting the days where behavioral testing and injection was performed. Distribution of time spent digging and the number of burrows in the CFA (B, C, n = 10) and saline group (D, E, n = 7). * indicates p < 0.05, ** indicates p < 0.01, *** indicates p < 0.0001. rmANOVA, Holm-Sidak multiple comparison test. Error bars indicate SEM.

References

    1. Amaya F., Oh-hashi K., Naruse Y., Iijima N., Ueda M., Shimosato G., Tominaga M., Tanaka Y., Tanaka M. Local inflammation increases vanilloid receptor 1 expression within distinct subgroups of DRG neurons. Brain Res. 2003;963:190–196. doi: 10.1016/S0006-8993(02)03972-0. - DOI - PubMed
    1. Andersson S.E., Lexmuller K., Johansson A., Ekstrom G.M. Tissue and intracellular pH in normal periarticular soft tissue and during different phases of antigen induced arthritis in the rat. J. Rheumatol. 1999;26:2018–2024. - PubMed
    1. Arendt-Nielsen L. Joint pain: more to it than just structural damage? Pain. 2017;158 - PubMed
    1. Bär K.-J., Schaible H.-G., Bräuer R., Halbhuber K.-J., von Banchet G.S. The proportion of TRPV1 protein-positive lumbar DRG neurones does not increase in the course of acute and chronic antigen-induced arthritis in the knee joint of the rat. Neurosci. Lett. 2004;361:172–175. doi: 10.1016/j.neulet.2003.12.034. - DOI - PubMed
    1. Behrendt H.-J., Germann T., Gillen C., Hatt H., Jostock R. Characterization of the mouse cold-menthol receptor TRPM8 and vanilloid receptor type-1 VR1 using a fluorometric imaging plate reader (FLIPR) assay. Br. J. Pharmacol. 2004;141:737–745. doi: 10.1038/sj.bjp.0705652. - DOI - PMC - PubMed

Publication types

MeSH terms