

All-Cause and Cancer Mortality Trends in Macheng, China (1984⁻2013): An Age-Period-Cohort Analysis
- PMID: 30241353
- PMCID: PMC6210680
- DOI: 10.3390/ijerph15102068
All-Cause and Cancer Mortality Trends in Macheng, China (1984⁻2013): An Age-Period-Cohort Analysis
Abstract
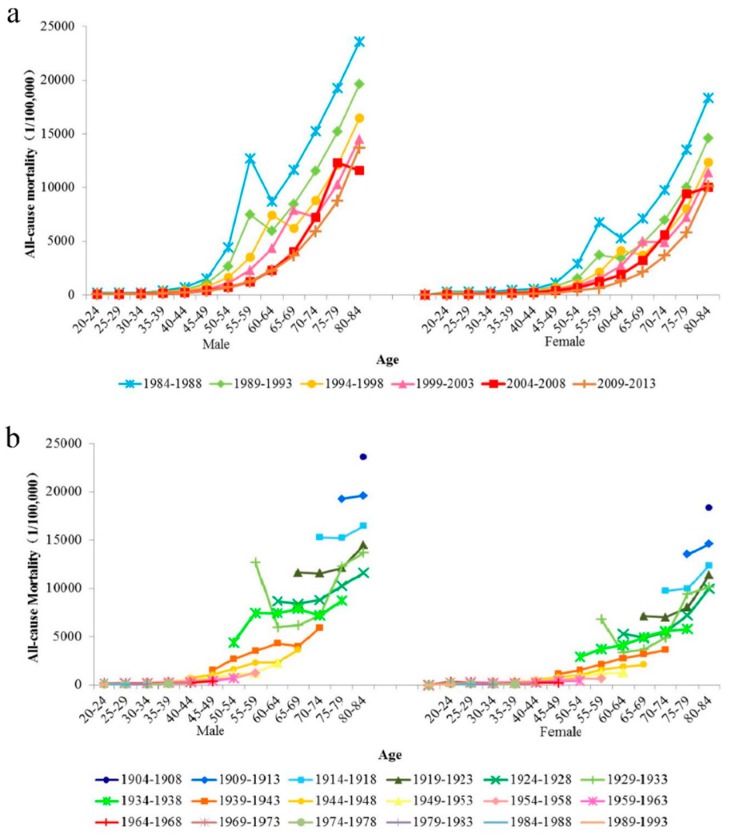
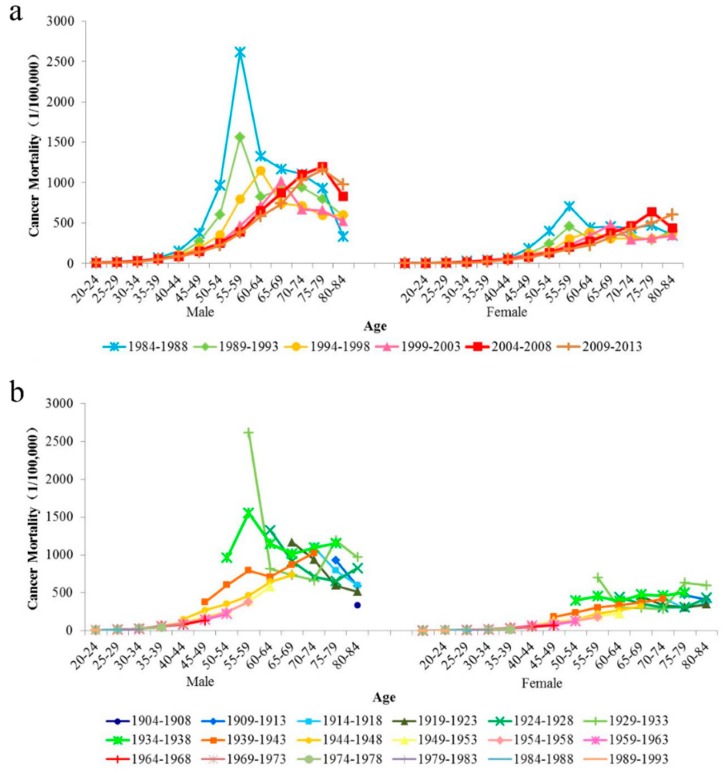
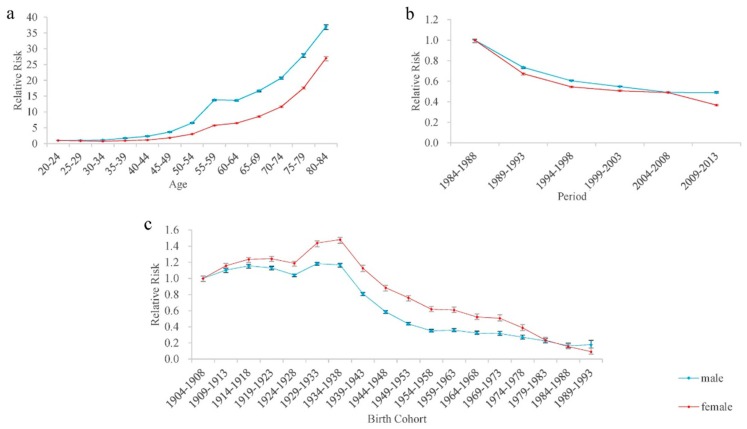
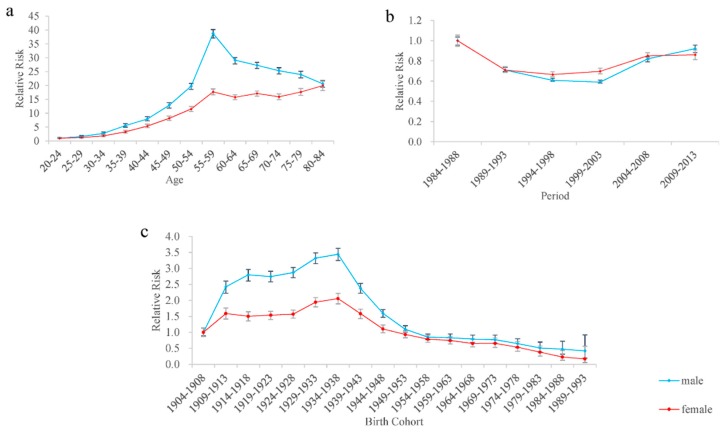
The aim was to study the variation trends of all-cause and cancer mortality during 1984⁻2013 in Macheng City, China. The mortality data were collected from Macheng City disease surveillance points system and Hubei Center for Disease Control and Prevention. The model life table system was used to adjust mortality rates due to an under-reporting problem. An age-period-cohort model and intrinsic estimator algorithm were used to estimate the age effect, period effect, and cohort effect of all-cause mortality and cancer mortality for males and females. Age effect of all-cause mortality for both sexes increased with age, while the age effect of cancer mortality for both sexes reached a peak at the age group of 55⁻59 years old and then decreased. The relative risks (RRs) of all-cause mortality for males and females declined with the period and decreased by 51.13% and 63.27% during the whole study period, respectively. Furthermore, the period effect of cancer mortality in both sexes decreased at first and then increased. The cohort effect of all-cause and cancer mortality for both sexes born after 1904 presented the pattern of "rise first and then fall," and decreased by 82.18% and 90.77% from cohort 1904⁻1908 to 1989⁻1993, respectively; especially, the risk of all-cause and cancer mortality for both sexes born before 1949 was much higher than that for those born after 1949.
Keywords: age-period-cohort model; all-cause mortality; cancer mortality; intrinsic estimator algorithm.
Conflict of interest statement
The authors declare no conflict of interest.
Figures
Similar articles
-
Comparison of Secular Trends in Cervical Cancer Mortality in China and the United States: An Age-Period-Cohort Analysis.Int J Environ Res Public Health. 2016 Nov 17;13(11):1148. doi: 10.3390/ijerph13111148. Int J Environ Res Public Health. 2016. PMID: 27869688 Free PMC article.
-
[Analysis on the long-term trend of injury related deaths in Macheng of Hubei province, 1974-2008].Zhonghua Liu Xing Bing Xue Za Zhi. 2010 Oct;31(10):1090-3. Zhonghua Liu Xing Bing Xue Za Zhi. 2010. PMID: 21162806 Chinese.
-
Long-Term Trends in Unintentional Fall Mortality in China: A Population-Based Age-Period-Cohort Study.Front Public Health. 2021 Nov 24;9:749295. doi: 10.3389/fpubh.2021.749295. eCollection 2021. Front Public Health. 2021. PMID: 35024364 Free PMC article.
-
An age-period-cohort analysis of female breast cancer mortality from 1990-2009 in China.Int J Equity Health. 2015 Sep 14;14:76. doi: 10.1186/s12939-015-0211-x. Int J Equity Health. 2015. PMID: 26369689 Free PMC article.
-
Different trends in colorectal cancer mortality between age groups in China: an age-period-cohort and joinpoint analysis.Public Health. 2019 Jan;166:45-52. doi: 10.1016/j.puhe.2018.08.007. Epub 2018 Nov 15. Public Health. 2019. PMID: 30447645
Cited by
-
Machine learning models for mortality prediction in critically ill patients with acute pancreatitis-associated acute kidney injury.Clin Kidney J. 2024 Sep 11;17(10):sfae284. doi: 10.1093/ckj/sfae284. eCollection 2024 Oct. Clin Kidney J. 2024. PMID: 39385947 Free PMC article.
-
Cancer mortality in 2020 and its trend analysis in Inner Mongolia during four time periods from 1973 to 2020.Front Oncol. 2023 Jan 31;13:1096968. doi: 10.3389/fonc.2023.1096968. eCollection 2023. Front Oncol. 2023. PMID: 36798823 Free PMC article.
-
Metropolitan age-specific mortality trends at borough and neighborhood level: The case of Mexico City.PLoS One. 2021 Jan 19;16(1):e0244384. doi: 10.1371/journal.pone.0244384. eCollection 2021. PLoS One. 2021. PMID: 33465102 Free PMC article.
References
-
- Murray C.J., Barber R.M., Foreman K.J., Abbasoglu Ozgoren A., Abd-Allah F., Abera S.F., Aboyans V., Abraham J.P., Abubakar I., Abu-Raddad L.J., et al. Global, regional, and national disability-adjusted life years (DALYs) for 306 diseases and injuries and healthy life expectancy (HALE) for 188 countries, 1990–2013: Quantifying the epidemiological transition. Lancet. 2015;386:2145–2191. doi: 10.1016/S0140-6736(15)61340-X. - DOI - PMC - PubMed
Publication types
MeSH terms
LinkOut - more resources
Full Text Sources
Other Literature Sources
Medical
