. 2018 Sep 20;175(1):159-170.e16.
doi: 10.1016/j.cell.2018.08.065.

Multi-level Proteomics Identifies CT45 as a Chemosensitivity Mediator and Immunotherapy Target in Ovarian Cancer

Affiliations

Multi-level Proteomics Identifies CT45 as a Chemosensitivity Mediator and Immunotherapy Target in Ovarian Cancer

Fabian Coscia et al. Cell. .

Abstract

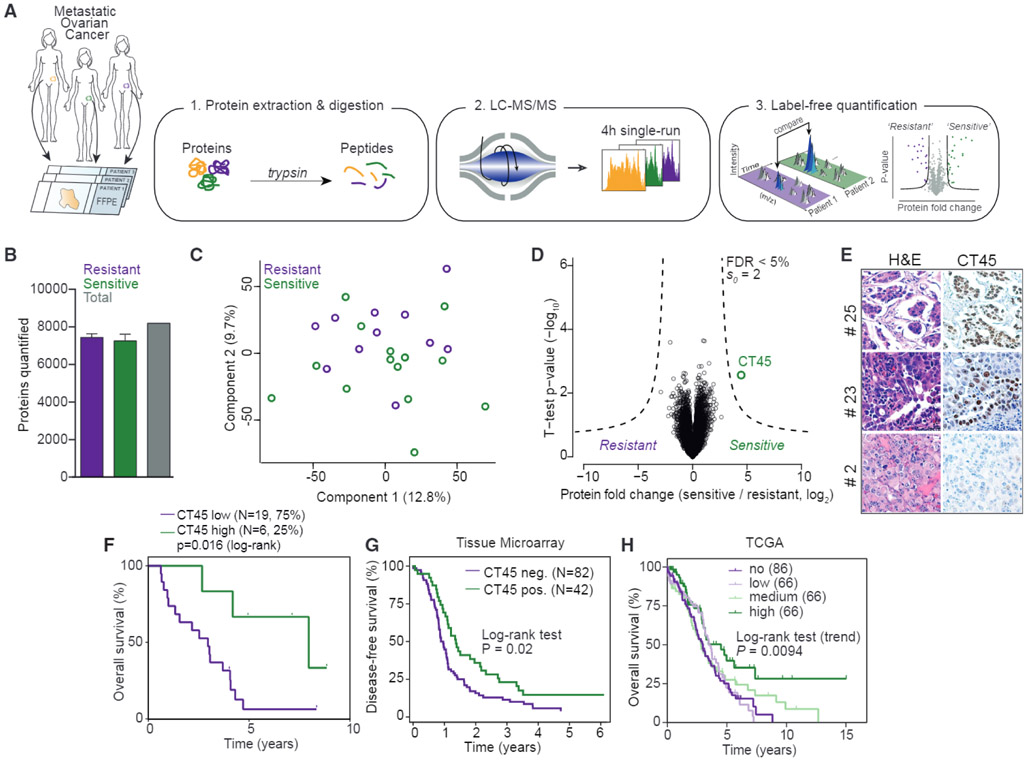
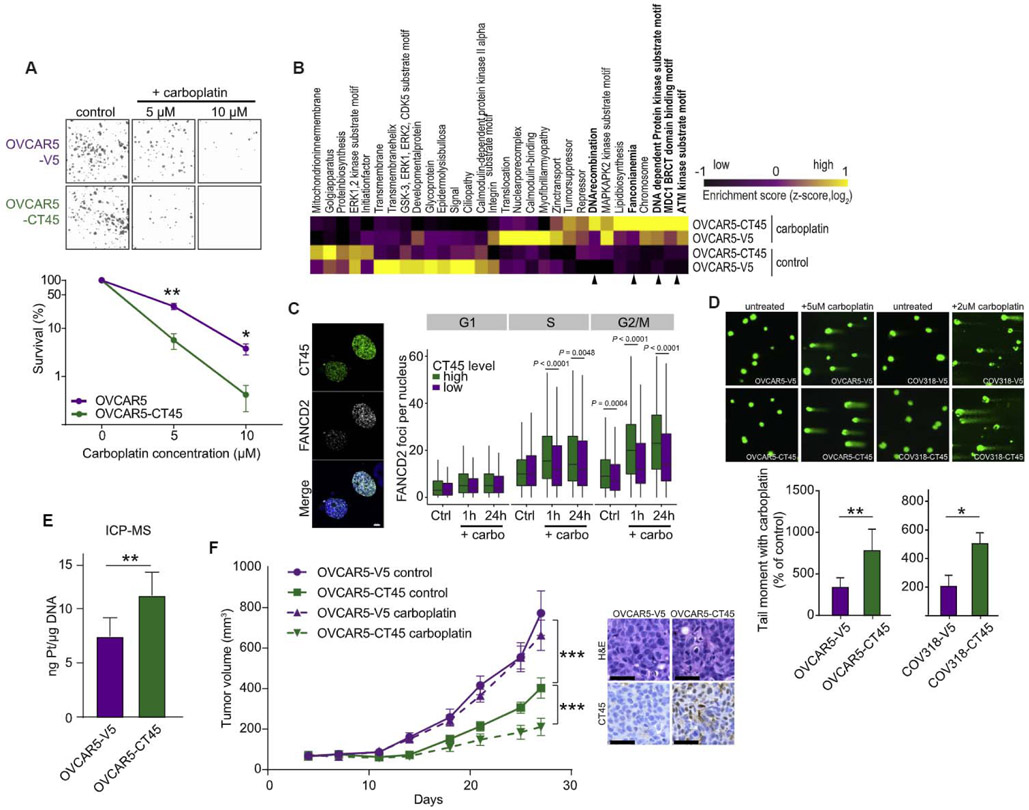
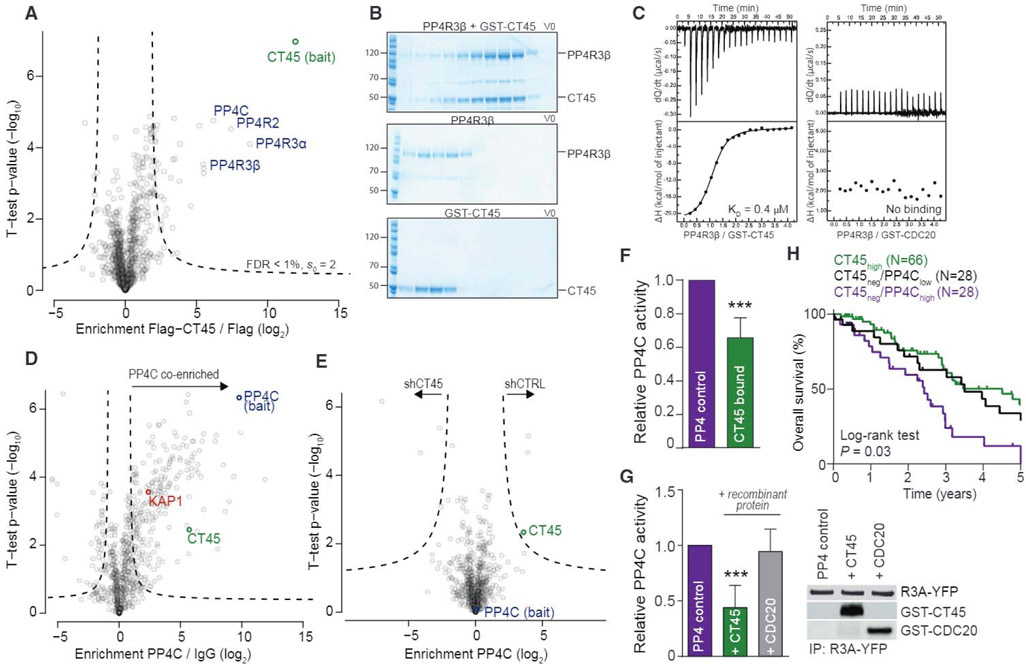
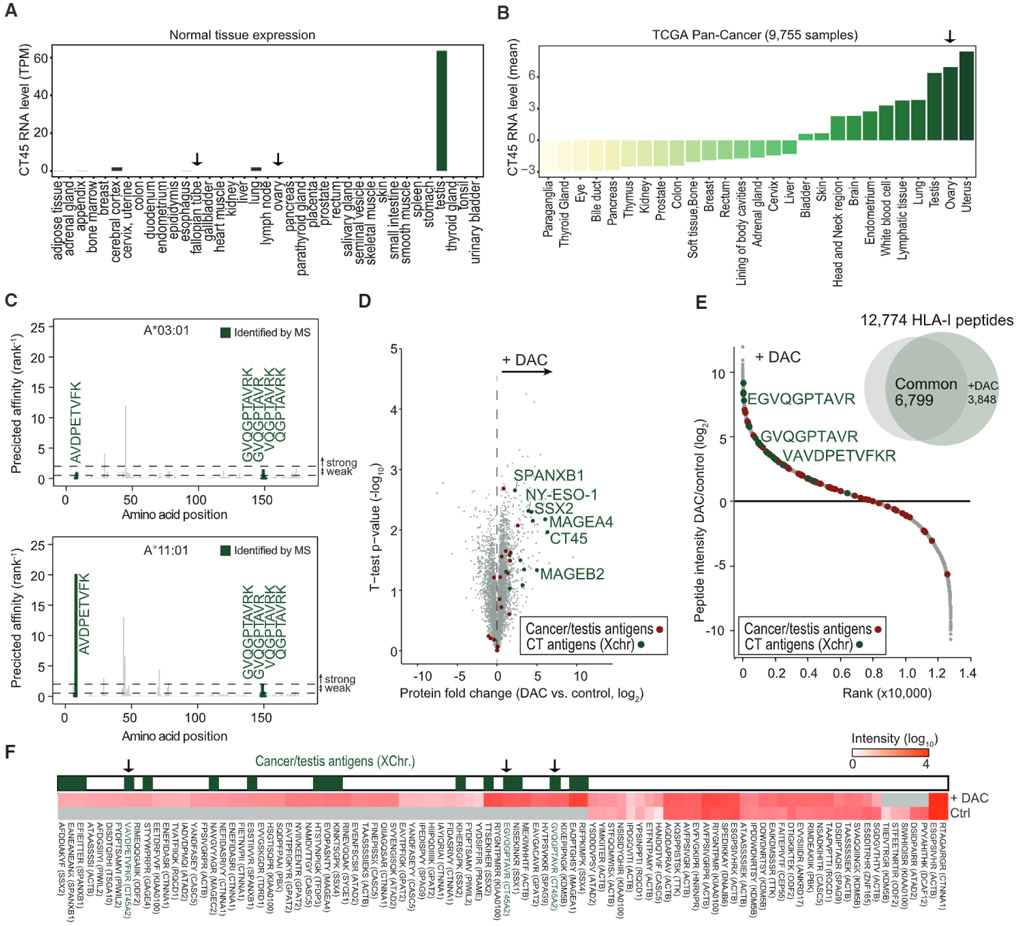
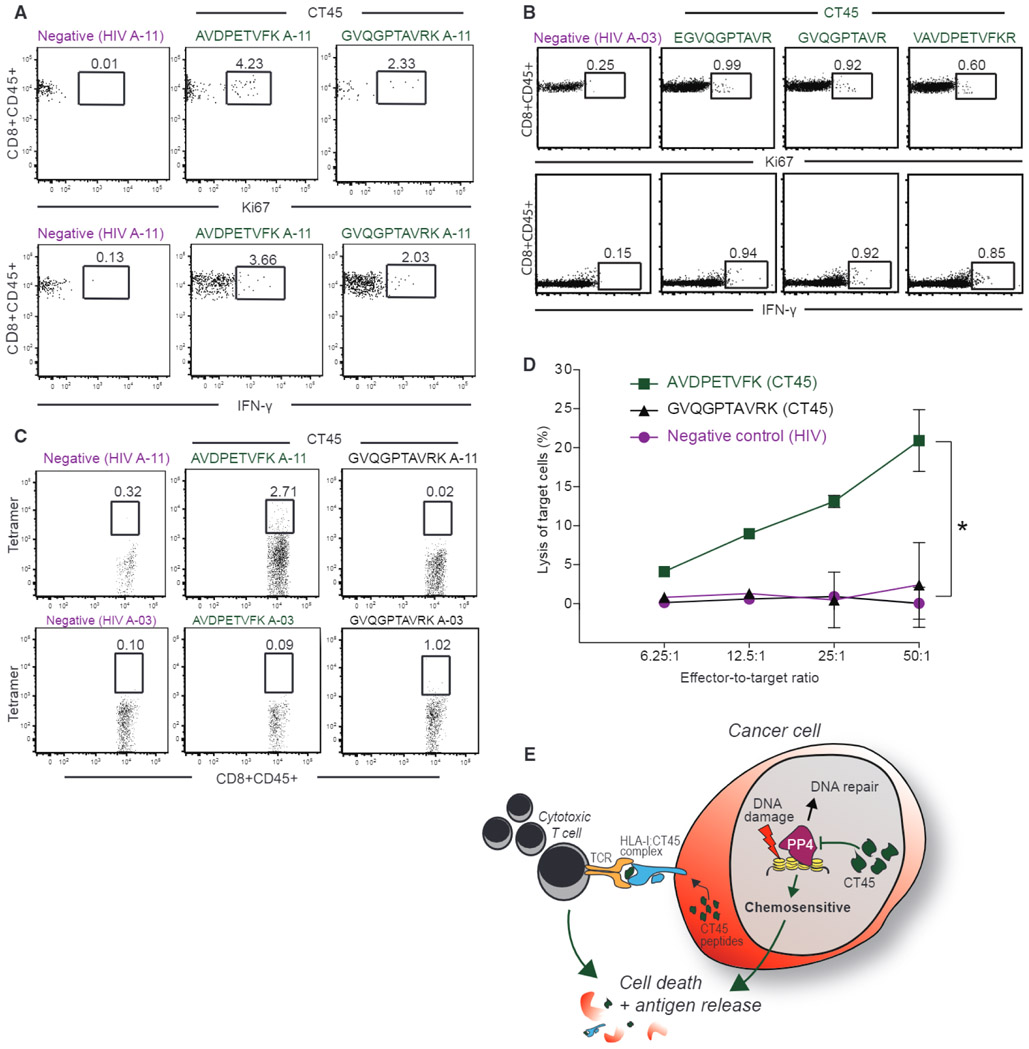
Most high-grade serous ovarian cancer (HGSOC) patients develop resistance to platinum-based chemotherapy and recur, but 15% remain disease free over a decade. To discover drivers of long-term survival, we quantitatively analyzed the proteomes of platinum-resistant and -sensitive HGSOC patients from minute amounts of formalin-fixed, paraffin-embedded tumors. This revealed cancer/testis antigen 45 (CT45) as an independent prognostic factor associated with a doubling of disease-free survival in advanced-stage HGSOC. Phospho- and interaction proteomics tied CT45 to DNA damage pathways through direct interaction with the PP4 phosphatase complex. In vitro, CT45 regulated PP4 activity, and its high expression led to increased DNA damage and platinum sensitivity. CT45-derived HLA class I peptides, identified by immunopeptidomics, activate patient-derived cytotoxic T cells and promote tumor cell killing. This study highlights the power of clinical cancer proteomics to identify targets for chemo- and immunotherapy and illuminate their biological roles.


Conflict of interest statement

DECLARATION OF INTERESTS

For authors F.C., E.L., M.M., and M.C., the University of Chicago and the Max Planck Society have jointly filed a patent application related to this technology.

Figures

Figure 1.
Figure 1.. Proteomics Identifies CT45 Expression to Predict Long-Term Survival in HGSOC
(A) Summary of the shotgun proteomics workflow applied to FFPE tumors from ovarian cancer patients. Following tissue lysis and homogenization, purified proteins were digested and analyzed in single-run high-performance liquid chromotography (HPLC)-MS using a quadrupole Orbitrap mass spectrometer. Data were analyzed and quantified in MaxQuant (Cox et al., 2014; Cox and Mann, 2008). (B) Number of quantified proteins from chemotherapy-resistant (n = 11) and -sensitive (n = 14) tumors. Error bars show standard deviation for each group. (C) Grouping of chemotherapy-resistant and -sensitive tumor proteomes by PCA. Component 1 accounts for 12.8% of total data variability and component 2 accounts for 9.7%. (D) Volcano plot of chemotherapy-resistant versus -sensitive tumor proteomes. Expression fold changes are plotted against the t test p value (−log10). Dashed lines indicate the significance threshold (FDR < 0.05, s0 = 2). CT45 is highlighted in green. Chemoresistant patients were defined as those with less than 6 months disease-free survival from the date of last treatment to recurrence, and sensitive patients were defined as those with more than 12 months disease-free survival from the date of last treatment to recurrence. (E) Immunohistochemistry for CT45 and corresponding H&E staining in serial tumor sections from three representative patients. (F) Kaplan-Meier survival analysis (log-rank test) of overall survival based on CT45 protein levels in the proteomics dataset. The patients with the highest CT45 expression (top 25%, n = 6, green, median overall survival = 95.4 months) are compared to the lower 75% (n = 19, purple, median overall survival = 35.4 months). (G) Kaplan-Meier analysis of disease-free survival based on CT45 staining of HGSOC TMAs. Advanced-stage HGSOC patients with a staining score of 0 (n = 82) versus 1+ (n = 42) are compared. (H) Kaplan-Meier survival analysis based on CT45 RNA levels in 284 HGSOC patients from TCGA (p = 0.0094, log-rank test for trend, IlluminaHiseq BC dataset) (Cancer Genome Atlas Research Network, 2011). See also Figure S1 and Tables S1, S2, S3, and S4.
Figure 2.
Figure 2.. CT45 Enhances Sensitivity to Chemotherapy
(A) Clonogenic survival assay of the ovarian cancer cell line OVCAR-5 stably overexpressing CT45 (green) or control vector (purple) after carboplatin (5μM and 10 μM) treatment. Mean values are shown from three independent experiments. Error bars show SEM for each group (*p < 0.05, **p < 0.01). Representative images are shown above bars. (B) Phosphoproteomic analysis of the OVCAR-5 cell line pair ± 5 μM carboplatin treatment. Differentially regulated pathways are plotted as heatmap. Relative enrichment scores indicate upregulated (yellow) and downregulated (black) pathways across samples. Scores represent Z-scored median values from quadruplicate measurements. Arrows indicated DNA damage and repair pathways. (C) Quantification of the cell-cycle distribution of FANCD2 foci per nucleus in untreated (Ctrl)- and carboplatin (carbo)-treated (1 hr and 24 hr) high (green)- or low (purple)-CT45-expressing 59M cells derived from the quantitative image-based cytometry (QIBC) analysis. Representative images of the staining are shown for platinum-treated cells. (D) DNA damage was detected following carboplatin treatment at day 5 using a comet assay, which evaluates double- and single-strand breaks. Data are means ± SEM of four independent replicates (bottom). The tail length correlates to DNA damage. Representative images of comet assays are shown. OVCAR-5 cells were treated with 5μM carboplatin, and COV318 were treated with 2 μM carboplatin. (E) Platinum content in genomic DNA isolated from OVCAR5-V5 and OVCAR5-CT45 cells treated with carboplatin (day 3) quantified using inductively coupled plasma MS (ICP-MS). Values are mean ± SEM from five biological replicates. **p < 0.01. (F) Left: subcutaneous growth of OVCAR5-V5 (control plasmid) and OVCAR5-CT45 tumors in mice (n = 5–8) during treatment with carboplatin. Data are means ± SEM for each group. Right: immunohistochemistry for CT45 and corresponding H&E staining in OVCAR5-V5 (control plasmid) and OVCAR5-CT45 mouse tumors. Scale bar: 50 μM. See also Figure S2.
Figure 3.
Figure 3.. CT45 Is an Inhibitory PP4 Interactor Impacting on DNA Damage Signaling
(A) Interaction proteomics screen in OVCAR-5 cells stably overexpressing FLAG-tagged CT45. Protein enrichment (t test difference) was calculated over the corresponding control cell line (FLAG tag alone) and plotted against the t test p value (−log10). Dashed lines indicate significance thresholds. The bait protein CT45 (green) and members of the PP4 complex (blue) are highlighted. Results represent three replicates per experiment group with p < 0.01. (B) Gel filtration of recombinant PP4R3β and GST-CT45. PP4R3β and GST-CT45 were incubated for 10 min on ice and loaded onto a Superdex 200 column (top) or run individually (middle: PP4R3β, bottom: GST-CT45). (C) ITC measurements of the binding of PP4R3β to GST-CT45 (left) or GST-CDC20 (right). Binding affinity (KD) for PP4R3β/GST-CT45 was 0.37 μM ± 0.03. No binding was observed for PP4R3β/GST-CDC20. (D) Volcano plot of ChIP-MS results for PP4C-enriched chromatin in the 59M cell line. Fold enrichment (log2) of PP4C versus immunoglobulin G (IgG) control is plotted against the t test p value (−log10). Dashed lines indicate significance thresholds (FDR < 0.05, s0 = 1). The bait protein PP4C is highlighted in blue, CT45 is in green, and the known PP4 interactor and substrate, KAP1, is in red. (E) Volcano plot of ChIP-MS results for PP4C-enriched chromatin in stable CT45 knockdown 59M cells. Fold enrichment (log2) of the PP4C interactome in shCT45 versus shCTRL cells is plotted against the t test p value (−log10). Dashed lines indicate significance thresholds (FDR < 0.05, s0 = 1). The bait protein PP4C is highlighted in blue, and CT45 is in green. (F) Phosphatase activity assay of the immunopurified PP4 complex in OVCAR-5 cells expressing a control vector or CT45. Quantification results represent the average of five independent experiments with t test p < 0.001. Error bars show standard deviation for each group. (G) Phosphatase activity assay of the immunopurified PP4 complex in the presence or absence of 3 μM recombinant GST-CT45 or GST-CDC20 control protein. Quantification results (left) represent the average of five independent experiments with t test p < 0.001. Western blot (right) is shown as loading control. (H) Kaplan-Meier survival analysis based on PP4C mRNA levels in the CT45 negative patient group of Figure 1H. Low PP4C levels in the tumor (lowest 33%, n = 28, black line) predicted significantly increased overall survival (p = 0.03) as compared to high PP4C levels (top 33%, n = 28, purple line). Patients with high CT45 expression (green line) are plotted for relative comparison. See also Figures S2 and S3.
Figure 4.
Figure 4.. CT45 Is a Native Tumor Antigen Regulated by DNA Methylation
(A) RNA levels of CT45 in normal tissues from the Human Protein Atlas (Uhlén et al., 2015). RNA level (transcripts per million) of the CT45 family members A1–A10 are plotted as combined average expression for each tissue. Fallopian tube and ovary are designated by an arrow. (B) RNA levels of CT45 in cancer tissues (TCGA Pan-Cancer) (Cancer Genome Atlas Research Network et al., 2013). RNA levels (mean centered) of the detected CT45 family members A1–A6 are plotted as combined average expression for each cancer type. Ovarian cancer is highlighted by an arrow. (C) Predicted binding affinities for HLA class I peptides of CT45 with a length of 8–11 amino acids. Top: affinities for A*03:01. Bottom: affinities for A*11:01. Affinities are plotted on the y axis as % rank 1. Weak affinity cutoff: % rank < 2; high-affinity cut-off: % rank < 0.5. Peptides identified by MS are highlighted in green. (D) Volcano plot of the proteomic comparison between DAC-treated and control SKOV3ip1 ovarian cancer cells. Protein fold change (t test difference, log2) is plotted against the t test p value (−log10). CTAs, including CT45, are highlighted. (E) HLA-I peptide intensity ratio from immunopeptidomics of DAC-treated versus control SKOV3iP1 ovarian cancer cells plotted against the ranked peptide ratio. CT45 peptides are highlighted in green. (F) Heatmap of CTA peptide presentation after treatment with DAC versus control (Ctrl). HLA-I peptides between 9 and 11 amino acids are plotted. CTAs encoded on the X chromosome are highlighted in green. CT45-derived HLA-I peptides are indicated with an arrow. See also Figures S4 and S5 and Table S5.
Figure 5.
Figure 5.. CT45 Peptides Activate Patient-Derived Cytotoxic T Cells
(A) Staining for Ki-67 and intracellular IFN-γ of A-11:01 CD8+ T cells after stimulation with two CT45 peptides (AVDPETVFK and GVQGPTAVRK) or one HIV negative control peptide analyzed by flow cytometry. (B) Staining for Ki-67 and intracellular IFN-γ of A-03:01 CD8+ T cells after stimulation with three different CT45 peptides (EGVQGPTAVR, GVQGPTAVR, and VAVDPETVFKR) or HIV-negative control peptide analyzed with flow cytometry. (C) Tetramer staining of A-11:01 or A-03:01 CD8+ T cells with two CT45 PE-labeled tetramers (AVDPETVFK and GVQGPTAVRK) and one HIV-negative control PE-labeled tetramer analyzed by flow cytometry. (D) Lysis of HLA-A11:01 positive 59M cell line by CD8+ effector T cells (A-11:01) at indicated effector: target ratios using a chromium release assay. Data are means ± SD from two independent experiments. (E) Proposed model of CT45 mediated chemosensitivity and long-term survival in metastatic HGSOC.

References

    1. Aebersold R, and Mann M (2016). Mass-spectrometric exploration of proteome structure and function. Nature 537, 347–355. - PubMed
    1. Anderson NL, Ptolemy AS, and Rifai N (2013). The riddle of protein diagnostics: future bleak or bright? Clin. Chem 59, 194–197. - PubMed
    1. Andreatta M, and Nielsen M (2016). Gapped sequence alignment using artificial neural networks: application to the MHC class I system. Bioinformatics 32, 511–517. - PMC - PubMed
    1. Andreatta M, Lund O, and Nielsen M (2013). Simultaneous alignment and clustering of peptide data using a Gibbs sampling approach. Bioinformatics 29, 8–14. - PubMed
    1. Bassani-Sternberg M, Pletscher-Frankild S, Jensen LJ, and Mann M (2015). Mass spectrometry of human leukocyte antigen class I peptidomes reveals strong effects of protein abundance and turnover on antigen presentation. Mol. Cell. Proteomics 14, 658–673. - PMC - PubMed

Publication types

MeSH terms