. 2018 Sep 20;175(1):43-56.e21.
doi: 10.1016/j.cell.2018.07.029.

Identification of the Human Skeletal Stem Cell

Affiliations

Identification of the Human Skeletal Stem Cell

Charles K F Chan et al. Cell. .

Abstract

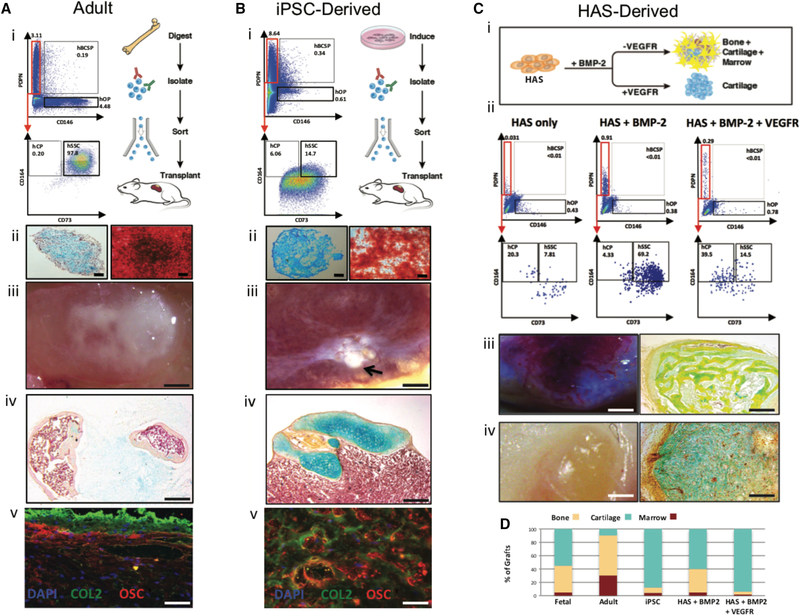
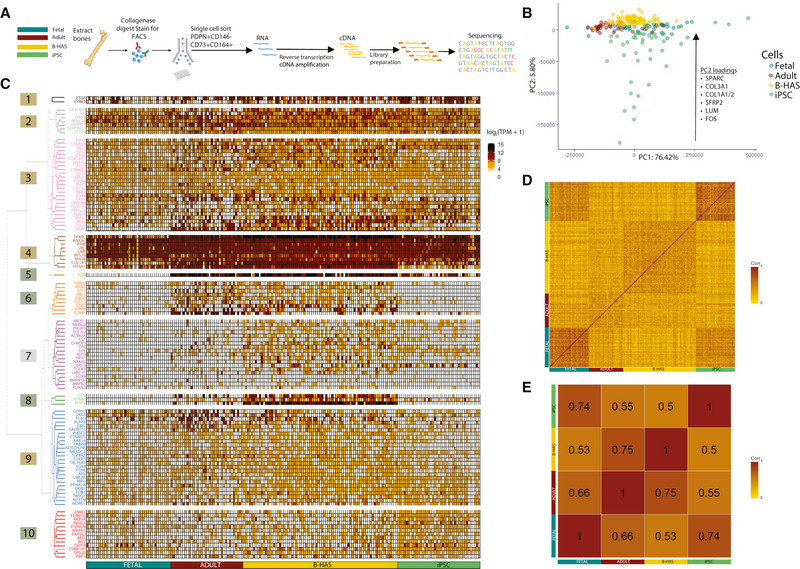
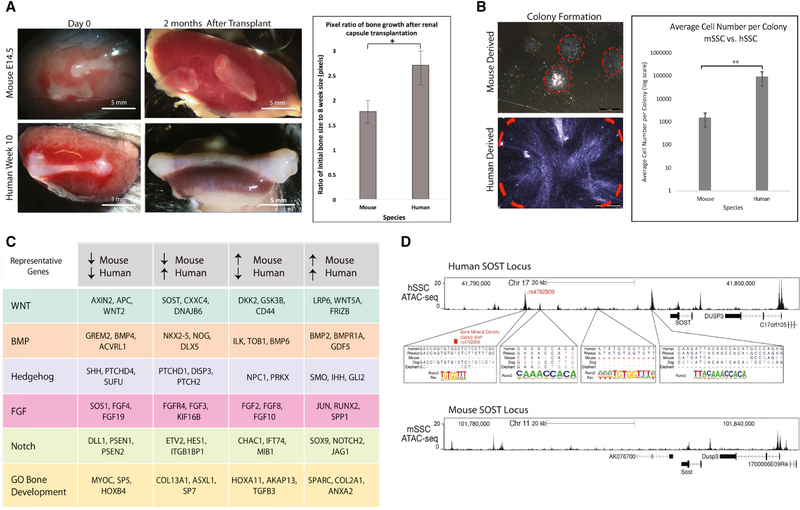
Stem cell regulation and hierarchical organization of human skeletal progenitors remain largely unexplored. Here, we report the isolation of a self-renewing and multipotent human skeletal stem cell (hSSC) that generates progenitors of bone, cartilage, and stroma, but not fat. Self-renewing and multipotent hSSCs are present in fetal and adult bones and can also be derived from BMP2-treated human adipose stroma (B-HAS) and induced pluripotent stem cells (iPSCs). Gene expression analysis of individual hSSCs reveals overall similarity between hSSCs obtained from different sources and partially explains skewed differentiation toward cartilage in fetal and iPSC-derived hSSCs. hSSCs undergo local expansion in response to acute skeletal injury. In addition, hSSC-derived stroma can maintain human hematopoietic stem cells (hHSCs) in serum-free culture conditions. Finally, we combine gene expression and epigenetic data of mouse skeletal stem cells (mSSCs) and hSSCs to identify evolutionarily conserved and divergent pathways driving SSC-mediated skeletogenesis. VIDEO ABSTRACT.

Keywords: ATAC-sequencing; HSC; and stromal progenitor; bone; bone fracture repair; bone marrow niche; cartilage; human skeletal stem cell; single cell RNA-sequencing.


Conflict of interest statement

Declaration of Interests

Patent is pending for the isolation, derivation, and use of human skeletal stem cells and downstream skeletal progenitors.

Figures

Figure 1.
Figure 1.. Single-cell analysis of skeletal growth plate zones.
A) A representative cross-section of a femur from an adult (8–12 weeks-old) Actin-CreER X Rainbow mouse showing sites of clonal skeletogenesis in the growth plate (left). Scale: 500 μm. Homologous regions are shown in cross-section of a femoral head from a 17-week-old human fetus stained with Movat’s pentachrome (MP) (right). Scale: 2 mm. B) Longitudinal cross-section of a femurhead from a 17-week-old human fetus stained with MP (left) alongside a magnified view of the growth plate (middle); yellow: bone, blue: cartilage, purple: marrow. Diagram of morphologically distinct zones in the growth plate of 17-week-old human fetal bone; P: proliferative zone, p-H: pre-hypertrophic zone, H: hypertrophic zone, D: diaphyseal zone (right). Scale: 100 μm. C) Whole tissue stain of a viable 17-week-old human fetal femur with Hoechst and Calcein-AM intravital dyes (top; scale: 5 mm) revealing morphologically distinct regions (bottom; scale: 500 μm) corresponding to the six growth plate zones (P1, P2, p-H1, p-H2, H1, and H2) and the diaphyseal zone (D). D) Experimental strategy for identifying human SSCs using scRNA-seq and a database of conserved SSC-specific genes. E) Heatmap of most variable genes detected by scRNA-seq analysis of cells isolated from dissected human growth plate zones as shown in C. F) Bar chart showing percent of human orthologs to mSSC/mBCSP-specific genes expressed in human CD45-CD235a- single cells for each zone described in C. Red trendline shows percent enrichment. Statistical significance for zones with highest enrichment for human orthologs to mSSC/BCSP-specific genes was calculated by one-way ANOVA with post-hoc Tukey HSD test with proliferative 1 (P1) as reference at an α-level of 0.01 (left). **p-value<0.005, ****p-value<0.0005; ns: not significant. Average transcripts per million (TPM) for five surface markers identified by scRNA-seq-enrichment-screen followed by empirical testing by FACS: PDPN, CD146 (MCAM), CD73 (NT5E), CD164, and THY1 (right). n=4.
Figure 2.
Figure 2.. Prospective isolation of PDPN+CD146-CD73+CD164+ hSSCs.
A) Experimental strategy for isolation and in vivo functional characterization of hSSCs and progenitors by transplantation beneath the renal capsules of immunodeficient NSG mice. n=12. B) Gating scheme for the isolation of distinct skeletal populations based on the varying expression of CD45, CD235, TIE2, CD31, PDPN, CD146, CD73, and CD164 using FACS. C) MP stain of explanted human skeletal progenitor-derived grafts one month after subcapsular transplant into NSG mice; yellow: bone, blue: cartilage, purple: marrow. Stained cross-sections of the grafts that were derived from (a) PDPN-CD146+THY1+, (b) PDPN-CD146+THY1-, (c) PDPN+CD146-CD73+CD164+, (d) PDPN+CD146lo, (e) PDPN+CD146-CD73-CD164-, (f) PDPN+CD146-CD73-CD164+, and (g) PDPN+CD146-CD73+CD164- cells, respectively. Scale: 200 μm. D) Images showing immunohistochemical (IHC) staining for human nuclear antigen in (i) adjacent tissue cross-section as seen in C-a, and (ii) adjacent tissue cross-section as seen in C-c. Scale: 200 μm. E) Quantification of skeletal fates derived from populations C-a–f by morphometric analysis of histological specimens. F) Representative FACS plots of primary colonies derived from a single PDPN+CD146-CD73+CD164+ cell (top), and secondary and tertiary colonies derived from a re-isolated single PDPN+CD146-CD73+CD164+ cell from the primary colony (bottom). G) Phase contrast images showing primary, secondary, and tertiary PDPN+CD146CD73+CD164+ colonies. Scale: 100 μm. H) IHC staining for nuclei with DAPI and cartilage and bone with anti-Collagen II (COL2), and anti-Osteocalcin (OSC) antibodies, respectively, in secondary colonies derived from a single, primary PDPN+CD146-CD73+CD164+ cell. Scale: 100 μm; n=3.
Figure 3.
Figure 3.. Determination of hSSC lineage hierarchy.
A) Experimental strategy for in vitro characterization of lineage progression of putative hSSCs (PDPN+CD146-CD73+CD164+) and other human skeletal progenitor subsets. n=5. B) Representative FACS plots showing differentiation of cultured PDPN+CD146-CD73+CD164+hSSCs into lineage-restricted subsets from day 0, 7, and 14. C) Alizarin Red S staining of individual human skeletal progenitor subsets to measure osteogenicity [ i) hSSC: human skeletal stem cell; ii) hBCSP: human bone, cartilage, and stromal progenitor cell; iii) hOP: human osteogenic progenitor; iv) hCP: human chondrogenic progenitor]. Scale: 200 μm. D) Experimental strategy for in vivo determination of hSSC lineage potential (top). Freshly isolated hSSCs were transplanted under the renal capsules of NSG mice, explanted after 4 weeks of development, dissociated to single-cell suspension and analyzed. FACS plot showing different skeletal populations within the dissociated primary graft including hSSC (blue box), hBCSP, hOP, and hCP all derived from originally transplanted fetal hSSC (bottom). E) Experimental strategy for random red-green-blue (RFP, EGFP, CFP) lentiviral labeling and in vivo clonal expansion of the labeled hSSCs (left). MP-stained sections of kidney grafts derived from the labeled-hSSCs 4 weeks after transplantation (middle). Fluorescent images of the adjacent sections of the same grafts showing clonal expansion of single color skeletal cells derived from a single-color-labeled hSSC (right). Individual EGFP and RFP labeled clones are shown. Scale: 100 μm. F) Lineage map of hSSC and downstream skeletal progenitors. h-pre-BCSP: pre-bone, cartilage and stromal progenitor cell.
Figure 4.
Figure 4.. Osteogenic hSSCs are locally amplified in response to skeletal injury.
A) Injured (n=10) and uninjured (n=3) human bone-specimens were obtained and hSSCs were isolated. Uninjured age group: 16–30 years-old (yo); injured age groups: young: 20–40 yo (n=3), middle-aged: 41–70 yo (n=3), and aged: 71–90 yo (n=4) (left-right). Cells were isolated by FACS (top left and right), plated, differentiated, and stained using Alizarin Red. Brightfield and corresponding Alizarin Red stained images are shown in bottom left and bottom right panels, respectively. Scale: 100 μm. B) Postnatal day 5 NSG mouse pup host (top left). Phalanx of 18-week-old human fetus (top right). Human fetal phalanges from 18-week-old fetuses were transplanted subcutaneously under the dorsum of day 5 NSG mouse pups. Fractures were introduced at 4 weeks post-transplantation (middle left and right panels) within the engrafted human phalanx (PP: proximal phalanx, MP: middle phalanx, DP: distal phalanx; defect indicated by black circle in MP region). After a further 2 weeks post-injury the phalanges were explanted for analysis (n=12). For both uninjured and injured samples, explants were digested, hSSC were purified by FACS, plated, differentiated for 2 weeks, and then stained using Alizarin Red (bottom). C) Comparison of uninjured (left) and injured (right) human xenografts. Each panel shows the corresponding FACS plots with gating strategy to isolate hBCSPs and hSSCs (top). Purified hBCSPs and hSSCs were plated, differentiated for 2 weeks, and stained using Alizarin Red (bottom). Scale: 100 μm. D) Bar chart showing the effect of injury on the hSSC populations in both the primary human samples (top) (uninjured, n=3; injured, n=10) and the human xenograft model (n=12) (bottom). <0.05, **p<0.01.
Figure 5.
Figure 5.. PDPN+146-CD73+CD164+ expression identifies hSSC from other tissue sources.
A) Isolation of hSSCs from adult human femoral tissue. (i) Experimental strategy (right) and representative FACS plots (left) showing gating scheme for isolation of hSSCs from adult human femurhead tissue (n=6). (ii) Alcian blue stain showing cartilage tissue in a cross-section of micro-mass generated by adult hSSCs after differentiation in vitro (left). Scale: 500 μm. Alizarin Red stain showing bone tissue (osteoblasts) generated by adult hSSCs after differentiation in vitro (right). Scale: 100 μm. (iii) Image of ossicle formed 4 weeks after transplant of 100,000 hSSCs isolated in A-(i) under the renal capsule of NSG mice. Scale: 2 mm. (iv) MP stain of a cross-section of the ossicle shown in A-(iii). Scale: 500 μm. (v) IHC staining of a cross-section of the ossicle shown in A-(iii) for nuclei with DAPI and cartilage, and bone with anti-Collagen II (COL2), and anti-Osteocalcin (OSC) antibodies, respectively. Scale: 100 μm; n=6. B) Isolation of hSSCs after skeletal induction of human monocyte-derived iPSCs. (i) Experimental strategy (right) and representative FACS plots (left) showing gating strategy for the isolation of hSSCs 2 weeks after skeletal induction of the iPSCs. (ii) Alcian blue stain showing cartilage in a cross-section of micro-mass generated 2 weeks after differentiation of iPSC-derived hSSCs in vitro (left). Scale: 500 μm. Alizarin Red S stain showing bone (osteoblasts) generated 2 weeks after differentiation of iPSC-derived hSSCs in vitro (right). Scale: 100 μm. (iii) Image of an ossicle formed 4 weeks after transplant of 100,000 hSSCs purified from skeletal induced iPSC cultures and then transplanted under the renal capsule of NSG mice. Scale: 2 mm. (iv) MP stain of a cross-section of the ossicle shown in B-(iii). Scale: 200 μm. (v) IHC stained image of a cross-section of the ossicle in B-(iii) for nuclei with DAPI and cartilage, and bone with anti-Collagen II (COL2), and anti-Osteocalcin (OSC) antibodies, respectively. Scale: 100 μm; n=6. C) Isolation of hSSCs from BMP2-treated human adipose stroma (B-HAS). (i) Experimental strategy for human adipose stroma (HAS) induction with either BMP2 alone or with co-delivery of BMP2 and sVEGFR. (ii) FACS analysis of HAS (left), HAS-derived ossicle after induction with BMP2 (middle), and HAS-derived cartilage after induction with BMP2 and sVEGFR (right). (iii) Image of a vascularized ossicle generated 4 weeks after subcutaneous transplantation of HAS treated with BMP2 in NSG mice (left). Scale: 2 mm. MP stain of a cross-section of the same ossicle (right). Scale: 200 μm. (iv) Image of cartilage mass formation lacking vascularization generated 4 weeks after subcutaneous transplantation of HAS treated with BMP2 and sVEGFR in NSG mice (left). Scale: 2 mm. MP stain of a cross-section of the same subcutaneous cartilaginous mass (right). Scale: 200 μm; n=6. D) Bar chart showing quantification of percent contribution by the different skeletal fates to total graft mass for grafts derived from fetal hSSCs, adult hSSCs, skeletal-induced-iPSC, B-HAS, or BMP2+sVEGFR-treated HAS after morphometric analysis.
Figure 6.
Figure 6.. Comparative scRNA-seq analysis of hSSCs derived from different sources.
A) Experimental strategy for scRNA-seq of fetal (blue), adult (brown), B-HAS-derived (yellow), and iPSC-derived (green) hSSCs. B) Unsupervised PCA of single hSSCs based on their expressed transcriptomes across principal component (PC) 1 and 2. Top gene loading contributors to the PC2 are listed along with the general direction of their eigenvectors. Colors of dots correspond to hSSC-source as in A. C) Heatmap showing gene expression (log2(TPM+1)) of known genes involved in canonical signaling and/or bone development pathways (Supplemental Table 3) in single fetal (n=42), adult (n=36), B-HAS-derived (n=77), and iPSC-derived hSSCs (n=41). The heatmap is grouped into 10 clusters obtained based on the expression patterns of the selected genes using Ward’s method. D) Pearson correlation matrix showing similarities between single fetal, adult, B-HAS-derived, and iPSC-derived hSSCs based on gene expression values as in B. Scale shows color gradient for R2 value from 0 to 1. E) Pearson correlation matrix with numerical coefficients showing degree of similarity between aggregate fetal, adult, B-HAS-derived, and iPSC-derived hSSC populations. Mean log2(TPM+1) was calculated separately for each group by calculating the sum of the log2(TPM+1) values for each gene in B and dividing the sum by the total number of cells in each group.
Figure 7.
Figure 7.. Convergent and divergent skeletal regulatory programs between mouse and human SSCs.
A) Renal capsule transplant of e14.5 mouse bones at day 0 (top left) and 10-week human fetal bones at day 0 (bottom left) in NSG mice. Images highlighting the resulting difference in size between the mouse (top middle) and human (bottom middle) bones after 2 months of growth in vivo. Scale: 5 mm; n=3. Pixels corresponding to the bone tissue in the images were measured and normalized to their respective pixel-counts at day 0 to calculate growth ratios, which are represented as bar chart (right). *p<0.05. B) Brightfield image of CFUs (red dashed line) that were formed after 2 weeks of culture of either e14.5 fetal mSSCs (top) or 10-week fetal hSSCs (bottom) highlighting the difference in their sizes. Scale: 1 mm. Bar chart showing the average number of cells per hSSC-derived and mSSC-derived colonies (right). Error bars: standard deviation; **p<0.01; n=5. C) Table listing shared and unshared representative genes and their expression trends (↑=upregulated, ↓=downregulated) between mouse and human focusing specifically on major signaling pathways and gene ontology (GO) gene set for bone development based on comparative microarray analysis of mSSCs (e17.5) and hSSCs (19-week) using the GEXC (n=3). D) UCSC genome browser track showing the ATAC-seq signal at the SOST locus in 18-week fetal hSSCs (top). Regions within four ATAC-seq peaks that contain RUNX-binding motifs are magnified. Mammalian conservation track from UCSC genome browser is shown for human, rhesus, mouse, dog, and elephant. RUNX2-binding motif (forward or reverse) found at each site is also shown (middle). Genome browser track showing ATAC-seq signal at the mouse Sost locus in e17.5 fetal mSSCs (bottom).

Comment in

References

    1. Baum CM, Weissman IL, Tsukamoto AS, Buckle AM, and Peault B (1992). Isolation of a candidate human hematopoietic stem-cell population. Proc Natl Acad Sci U S A 89, 2804–2808. - PMC - PubMed
    1. Bensidhoum M, Chapel A, Francois S, Demarquay C, Mazurier C, Fouillard L, Bouchet S, Bertho JM, Gourmelon P, Aigueperse J, et al. (2004). Homing of in vitro expanded Stro-1- or Stro-1+human mesenchymal stem cells into the NOD/SCID mouse and their role in supporting human CD34 cell engraftment. Blood 103, 3313–3319. - PubMed
    1. Beyth S, Schroeder J, and Liebergall M (2011). Stem cells in bone diseases: current clinical practice. Br Med Bull 99, 199–210. - PubMed
    1. Chan CK, Chen CC, Luppen CA, Kim JB, DeBoer AT, Wei K, Helms JA, Kuo CJ, Kraft DL, and Weissman IL (2009). Endochondral ossification is required for haematopoietic stem-cell niche formation. Nature 457, 490–494. - PMC - PubMed
    1. Chan CK, Lindau P, Jiang W, Chen JY, Zhang LF, Chen CC, Seita J, Sahoo D, Kim JB, Lee A, et al. (2013). Clonal precursor of bone, cartilage, and hematopoietic niche stromal cells. Proc Natl Acad Sci U S A 110, 12643–12648. - PMC - PubMed

Publication types