. 2018 Oct 17;84(21):e01525-18.
doi: 10.1128/AEM.01525-18. Print 2018 Nov 1.

Dietary Fatty Acids Sustain the Growth of the Human Gut Microbiota

Affiliations

Dietary Fatty Acids Sustain the Growth of the Human Gut Microbiota

Richard Agans et al. Appl Environ Microbiol. .

Abstract

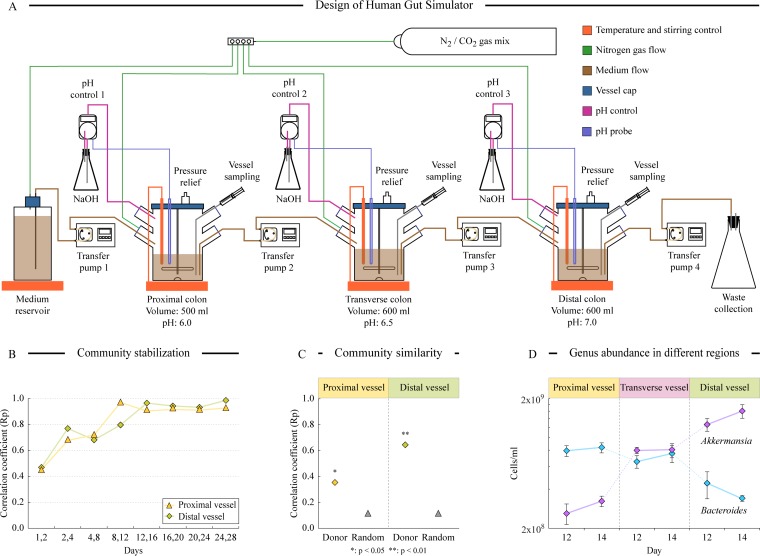
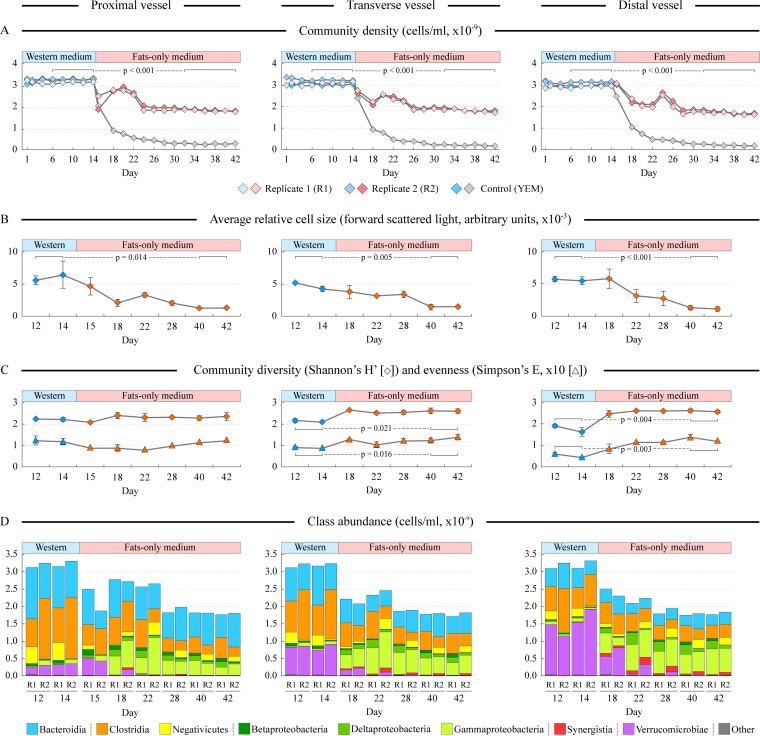
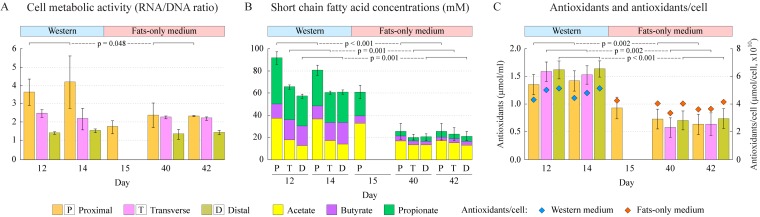
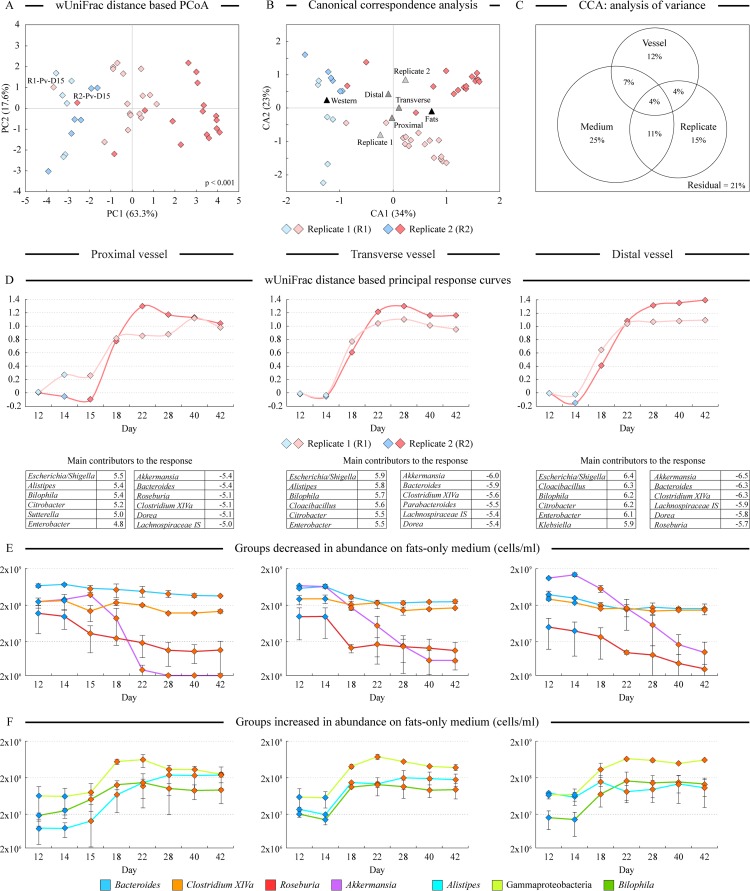
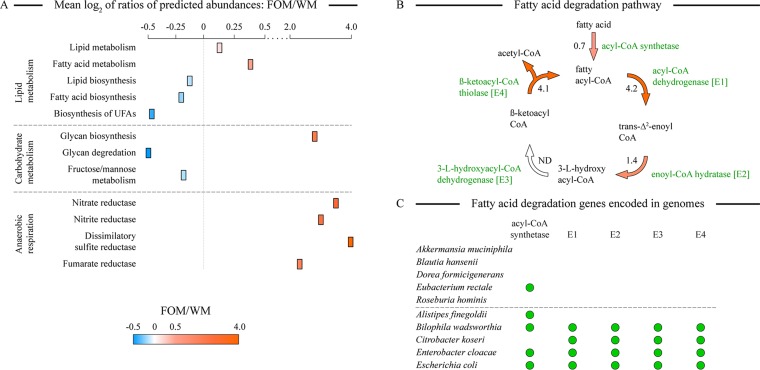
While a substantial amount of dietary fats escape absorption in the human small intestine and reach the colon, the ability of resident microbiota to utilize these dietary fats for growth has not been investigated in detail. In this study, we used an in vitro multivessel simulator system of the human colon to reveal that the human gut microbiota is able to utilize typically consumed dietary fatty acids to sustain growth. Gut microbiota adapted quickly to a macronutrient switch from a balanced Western diet-type medium to its variant lacking carbohydrates and proteins. We defined specific genera that increased in their abundances on the fats-only medium, including Alistipes, Bilophila, and several genera of the class Gammaproteobacteria In contrast, the abundances of well-known glycan and protein degraders, including Bacteroides, Clostridium, and Roseburia spp., were reduced under such conditions. The predicted prevalences of microbial genes coding for fatty acid degradation enzymes and anaerobic respiratory reductases were significantly increased in the fats-only environment, whereas the abundance of glycan degradation genes was diminished. These changes also resulted in lower microbial production of short-chain fatty acids and antioxidants. Our findings provide justification for the previously observed alterations in gut microbiota observed in human and animal studies of high-fat diets.IMPORTANCE Increased intake of fats in many developed countries has raised awareness of potentially harmful and beneficial effects of high fat consumption on human health. Some dietary fats escape digestion in the small intestine and reach the colon where they can be metabolized by gut microbiota. We show that human gut microbes are able to maintain a complex community when supplied with dietary fatty acids as the only nutrient and carbon sources. Such fatty acid-based growth leads to lower production of short-chain fatty acids and antioxidants by community members, which potentially have negative health consequences on the host.

Keywords: Western diet; dietary fats; microbial digestion; microbiota; nutrition.


Figures

FIG 1
FIG 1
Design of human gut simulator (HGS) and validation of its performance. (A) Schematic representation of HGS design. (B) Results of the TRFLP analysis of community genomic DNA isolated from proximal and distal vessels on different days after the initialization of the system. Each point represents a Pearson correlation coefficient (Rp) between TRFLP profiles of two consecutive time points. (C) Similarities (Rp values) of HGS community (day 28) to those of the donor fecal sample and fecal sample from a random human volunteer. (D) Abundances of two prominent human gut microbiota genera in different vessels. Note that cell density is shown on a log10 scale (y axis). Error bars represent standard deviation of measurements between two runs.
FIG 2
FIG 2
Dynamic changes in community density and composition during switch of the supplied medium. Different columns represent data for proximal, transverse, and distal vessels, as shown. The medium was switched from a medium resembling a balanced Western diet to fats-only medium after taking samples on day 14. In a control run, YEM containing only yeast extract and salts was used on days 15 to 42. (A) Cell density in each vessel. (B) Average relative cell size as measured by forward light scatter in flow cytometry analysis. (C) Calculations of genus-level based community diversity and evenness. Error bars in panels B and C represent standard deviations of measurements between two replicate runs. (D) Cumulative abundance of different bacterial classes at each time point. R1 and R2 represent individual replicate runs. Where shown, P values indicate statistically significant differences of the measured values between Western and fats-only media, as tested by repeated-measures ANOVA.
FIG 3
FIG 3
Metabolic profiling of HGS communities. (A) Average cell metabolic activity as measured by the ratio of total RNA to total DNA in cells. (B) Concentrations of the most abundant short-chain fatty acids. (C) Total antioxidant capacity (defined as equivalent to micromoles Trolox standard; shown on left-hand y axis) and antioxidant capacity per cell (shown on right-hand y axis) in different vessels. Error bars represent the standard deviation of measurements between two replicate runs; in panel B, only errors for the total amount of measured SCFAs are shown. Note that on day 15, samples were only taken from the proximal vessel because the change of the supplied medium would not have yet impacted the other two vessels. Statistically significant differences (P < 0.05, repeated-measures ANOVA) of the measured values between Western and fats-only media are indicated by connecting bars; P values in panel B indicate statistical significance of the total SCFA differences between conditions.
FIG 4
FIG 4
Analysis of community composition. (A) Output of the unconstrained principal-coordinate analysis (PCoA) of genus abundance data set among all profiled samples. Phylogenetic weighted UniFrac (wUniFrac) distance was used to calculate sample dissimilarity matrix. Blue points represent samples collected when supplying Western medium; red points represent samples collected after the switch to fats-only medium. Day 15 samples taken from the proximal vessel (Pv) are highlighted. P value denotes statistical significance of the separation of WM and FOM samples in PCoA space based on the permutation analysis of Davies-Bouldin index. (B) Output of the constrained canonical correspondence analysis (CCA). Medium type, vessel identity, and replicate run were used as explanatory variables that constrained the variability of the genus abundance data set. (C) The analysis of variance of the CCA output depicts the relative contributions of explanatory variables to the overall variability in the data set. (D) Results of weighted UniFrac distance-based principal response curves (PRC) analysis. Community composition at day 12 was set as the baseline and was compared to the composition at every other time point. Larger values on the y axis represent a greater shift in the community structure than that of day 12. The main drivers of the observed changes in the composition are shown in the tables. Positive numbers represent members that increased in their abundance after medium switch; genera with negative weights represent members that decreased the most in their abundance on fats-only medium. (E and F) The abundances of several of these genera at different time points. Note that cell density is shown on log10 scale (y axis). Error bars represent standard deviation of measurements between two runs.
FIG 5
FIG 5
Analysis of predicted functional capacities of microbial communities. (A) Log2-transformed ratios of predicted cumulative functional gene abundances for lipid and carbohydrate metabolism and anaerobic respiration between communities maintained on fats-only medium (FOM) and Western medium (WM). (B) Predicted log2-transformed abundance ratios (FOM/WM) for the genes encoding the enzymes of fatty acid β-oxidation pathway. Arrows and rectangles are colored according to the abundance ratio color gradient, as shown in the legend. UFAs, unsaturated fatty acids; ND, not determined. (C) Predicted presence of β-oxidation pathway-encoding genes in genomes of microbes that either decreased (top) or increased (bottom) in abundance upon the WM-to-FOM switch. Gene presence prediction was based on KEGG and BioCyc genome annotations.

References

    1. Zhang C, Li S, Yang L, Huang P, Li W, Wang S, Zhao G, Zhang M, Pang X, Yan Z, Liu Y, Zhao L. 2013. Structural modulation of gut microbiota in life-long calorie-restricted mice. Nat Commun 4:2163. doi:10.1038/ncomms3163. - DOI - PMC - PubMed
    1. Van Horn LV. 2010. Report of the dietary guidelines advisory committee on the dietary guidelines for Americans. U.S. Department of Agriculture, Washington, DC.
    1. Mozumdar A, Liguori G. 2011. Persistent increase of prevalence of metabolic syndrome among U.S. adults: NHANES III to NHANES 1999–2006. Diabetes Care 34:216–219. doi:10.2337/dc10-0879. - DOI - PMC - PubMed
    1. Cummings JH, Englyst HN. 1987. Fermentation in the human large intestine and the available substrates. Am J Clin Nutr 45:1243–1255. doi:10.1093/ajcn/45.5.1243. - DOI - PubMed
    1. Davis CD, Milner JA. 2009. Gastrointestinal microflora, food components and colon cancer prevention. J Nutr Biochem 20:743–752. doi:10.1016/j.jnutbio.2009.06.001. - DOI - PMC - PubMed

Publication types

MeSH terms