. 2018 Oct 31;38(44):9539-9550.
doi: 10.1523/JNEUROSCI.1456-18.2018. Epub 2018 Sep 21.

Sox14 Is Required for a Specific Subset of Cerebello-Olivary Projections

Affiliations

Sox14 Is Required for a Specific Subset of Cerebello-Olivary Projections

Hong-Ting Prekop et al. J Neurosci. .

Abstract

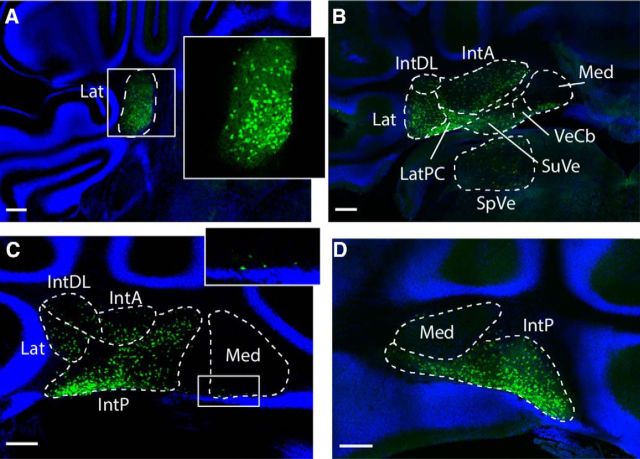
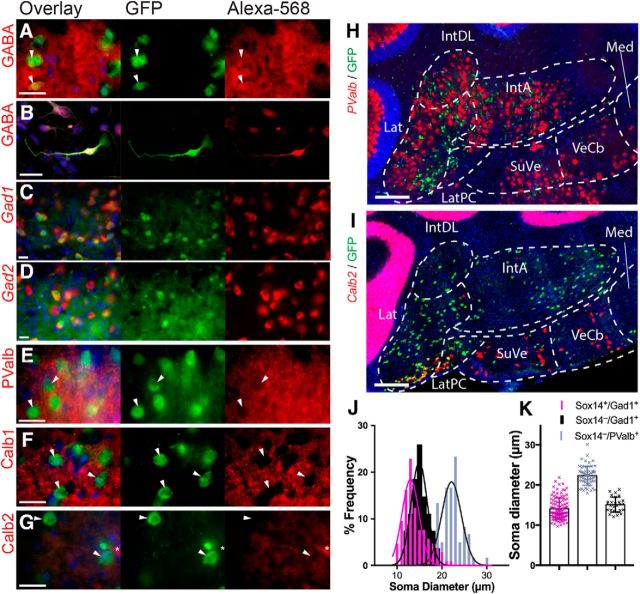
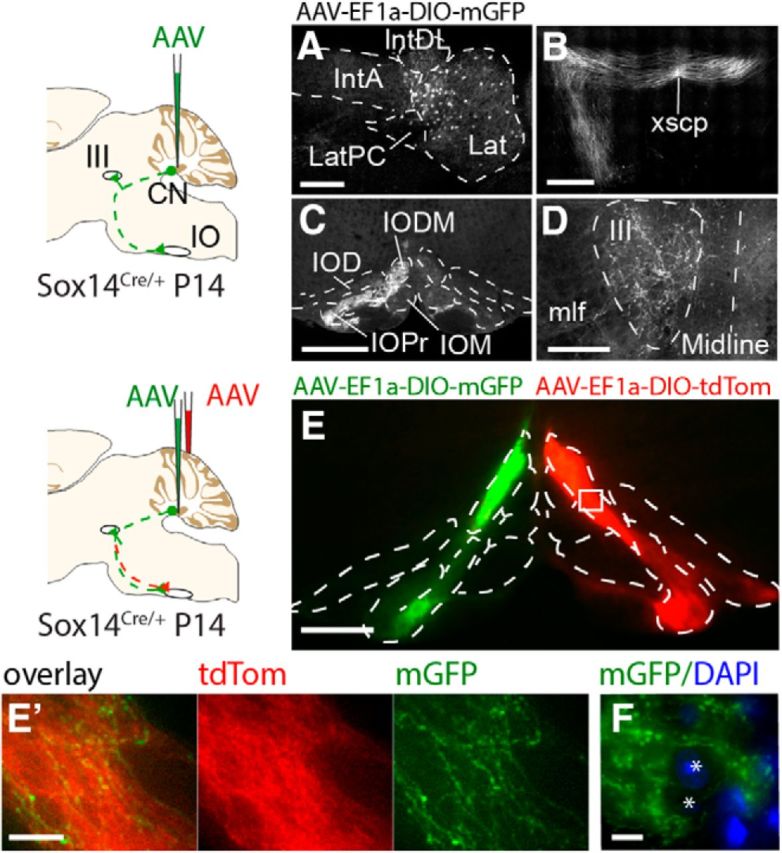
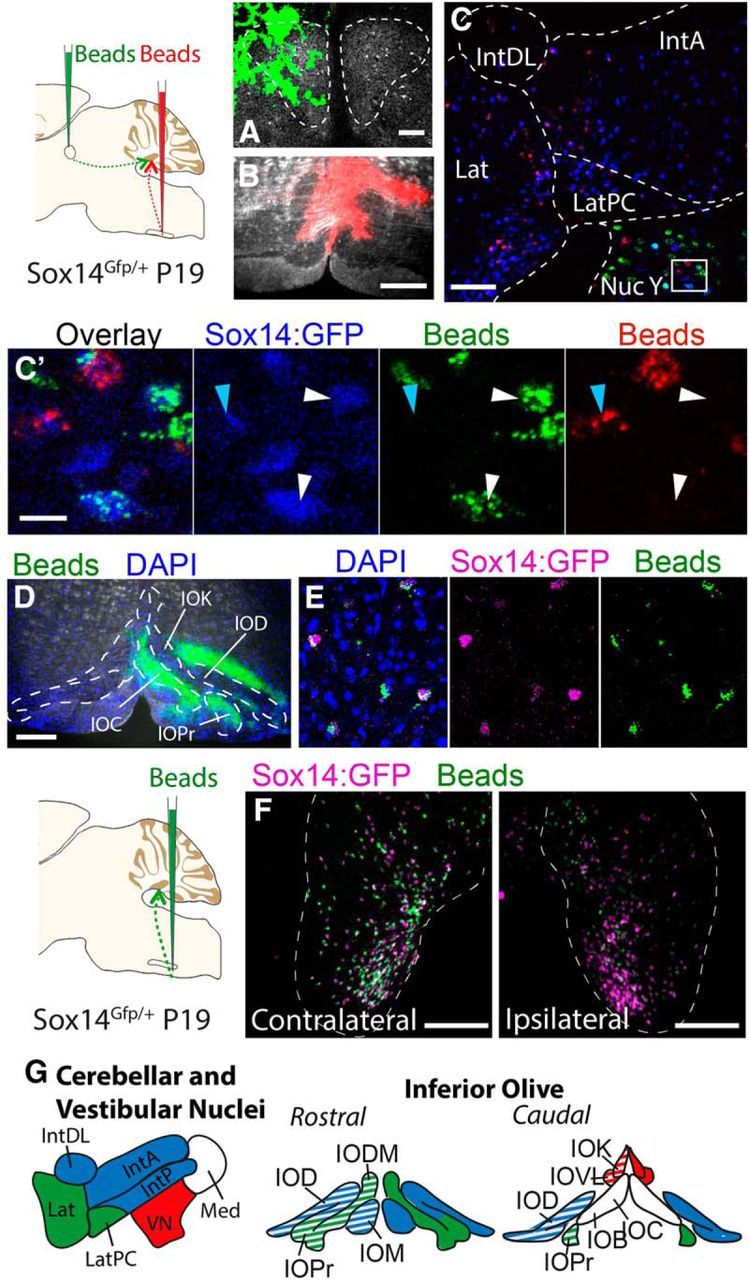
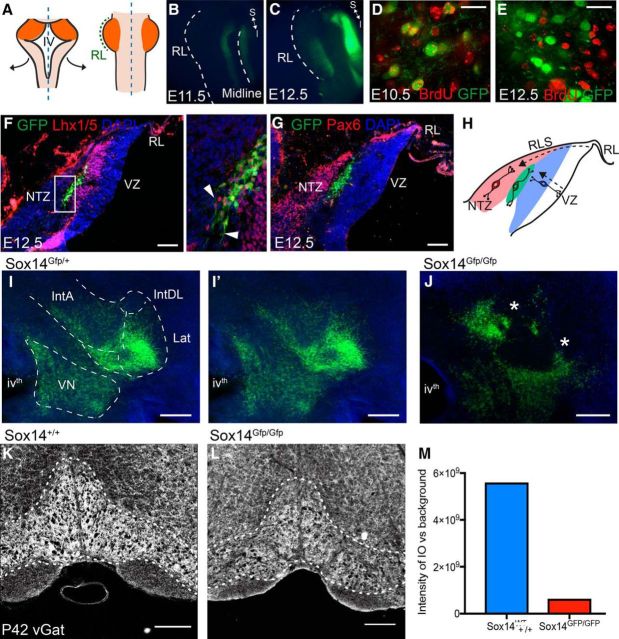
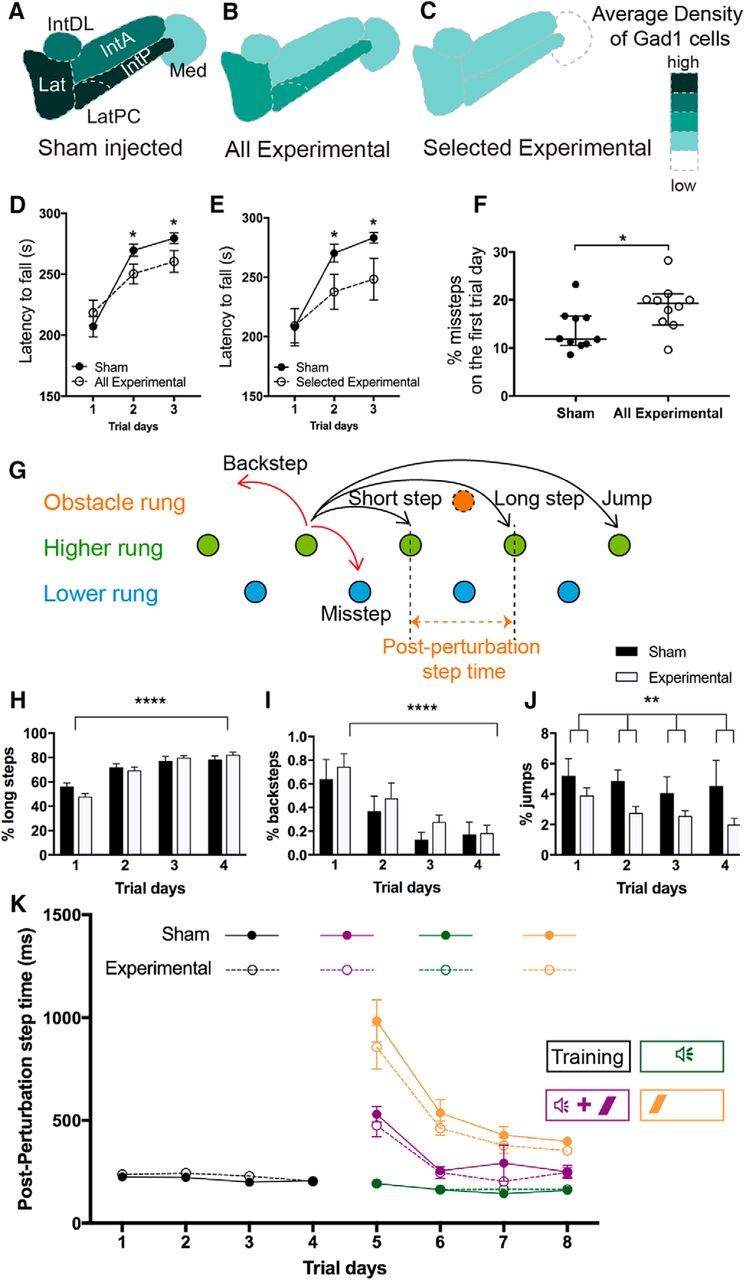
We identify Sox14 as an exclusive marker of inhibitory projection neurons in the lateral and interposed, but not the medial, cerebellar nuclei. Sox14+ neurons make up ∼80% of Gad1+ neurons in these nuclei and are indistinguishable by soma size from other inhibitory neurons. All Sox14+ neurons of the lateral and interposed cerebellar nuclei are generated at approximately E10/10.5 and extend long-range, predominantly contralateral projections to the inferior olive. A small Sox14+ population in the adjacent vestibular nucleus "Y" sends an ipsilateral projection to the oculomotor nucleus. Cerebellar Sox14+ and glutamatergic projection neurons assemble in non-overlapping populations at the nuclear transition zone, and their integration into a coherent nucleus depends on Sox14 function. Targeted ablation of Sox14+ cells by conditional viral expression of diphtheria toxin leads to significantly impaired motor learning. Contrary to expectations, associative learning is unaffected by unilateral Sox14+ neuron elimination in the interposed and lateral nuclei.SIGNIFICANCE STATEMENT The cerebellar nuclei are central to cerebellar function, yet how they modulate and process cerebellar inputs and outputs is still primarily unknown. Our study gives a direct insight into how nucleo-olivary projection neurons are generated, their projections, and their function in an intact behaving mouse. These neurons play a critical conceptual role in all models of cerebellar function, and this study represents the first specific analysis of their molecular identity and function and offers a powerful model for future investigation of cerebellar function in motor control and learning.

Keywords: GABA; axon; cerebellum; genetic model; inferior olive; motor learning.


Figures

Figure 1.
Figure 1.
Sox14 marks a subset cells in cerebellar nuclei. P21 Sox14Gfp/+ coronal sections show the cerebellum from rostral to caudal. A, Only the lateral cerebellar nucleus is seen in rostral sections. Sox14+ cells are found in the cerebellar nucleus, and these cells are distributed unevenly, seen clearly in the magnified image (inset). B, The lateral nucleus merges with the interposed nuclei and the vestibular nuclei: SuVe, superior vestibular nuclei; VeCb, vestibulocerebellar nuclei. There are Sox14+ cells throughout, except in the dorsal parts of the medial nucleus. C, More caudally, the lateral and anterior interposed nuclei recede so to only occupy a small dorsolateral domain, whereas the posterior interposed nucleus takes over. Small numbers of Sox14+ cells are seen in the ventral edge of the medial nucleus (inset). D, Most caudally, the medial nucleus is seen clearly as an almond shape above the posterior interposed nucleus. Though the shape of the nucleus is well defined by the background staining, again no Sox14+ cells are seen in this region. Lat, Lateral nucleus; LatPC, parvicellular lateral nucleus; IntDL, dorsolateral interposed nucleus; IntA, anterior interposed nucleus; IntP, posterior interposed nucleus; Med, medial nucleus; VN, vestibular nucleus; RN, reticular nucleus. Scale bar, 200 μm.
Figure 2.
Figure 2.
In the cerebellar nuclei, Sox14 are small, exclusively GABAergic, PV-ve neurons GFP versus PValb, GANA CALB1,2, GABA, GAD1, and GAD2. A–I, Comparison of Sox14:GFP with other known cell markers by immunohistochemistry or in situ hybridization in Sox14Gfp/+ P21 sections (A, C–I) and primary cell culture of brain tissue from Sox14Gfp/+ P0 neonates (B). Immunostaining for GABA (A, B), MAP2 blue label in (B), Gad1 (C), Gad2 (D), PValb (E), Calb1 (F), and Calb2 (G), imaged at 100× (40× for in situ hybridization) magnification of the lateral nucleus. The columns show the overlay, then GFP only and Alexa Fluor 568 only. The white arrowheads show examples of GFP+ cells that colocalize with GABA, Gad1, and Gad2 but not PValb, Calb1, or Calb2. There is little immunoreactivity for Calb2 within the cerebellar nuclei (G), but a single GFP/Calb2+ cell is seen, denoted with an asterisk. H, I, In situ hybridization against PValb (H) and Calb2 (I) demonstrates the distribution of the different cell types. Lat, Lateral nucleus; LatPC, parvicellular lateral nucleus; IntDL, dorsolateral interposed nucleus; IntA, anterior interposed nucleus; Med, medial nucleus; SuVe, superior vestibular nuclei; VeCb, vestibulocerebellar nuclei. H, PValb expression is observed in complementary large nuclear cells to GFP+ cells. I, Calb2 expression is mostly observed in two distinct populations within the Sox14+ cells of the cerebellar nuclei. Sox14/Calb2+ are seen in the central parts of the lateral nucleus, whereas Sox14+/Calb2+ exist in a dense cluster in the ventral parts of the lateral nucleus. J, K, Scatterplot (J) and histogram (K) of soma size as measured by mean soma diameter (in micrometers). The mean soma diameters are as follows: GFP+/Gad1, 14.1 ± 0.3 μm; GFP/Gad1+, 15.1 ± 0.4 μm; and GFP/PValb+, 22.3 ± 0.3 μm (mean ± SEM). The peak frequency for cell diameter of both GFP+ and GFP Gad1 populations is very similar. In addition, the larger GFP+ cells overlap with the PValb+ population, demonstrating that size is not a sufficient determinant of cell type.
Figure 3.
Figure 3.
Anterograde labeling of Sox14 projections identifies targets in the midbrain and inferior olive. A–D, Unilateral injections of AAV-EF1a-DIO-mGFP targeted the lateral cerebellar nucleus (A), and projections were observed crossing the midline at the decussation of the superior cerebellar peduncle (xscp, B) and terminating in the contralateral inferior olive (C) and the ipsilateral oculomotor nucleus (III, D). E, F, Bilateral injections of AAV-EF1a-DIO-mGFP and AAV-EF1a-DIO-TdTomato into the lateral cerebellar nucleus on either hemisphere show that axonal projections from each cerebellar hemisphere are bilateral, targeting both the ipsilateral and contralateral inferior olive though denser fluorescence on the contralateral side (E). Although the projections clearly terminate in the contralateral olive, axons with synaptic boutons can be seen in the ipsilateral side contacting the same range of cells. A higher-magnification view is shown in E. F, High magnification image shows mGFP-expressing axons bypassing spaces where olivary cells reside (shown by blue DAPI staining, asterisks). Scale bars: E′, F, 20 μm; A, E, 200 μm; B–D, 500 μm. Lat, Lateral nucleus; LatPC, parvicellular lateral nucleus; IntDL, dorsolateral interposed nucleus; IntA, anterior interposed nucleus; IO, inferior olive; IOD, inferior olive dorsal nucleus; IODM, inferior olive dorsomedial cell group; IOM, inferior olive medial nucleus; IOPr, inferior olive principal nucleus; CN, cerebellar nucleus; mlf, medial longitudinal fascicle.
Figure 4.
Figure 4.
Retrograde labeling identifies distinct Sox14 projection populations. A, B,Injections of green RetroBeads into the ipsilateral oculomotor nucleus (A) and red RetroBeads into the contralateral inferior olive (B) of the Sox14Gfp/+ mouse. C, The cerebellar nucleus and surrounding regions. Scale bar, 100 μm. Endogenous Sox14:GFP was stained with a far-red secondary antibody and is shown in blue. Red RetroBeads were found in Sox14:GFP+ cells of the cerebellar nucleus, whereas green RetroBeads were only observed in the vestibular nuclei. The nucleus Y region of the vestibular nuclei contains Sox14:GFP+ cells that colabel with either green RetroBeads or red RetroBeads, but never both colors in one cell (C′). D, Unilateral injection of green RetroBeads into the inferior olive of a Sox14Gfp/+ mouse at P19. E, F, Green RetroBeads were observed in the cerebellar nuclei only in cells that express Sox14:GFP (in magenta). The differential distribution of RetroBeads found in the contralateral and ipsilateral cerebellar nuclei (F) shows that projections to the inferior olive come from similar regions of both hemispheres but fewer cells contribute to the ipsilateral olive. G, Summary of Sox14+ nucleo-olivary topography shown in AAV and RetroBead injections. The nucleo-olivary neurons of the lateral cerebellar nucleus (green) project to the principle olive and the dorsomedial cell group. The nucleo-olivary neurons of the interposed cerebellar nuclei (blue) project to the medial olivary nucleus and the dorsal olivary nucleus. The Sox14+ neurons of the vestibular nuclei (red) project to the cap of Kooy of the medial nucleus and the ventrolateral protrusion. No Sox14+ neurons were observed from the medial cerebellar nucleus. All the projections were seen bilaterally in the inferior olive, but the contralateral contribution was consistently more intense (solid color) compared with the ipsilateral contribution (stripe pattern). Scale bars: C′, 20 μm; A, 50 μm; B, D, F, 200 μm. Lat, Lateral nucleus; LatPC, parvicellular lateral nucleus; IntDL, dorsolateral interposed nucleus; IntA, anterior interposed nucleus; Nuc Y, nucleus Y; IOC, inferior olive subnucleus C of medial nucleus; IOD, inferior olive dorsal nucleus; IOK, inferior olive cap of Kooy of the medial nucleus; IOPr, inferior olive principal nucleus; IODM, inferior olive dorsomedial cell group; IOM, inferior olive medial nucleus; IOB, inferior olive subnucleus B of medial nucleus; IOVL, inferior olive ventrolateral protrusion; Med, medial nucleus; VN, vestibular nucleus.
Figure 5.
Figure 5.
Integration of inhibitory projection neurons into the nuclei is mediated by Sox14. A, Sox14Gfp/+ hindbrains were opened up dorsally along the midline and mounted flat so that the rhombic lip, which originally lined the intersection between the cerebellum and roof plate, is the most lateral edge (in green); the cerebellar anlage is in orange. B, C, GFP expression is seen at E11.5 (B) and E12.5 (C) on either side of the midline, whereas expression in the cerebellar plate is only seen from E12.5 onward. D, E, BrdU birth-dating analysis. Scale bars, 20 μm. GFP+ cells colocalize with BrdU that was injected at E10.5 (D), whereas BrdU injected at E12.5 (E) shows no colocalization, indicating that all the GFP+ cells are born before E12.5. F, In situ hybridization against Lhx1/5 and GFP in the Sox14Gfp/+ E12.5 sagittal brain sections. The Lhx1/5-expressing cells span the anteroposterior axis of the cortical transitory zone and are mostly Purkinje cell precursors. However, there is a dorsal layer of the Lhx1/5+ and GFP+ population that are genetically distinct, as shown in the higher-magnification image (inset). These cells appear to be in a tangential orientation (white arrowheads), unlike the GFP/Lhx1/5+ Purkinje cells that are migrating radially from the ventricular zone. G, Pax6+ cells migrating along the rhombic lip migratory stream toward the nuclear transitory zone sit dorsal to the GFP+ cells. H, A schematic to show the tangential orientation of the GFP+ cells (green) alongside the Pax6 excitatory cells migrating tangentially along the subpial rhombic lip migratory stream (RLS, red) and the GFP/Lhx1/5+ Purkinje cells that are migrating radially from the ventricular zone. I, J, Coronal sections of the Sox14+ cells in the developing CN of P0 Sox14Gfp/+ mouse (I) compared with the Sox14Gfp/Gfp knock-out mouse (J). Scale bars, 200 μm. I′, The same image without borders drawn to highlight that for the Sox14Gfp/+ mouse, the migratory streams already resemble the future boundaries between the subnuclei, whereas for the knock-out, the cells fail to populate some areas, leaving large gaps (asterisks) and deviant clusters of cells. There are still some likenesses between the two brains, which suggest that there are other migratory mechanisms at work in the development of nucleo-olivary neurons. KM, Density of vGAT labeling in the inferior olive of an adult wild-type (K) and Sox14 mutant (L) mouse shows a difference in signal to background intensity (M). Scale bars: F, 100 μm; I–L, 200 μm. RL, Rhombic lip; Lat, lateral nucleus; IntDL, dorsolateral interposed nucleus; IntA, anterior interposed nucleus; VN, vestibular nucleus; VZ, ventricular zone; ivth, fourth ventricle.
Figure 6.
Figure 6.
Targeted ablation of Sox14 neurons leads to locomotor dysfunction. Assessment using Gad1 labeling as a measure of nucleo-olivary cell loss is shown. A–C, The schematic represents the average density of Gad1-reactive cells in the sham-injected mice (A), all the Sox14Cre/+ experimental mice (B), and selected averaged data for the six experimental mice that showed extensive cell loss (>70%) compared with sham (C). D, Rotarod data for all experimental mice against the sham-injected group. The experimental mice show significantly reduced latencies for both day 2 (p = 0.0324) and day3 (p = 0.0374). E, Rotarod data for the six selected experimental mice shown in C against the sham-injected group. The selected group performed worse with significantly reduced latencies for both day 2 (p = 0.041) and day 3 (p = 0.036). Mean ± SEM; two-way ANOVA followed by Bonferroni's post-tests: main effect of trial time, F(2,120) = 1122, p < 0.0001; main effect of ablation, F(1,120) = 4.479, p = 0.0064; ablation × trial time interaction, F(2,1.20) = 1.25, p = 0.2903. F, Percentage of missteps measured on the introduction onto the Erasmus ladder apparatus shows the experimental group initially made more mistakes compared with the sham group. The median percentage of missteps in the sham and experimental groups was 11.85 and 19.26%, respectively; thus the distributions in the two groups differed significantly (Mann–Whitney U test, 23; n1 = 10, n2 = 10, p = 0.0433, two-tailed; median with 95% Cl). G, The various types of steps that are measured (image adapted from Noldus). The mouse ordinarily prefers to travel along the top set of rungs (green) and can perform short, long, or jump steps according to how many rungs are skipped between steps. The mouse may also take back steps, moving backward against the tailwind, or perform a misstep, where a mistake leads the mouse to step onto a lower set of rungs (blue). During associative learning trials, an obstacle rung (orange) may swing up to obstruct the path of the mouse so that it must step over the rung. Although the placement of the obstacle rung may change between trials, the postperturbation step time is defined as the time between activation of the rung before the obstacle to the rung after the obstacle. H–J, Usage of various step types over the training days (days 1–4). H, The percentage of steps that were long steps used in each trial day. The effect of trial days was extremely significant (p < 0.0001, F(3,80) = 36.32). I, The percentage of steps that were backsteps used in each trial day. The effect of trial days was extremely significant (p < 0.0001, F(3,80) = 9.27). J, The percentage of steps that were jumps used in each trial day. The effect of ablative injection was significant, showing a decreased percentage of jumps in the experimental animals compared with sham (adjusted p = 0.0033, F(1,80) = 9.20, two-way ANOVA corrected method of Benjamini and Yekutieli, mean ± SEM). K, Postperturbation step times in the different associative learning trials. During the first 4 d, only undisturbed trials were run to train the mice to traverse the ladder. Since there is no obstacle in these trials, the postperturbation step time is the average step time for a normal step (black). On days 5–8, trials are run so that the mouse is presented with either CS-only (green), US-only (orange), or paired CS–US (purple) stimuli. Where there is an obstacle presented in the trial, the postperturbation step time will increase if the mouse is not anticipating the obstacle. In all trial types, there was no significant difference in postperturbation step time between the two groups (mean ± SEM). US, Unconditioned stimulus; CS, conditioned stimulus; Lat, Lateral nucleus; LatPC, parvicellular lateral nucleus; IntDL, dorsolateral interposed nucleus; IntA, anterior interposed nucleus; Med, medial nucleus; IntP, posterior interposed nucleus. *p < 0.05; **p < 0.01; ****p < 0.0001.

References

    1. Aizenman CD, Huang EJ, Linden DJ (2003) Morphological correlates of intrinsic electrical excitability in neurons of the deep cerebellar nuclei. J Neurophysiol 89:1738–1747. 10.1152/jn.01043.2002 - DOI - PubMed
    1. Altman J, Bayer SA (1985) Embryonic development of the rat cerebellum. II. Translocation and regional distribution of the deep neurons. J Comp Neurol 231:27–41. 10.1002/cne.902310104 - DOI - PubMed
    1. Bagnall MW, Zingg B, Sakatos A, Moghadam SH, Zeilhofer HU, du Lac S (2009) Glycinergic projection neurons of the cerebellum. J Neurosci 29:10104–10110. 10.1523/JNEUROSCI.2087-09.2009 - DOI - PMC - PubMed
    1. Bengtsson F, Svensson P, Hesslow G (2004) Feedback control of Purkinje cell activity by the cerebello-olivary pathway. Eur J Neurosci 20:2999–3005. 10.1111/j.1460-9568.2004.03789.x - DOI - PubMed
    1. Bengtsson F, Jirenhed DA, Svensson P, Hesslow G (2007) Extinction of conditioned blink responses by cerebello-olivary pathway stimulation. Neuroreport 18:1479–1482. 10.1097/WNR.0b013e3282e326e8 - DOI - PubMed

Publication types

Substances

LinkOut - more resources