. 2018 Oct 9;115(41):E9717-E9726.
doi: 10.1073/pnas.1809382115. Epub 2018 Sep 21.

ASTN2 modulates synaptic strength by trafficking and degradation of surface proteins

Affiliations

ASTN2 modulates synaptic strength by trafficking and degradation of surface proteins

Hourinaz Behesti et al. Proc Natl Acad Sci U S A. .

Abstract

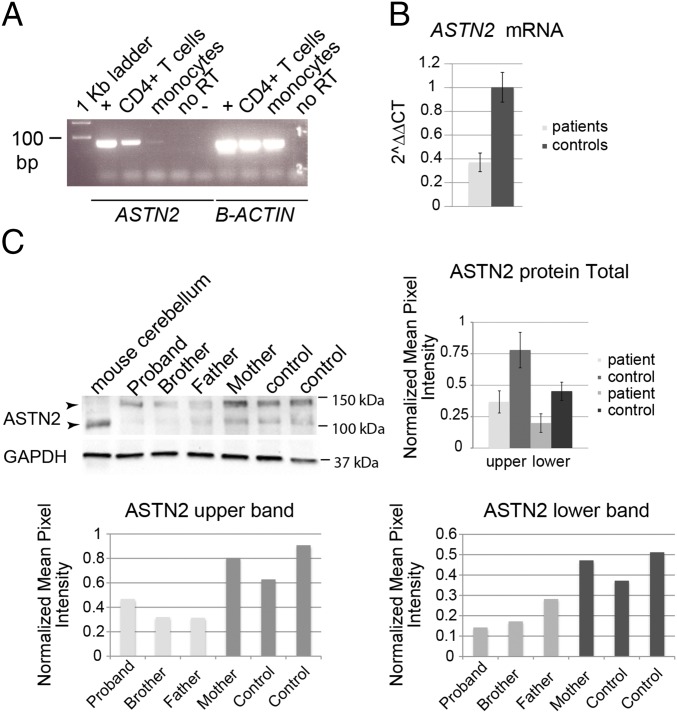
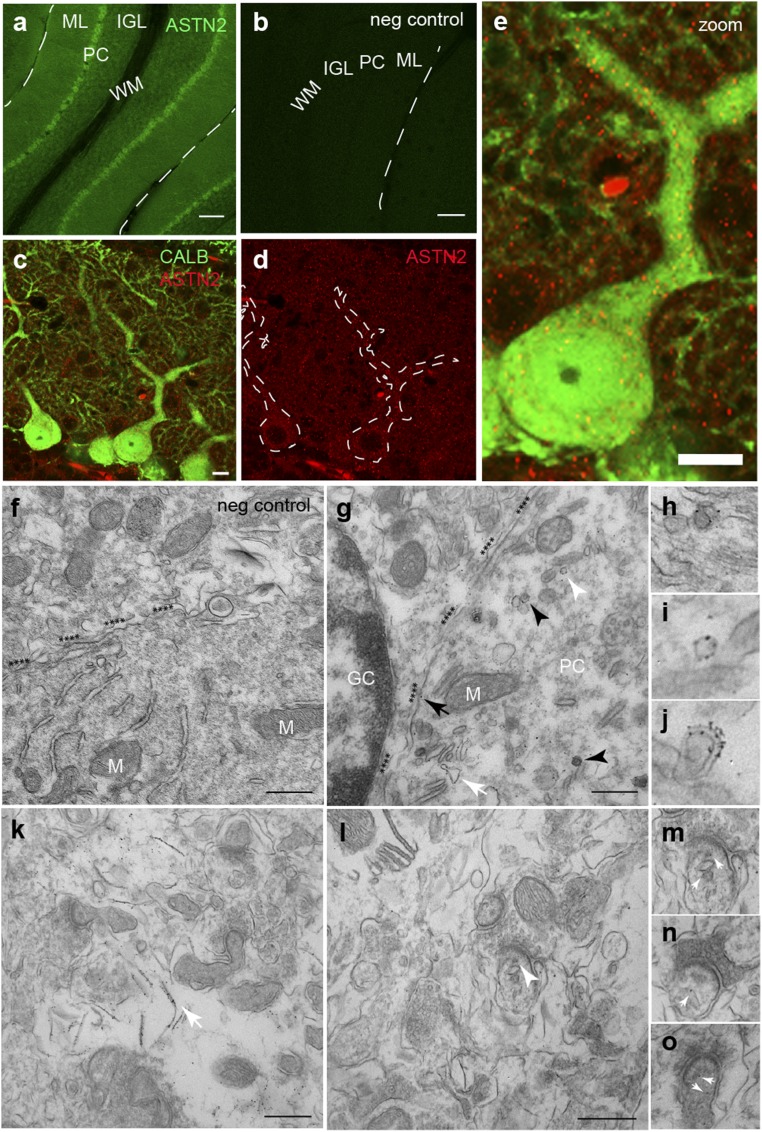
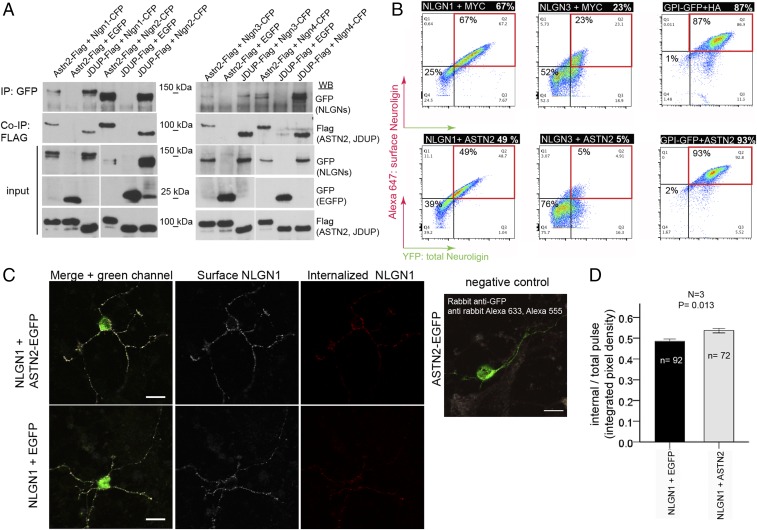
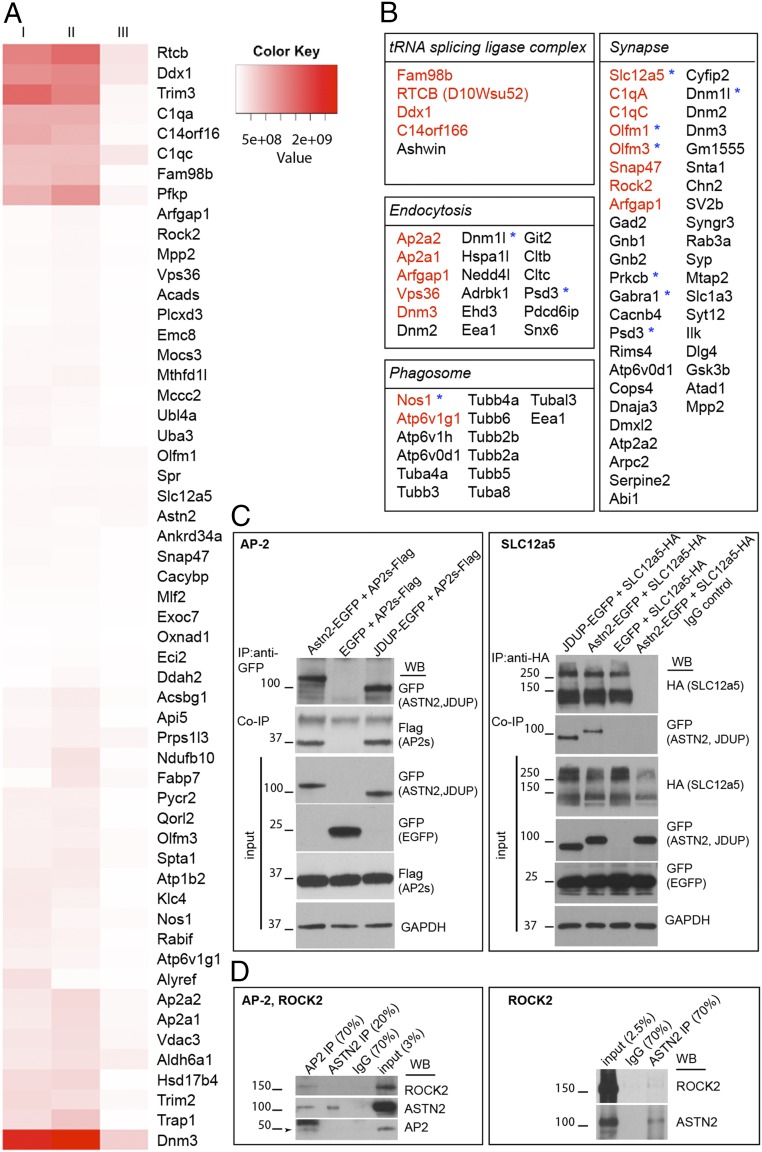
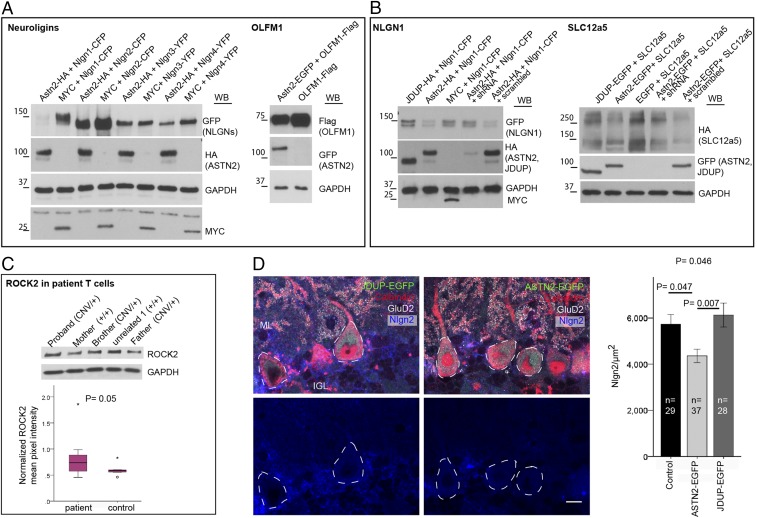
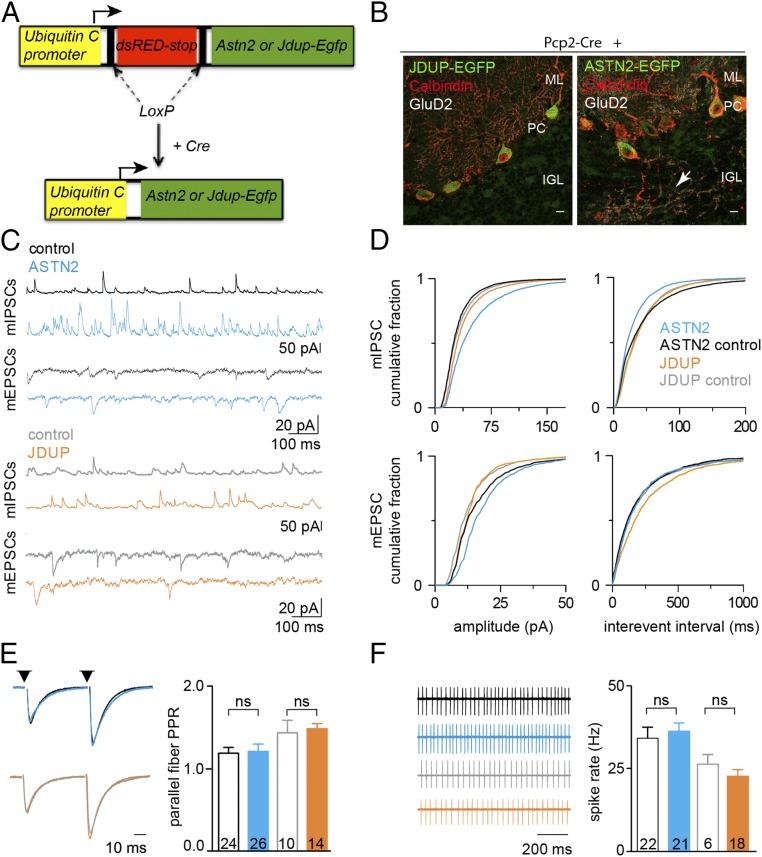
Surface protein dynamics dictate synaptic connectivity and function in neuronal circuits. ASTN2, a gene disrupted by copy number variations (CNVs) in neurodevelopmental disorders, including autism spectrum, was previously shown to regulate the surface expression of ASTN1 in glial-guided neuronal migration. Here, we demonstrate that ASTN2 binds to and regulates the surface expression of multiple synaptic proteins in postmigratory neurons by endocytosis, resulting in modulation of synaptic activity. In cerebellar Purkinje cells (PCs), by immunogold electron microscopy, ASTN2 localizes primarily to endocytic and autophagocytic vesicles in the cell soma and in subsets of dendritic spines. Overexpression of ASTN2 in PCs, but not of ASTN2 lacking the FNIII domain, recurrently disrupted by CNVs in patients, including in a family presented here, increases inhibitory and excitatory postsynaptic activity and reduces levels of ASTN2 binding partners. Our data suggest a fundamental role for ASTN2 in dynamic regulation of surface proteins by endocytic trafficking and protein degradation.

Keywords: autism spectrum disorder; cerebellum; protein degradation; protein trafficking; synapse.


Conflict of interest statement

The authors declare no conflict of interest.

Figures

Fig. 1.
Fig. 1.
ASTN2 expression in patients. (A) Expression of ASTN2 detected in human CD4+ T cells but not in monocytes. Positive (human fibroblasts), negative (no template), and no RT controls are indicated. (B) ASTN2 mRNA levels, expressed as 2ΔΔCT (cycle time by quantitative RT-PCR) in relation to GUSB (endogenous control). Protein levels in ASTN2 CNV patient T cells versus controls (C, Left) are quantified in the graph (C, Right). (C, Bottom) Quantifications of individual ASTN2 bands [upper (Left) and lower (Right) bands] in relation to GAPDH are shown. N = 3 patients and 3 controls. Bars show mean ± 1 SD.
Fig. 2.
Fig. 2.
ASTN2 subcellular protein localization in the cerebellum. Sagittal sections of cerebellum labeled with antibodies against ASTN2 (green) (A) and against ASTN2 (red) and Calbindin (green) (CE) at P15. (B) Negative (neg) control (no primary antibody). Dotted lines in D outline PC bodies and primary dendrites. (E) Zoomed-in view of one PC. (FO) Immunogold EM labeling of ASTN2 at P28. (F) Negative control (no primary). (G) ASTN2 labeling in a PC soma associated with the plasma membrane (highlighted by asterisks and black arrow), membranes of the ER (white arrow), trafficking vesicles (white arrowhead and I), and autophagosomes (black arrowheads and J). (H) High-power image showing ASTN2 labeling associated with an endocytic vesicle at the plasma membrane. (K) PC dendrite in the ML with ASTN2 labeling on membranous structures within the dendrite (arrow). Synapses in this image are negative for ASTN2. (L) PC dendritic area with positive labeling in a spine (white arrowhead). (MO) Higher magnification examples of PC dendritic spines showing ASTN2 labeling (arrows). IGL, internal granule layer; M, mitochondria; ML, molecular layer; WM, white matter. (Scale bars: A and B, 100 μm; CE, 10 μm; F, G, K, and L, 0.5 μm.)
Fig. 3.
Fig. 3.
ASTN2 regulation of Neuroligin surface expression by protein–protein binding and endocytosis. (A) Western blots showing co-IP of ASTN2 and JDUP with Neuroligins (Nlgn) 1–4 in HEK 293T cells. (B) Live immunolabeling of surface Neuroligin (NLGN) expression (Alexa-647, red quadrants) in HEK 293T cells analyzed by flow cytometry in cells coexpressing NLGN1-HA-YFP or NLGN3-YFP with either a MYC control vector (Top) or ASTN2-HA (Bottom). (Right) Surface glycosylphosphatidylinositol (GPI)-anchored EGFP is unaltered by ASTN2. (C, Left) Pulse–chase labeling of NLGN1-HA-YFP coexpressed with either EGFP or ASTN2-EGFP in GCs showing surface (white) and internalized (red) NLGN1 labeling after a 20-min chase. (C, Right) Negative control, showing that the EGFP from ASTN2-EGFP (or EGFP) is not detected on the surface. (Scale bars: 10 μm.) (D) Quantification of the pulse–chase expressed as integrated pixel density (sum of all pixel intensities per area minus the background) of the internal labeling divided by the integrated pixel density of the total pulse (red + white). The graph shows mean ± 1 SEM. N, number of experiments; n, total number of cells analyzed. The P value was calculated by analysis of covariance (Methods). WB, Western blot.
Fig. 4.
Fig. 4.
Protein interactors of ASTN2 identified by IP plus LC-MS/MS. (A) Heat map of the top 57 candidate interacting proteins enriched in ASTN2 IPs in three experiments from P22–P28 cerebellar lysates. The intensity of the map is based on the MS intensity spectra values (Dataset S2). IP I and IP II are biological and technical replicates. IP III is a third biological replicate, which was washed more stringently and performed separately (Methods). (B) Lists of identified proteins by functional enrichment. Proteins belonging to the list of top hits (in A) are shown in red. ASD-associated proteins found by cross-referencing Dataset S2 to the SFARI Gene human ASD-gene list (https://gene.sfari.org) are marked with blue asterisks. Western blots show co-IPs of AP-2 (sigma fragment, Ap2s) and SLC12a5 with ASTN2 or JDUP in HEK 293T cells (C) and of AP-2, ROCK2, and ASTN2 in cerebellar lysates at P22 (D). The protein ladder is shown in kilodaltons. In the SLC12a5 blot, GFP appears in all samples due to the existence of an internal ribosome entry site-EGFP in the SLC12a5-HA construct.
Fig. 5.
Fig. 5.
ASTN2 reduces the levels of interacting proteins. (A) Western blots showing reduced protein levels of NLGN1–NLGN4 and OLFM1 in HEK 293T cells in the presence of ASTN2 compared with MYC (control) or OLFM1 alone. (B) Western blots showing reduced expression of NLGN1 and SLC12a5 in HEK 293T cells in the presence of ASTN2 or ASTN2 coexpressed with a scrambled plasmid, but less so in the presence of JDUP or MYC or when ASTN2 is knocked down with shRNA. GAPDH was used as an internal control for protein loading. (C) Representative Western blot showing ROCK2 levels in ASTN2 CNV patient T cells. The controls consisted of the mother and unrelated healthy subjects. Quantification of ASTN2 normalized to GAPDH in four technical replicates of three patients and three controls is shown in the box plot. (D) Conditional expression of ASTN2-EGFP and JDUP-EGFP (green) in sagittal sections of PCP2-Cre+ cerebella labeled with antibodies against Calbindin (red), NLGN2 (blue), and GluD2 (white). Quantification of NLGN2 levels (corrected integrated pixel density) in PC somas is shown (outlined by dashed lines) upon ASTN2 versus JDUP overexpression or control (PCP2-Cre−/− mice injected with conditional ASTN2-EGFP virus). (Scale bar: 10 μm.) The graph shows mean ± 1 SEM. n, total number of cells analyzed from three mice per condition. The P value at the top was determined by analysis of covariance, and those closer to bars were determined by post hoc tests between groups.
Fig. 6.
Fig. 6.
Effect of ASTN2 overexpression on synaptic activity of PCs. (A) Schematic of conditional lentiviral vectors. Expression of ASTN2-EGFP or JDUP-EGFP is driven by the Ubiquitin C promoter in the presence of Cre. (B) Sagittal sections showing JDUP-EGFP and ASTN2-EGFP (green) expression in PCs marked by Calbindin (red) and GluD2 (white) 3–4 wk after injection into Pcp2-Cre+ mice. The arrow indicates an ectopic PC and its dendritic tree in the IGL of an ASTN2-EGFP–injected mouse. (Scale bars: 10 μm.) (C) mIPSCs (Top) and mEPSCs (Bottom) postsynaptic currents in controls (PCP2-Cre−/−; black, n = 21 cells) and ASTN2-expressing (PCP2-Cre+; blue, n = 14 cells) PCs and in control (PCP2-Cre−/−; gray, n = 10 cells) and JDUP-expressing (PCP2-Cre+; orange, n = 12 cells) PCs. (D) Cumulative histograms of the amplitude (Left) and frequency (Right) of miniature events in control (black or gray) and ASTN2-expressing (blue) or JDUP-expressing (orange) PCs. Distributions were compared using the Mann–Whitney U test and were found to differ significantly between ASTN2 and controls in all measurements (P < 0.0001), except for mEPSC frequency, which was the same between control and ASTN2 but significantly different between control and JDUP (P < 0.0001). (E, Left) Evoked parallel fiber EPSCs [membrane potential (Vm) ∼ −75 mV, 50-ms interstimulus interval, arrowheads]. (E, Right) Summary graph of paired-pulse ratios (PPR) (mean ± 1 SEM). (F, Left) Cell-attached recordings of spontaneous spiking. (F, Right) Summary graph (mean ± 1 SEM) of spontaneous firing rates. The total numbers of cells recorded from five to seven animals per condition are shown. IGL, internal granule layer; ML, molecular layer; ns, not significant.

References

    1. Wilson PM, Fryer RH, Fang Y, Hatten ME. Astn2, a novel member of the astrotactin gene family, regulates the trafficking of ASTN1 during glial-guided neuronal migration. J Neurosci. 2010;30:8529–8540. - PMC - PubMed
    1. Stitt TN, Hatten ME. Antibodies that recognize astrotactin block granule neuron binding to astroglia. Neuron. 1990;5:639–649. - PubMed
    1. Adams NC, Tomoda T, Cooper M, Dietz G, Hatten ME. Mice that lack astrotactin have slowed neuronal migration. Development. 2002;129:965–972. - PubMed
    1. Fishell G, Hatten ME. Astrotactin provides a receptor system for CNS neuronal migration. Development. 1991;113:755–765. - PubMed
    1. Lesch KP, et al. Molecular genetics of adult ADHD: Converging evidence from genome-wide association and extended pedigree linkage studies. J Neural Transm (Vienna) 2008;115:1573–1585. - PubMed

Publication types

LinkOut - more resources