. 2018 Oct 9;115(41):E9640-E9648.
doi: 10.1073/pnas.1809695115. Epub 2018 Sep 21.

Hypoxia-inducible factor 1-dependent expression of adenosine receptor 2B promotes breast cancer stem cell enrichment

Affiliations

Hypoxia-inducible factor 1-dependent expression of adenosine receptor 2B promotes breast cancer stem cell enrichment

Jie Lan et al. Proc Natl Acad Sci U S A. .

Erratum in

Abstract

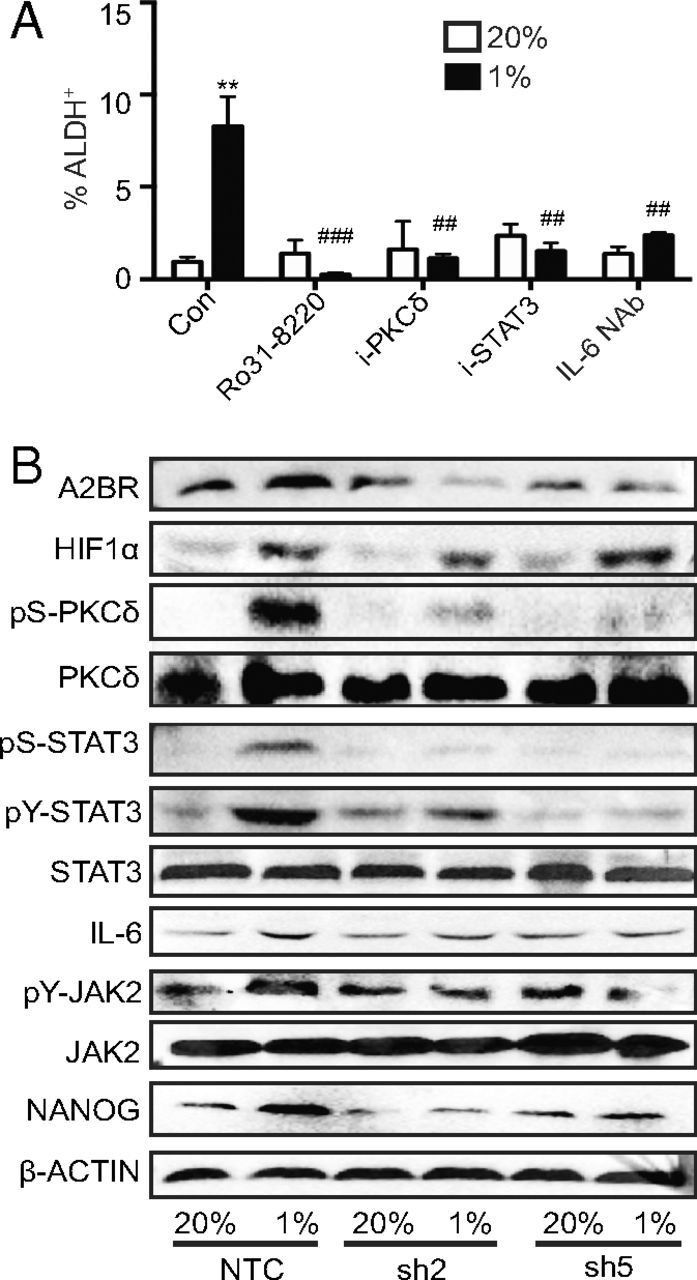
Breast cancer stem cells (BCSCs), which are characterized by a capacity for unlimited self-renewal and for generation of the bulk cancer cell population, play a critical role in cancer relapse and metastasis. Hypoxia is a common feature of the cancer microenvironment that stimulates the specification and maintenance of BCSCs. In this study, we found that hypoxia increased expression of adenosine receptor 2B (A2BR) in human breast cancer cells through the transcriptional activity of hypoxia-inducible factor 1. The binding of adenosine to A2BR promoted BCSC enrichment by activating protein kinase C-δ, which phosphorylated and activated the transcription factor STAT3, leading to increased expression of interleukin 6 and NANOG, two key mediators of the BCSC phenotype. Genetic or pharmacological inhibition of A2BR expression or activity decreased hypoxia- or adenosine-induced BCSC enrichment in vitro, and dramatically impaired tumor initiation and lung metastasis after implantation of MDA-MB-231 human breast cancer cells into the mammary fat pad of immunodeficient mice. These data provide evidence that targeting A2BR might be an effective strategy to eradicate BCSCs.

Keywords: ADORA2B; HIF-1; caffeine; oxygen; tumor-initiating cells.


Conflict of interest statement

The authors declare no conflict of interest.

Figures

Fig. 1.
Fig. 1.
Hypoxia induces A2BR expression in a HIF-1–dependent manner. (A) The expression level of mRNAs encoding the four adenosine receptors (A1R, A2AR, A2BR, A3R) in each of 1,095 human breast cancers from TCGA database were compared with a 10-mRNA HIF target-gene signature. For each comparison, the Pearson correlation coefficient (R) and statistical significance (P) are shown. (B) The relative log2 expression of A2BR mRNA from 1,095 human breast cancer specimens that were stratified according to molecular subtype is shown. Statistical analysis was performed by one-way ANOVA. Post hoc testing demonstrated significantly increased A2BR expression in basal-like tumors compared with each of the other subtypes. (C and D) Four human breast cancer cell lines were exposed to 20% or 1% O2 for 24 h (C) or 48 h (D), and the expression of A2BR mRNA (C) or protein (D) was analyzed by RT-qPCR (C) and immunoblot (D) assays. For each cell line, the expression of A2BR mRNA was quantified relative to 18S rRNA and then normalized to the result obtained from cells at 20% O2 (mean ± SD; n = 3). *P < 0.05, **P < 0.01 versus 20% O2 (one-way ANOVA). (E) Cells were exposed to 20% or 1% O2 for 48 h, and the percentage of cells expressing A2BR was determined by flow cytometry (mean ± SD; n = 3). *P < 0.05 versus 20% O2 (one-way ANOVA). (F and G) MCF-7 subclones, which stably expressed a nontargeting control shRNA (NTC), or shRNA targeting HIF-1α (shHIF-1α) or HIF-2α (shHIF-2α), were exposed to 20% or 1% O2 for 24 h, followed by analysis of A2BR mRNA levels by RT-qPCR (F), or for 48 h, followed by analysis of A2BR+ cells by flow cytometry (G) (mean ± SD; n = 3). *P < 0.05, **P < 0.01 versus NTC at 20% O2; #P < 0.05 versus NTC at 1% O2 (two-way ANOVA). (H) A2BR and HIF-1α expression were determined by immunoblot assay in MCF-7 subclones exposed to 20% or 1% O2 for 48 h. (I) SUM149 cells were exposed to 20% or 1% O2, in the presence of vehicle or digoxin (100 nM) for 48 h, and the percentage of A2BR+ cells was determined (mean ± SD; n = 3). *P < 0.05 versus vehicle at 20% O2; #P < 0.05 versus vehicle at 1% O2 (two-way ANOVA). (J) A2BR expression was determined in SUM149 cells exposed to 20% or 1% O2 for 48 h in the presence of vehicle, digoxin (100 nM), or acriflavine (1 μM). (K) MCF-7 cells were exposed to 20% or 1% O2 for 16 h, and ChIP assays were performed using IgG or antibodies against HIF-1α, HIF-1β, or HIF-2α. Primers flanking candidate HIF binding sites at −696 bp (Left) and −155 bp (Right) relative to the transcription initiation site were used for qPCR, and results were normalized to chromatin immunoprecipitated with IgG from cells exposed to 20% O2 (mean ± SD; n = 3). *P < 0.05 vs. 20% O2 (two-way ANOVA).
Fig. 2.
Fig. 2.
A2BR expression enhances BCSC enrichment. (A) SUM149 (Upper) and MCF-7 (Lower) cells were cultured on standard polystyrene tissue culture plates (Adherent) or ultra-low attachment plates (Sphere) for 7 d and harvested for analysis of A2BR mRNA expression. Results were normalized to Adherent (mean ± SD; n = 3). *P < 0.05 versus Adherent (Student’s t test). (B) SUM149 (Upper) and MCF-7 (Lower) cells were exposed to 20% or 1% O2 for 72 h, and the percentage of A2BR+ALDH+ cells was determined by flow cytometry (mean ± SD; n = 3). *P < 0.05 versus 20% O2 (Student’s t test). (C and D) SUM149 (Upper) and MCF-7 (Lower) subclones transduced with lentiviral vector encoding NTC or an A2BR shRNA (sh1, sh2, or sh5) were exposed to 20% or 1% O2 for 3 d, and then cells were cultured on ultra-low attachment plates for 7 d, and the number of mammospheres per field was counted (mean ± SD; n = 3). **P < 0.01 versus NTC at 20% O2; ##P < 0.01 versus NTC at 1% O2 (two-way ANOVA). (Scale bar: 1 mm.) (E) SUM149 (Left), MCF-7 (Middle), and MDA-MB-231 (Right) subclones transduced with NTC or an A2BR shRNA vector were exposed to 20% or 1% O2 for 3 d, and the percentage of ALDH+ cells was determined (mean ± SD; n = 3). **P < 0.01 versus NTC at 20% O2; ##P < 0.01 versus NTC at 1% O2 (two-way ANOVA). (F) MCF-7 cells were treated with vehicle, alloxazine (30 μM), or caffeine (8 μM) for 3 d, and the percentage of ALDH+ cells was determined (mean ± SD; n = 3). **P < 0.01 versus vehicle at 20% O2; ##P < 0.01 versus vehicle at 1% O2 (two-way ANOVA). (G) Cells were treated with vehicle (Veh) or adenosine (Ado) for 3 d, and the percentage of ALDH+ cells was determined (mean ± SD; n = 3). **P < 0.01 versus Veh (two-way ANOVA). (H and I) MCF-7 (H) and MDA-MB-231 (I) subclones transfected with NTC or A2BR shRNA vector were treated with Ado (MCF-7, 5 μM; MDA-MB-231, 2.5 μM) for 3 d, and the percentage of ALDH+ cells was determined (mean ± SD; n = 3). **P < 0.01 versus NTC with Veh, ##P < 0.01 versus NTC with Ado (two-way ANOVA).
Fig. 3.
Fig. 3.
Knockdown of A2BR inhibits tumor formation and metastasis. (A) MDA-MB-231 subclones (1 × 10³ cells) transduced with NTC or an A2BR shRNA vector were implanted into the mammary fat pad (MFP). The proportion of mice with tumors after 11 wk and P value (vs. NTC; Fisher’s exact test) are shown. (B–F) MDA-MB-231 subclones (2 × 10⁶ cells) transduced with NTC or an A2BR shRNA vector were implanted into the MFP. Tumor volume (mean ± SD; n = 6–8 mice) was measured twice per week (B). When tumor volume reached 1,200 mm3, primary tumors were harvested for mammosphere (C) and ALDH (D) assays (mean ± SD; n = 3). (Scale bar: 1 mm.) The number of mammospheres per field was counted (mean ± SD; n = 15); **P < 0.01 versus NTC (one-way ANOVA). Lungs were harvested and fixed under inflation, paraffin-embedded sections were stained with hematoxylin and eosin (E) (scale bar: 1 mm), and the number of metastases per field was counted (F; mean ± SD; n = 9); **P < 0.01 versus NTC (one-way ANOVA).
Fig. 4.
Fig. 4.
A2BR promotes BCSC enrichment through PKCδ-dependent STAT3 activation. (A–E) MCF-7 cells were treated with vehicle (Veh) or 5 μM adenosine (Ado) in the absence (Con) or presence of a pan-PKC inhibitor [100 nM Ro31-8220 (A) or 1 nM sotrastaurin (B)], Ca2+-dependent PKC subtype inhibitor [15 μM Go6976 (C)], PKCδ inhibitor [100 nM i-PKCδ (D)], or STAT3 inhibitor VII [100 nM i-STAT3 (E)] for 3 d, and the percentage of ALDH+ cells was determined (mean ± SD; n = 3). ***P < 0.001 versus control (Con) treated with vehicle (Veh); ##P < 0.01, ###P < 0.001, and ns (no significant difference) versus Con treated with Ado (two-way ANOVA). (F) MCF-7 cells were treated with Veh or Ado for 3 d, and IL-6 and NANOG mRNA levels were determined by RT-qPCR (mean ± SD; n = 3); *P < 0.05 versus Veh. (G) MCF-7 cells were treated with Veh or Ado for 3 d in the absence or presence of IL-6 neutralizing antibody (2.5 μg/mL IL-6 NAb), and the percentage of ALDH+ cells was determined (mean ± SD; n = 3). ***P < 0.001 versus control (Con) treated with vehicle (Veh); ##P < 0.01 versus Con treated with Ado (two-way ANOVA). (H) MCF-7 subclones transduced with NTC or an A2BR shRNA (sh2 or sh5) vector were treated with Veh (Con) or Ado for 3 d, and immunoblot assays were performed. (I–L) MCF-7 cells were treated with vehicle (Con) or Ado, either alone or in combination with i-PKCδ (I), Ro31-8220 (J), i-STAT3 (K), or IL-6 NAb (L) for 3 d, and immunoblot assays were performed. (M) Hypoxia induces A2BR expression in a HIF-1α–dependent manner and increases A2BR–PKCδ–STAT3 signaling, resulting in augmented expression of IL-6 and NANOG, which specify the BCSC phenotype.
Fig. 5.
Fig. 5.
Hypoxia induces BCSC enrichment through A2BR–PKCδ–STAT3 signaling. (A) MCF-7 cells were treated with vehicle (Con), 100 nM Ro31-8220, 100 nM i-PKCδ, 100 nM i-STAT3, or 2.5 μg/mL IL-6 NAb, and exposed to 20% or 1% O2 for 3 d. The percentage of ALDH+ cells (mean ± SD; n = 3) was determined by flow cytometry. **P < 0.001 versus Con cells at 20% O2; ##P < 0.01, ###P < 0.001 versus Con cells at 1% O2 (two-way ANOVA). (B) MCF-7 subclones stably transduced with NTC or A2BR shRNA vector were exposed to 20% or 1% O2 for 48 h, and immunoblot assays were performed.
Fig. 6.
Fig. 6.
NANOG expression in orthotopic breast tumors is dependent upon A2BR–PKCδ–STAT3 signaling. MDA-MB-231 subclones (2 × 10⁶ cells) transduced with NTC or either of two A2BR shRNA vectors (sh1 or sh4) were implanted into the MFP. When tumor volume reached 1,200 mm3, tumors were harvested for immunoblot assays.

Similar articles

Cited by

References

    1. Siegel RL, Miller KD, Jemal A, Cancer statistics, 2017. CA Cancer J Clin 67, 7–30 (2017). - PubMed
    1. Al-Hajj M, Wicha MS, Benito-Hernandez A, Morrison SJ, Clarke MF, Prospective identification of tumorigenic breast cancer cells. Proc Natl Acad Sci USA 100, 3983–3988 (2003). - PMC - PubMed
    1. Ponti D, et al. , Isolation and in vitro propagation of tumorigenic breast cancer cells with stem/progenitor cell properties. Cancer Res 65, 5506–5511 (2005). - PubMed
    1. Bozorgi A, Khazaei M, Khazaei MR, New findings on breast cancer stem cells: A review. J Breast Cancer 18, 303–312 (2015). - PMC - PubMed
    1. Al-Ejeh F, et al. , Breast cancer stem cells: Treatment resistance and therapeutic opportunities. Carcinogenesis 32, 650–658 (2011). - PubMed

Publication types

MeSH terms