. 2018 Sep 21;9(1):3847.
doi: 10.1038/s41467-018-06299-7.

A conformational sensor based on genetic code expansion reveals an autocatalytic component in EGFR activation

Affiliations

A conformational sensor based on genetic code expansion reveals an autocatalytic component in EGFR activation

Martin Baumdick et al. Nat Commun. .

Abstract

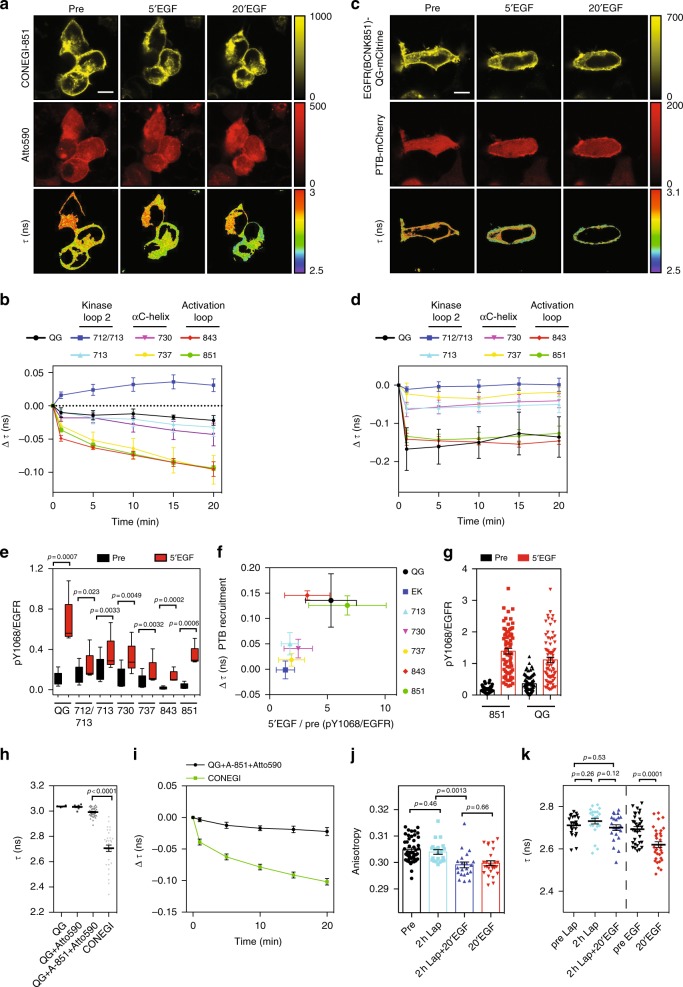
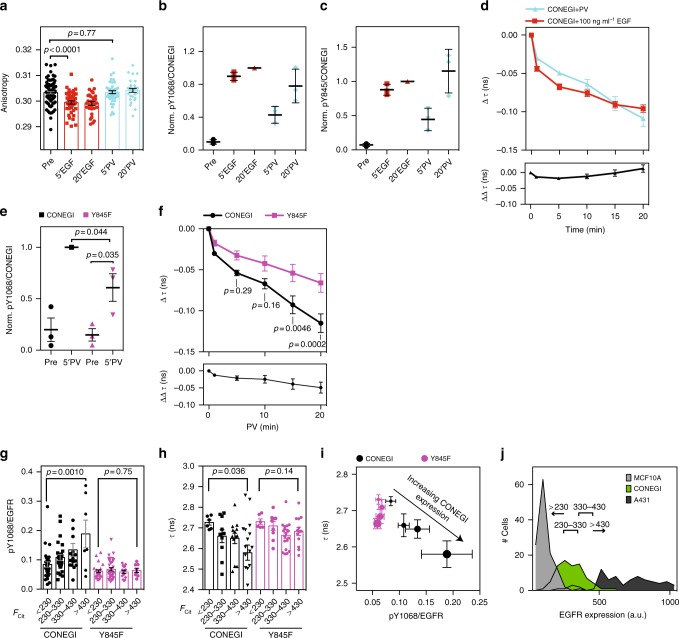
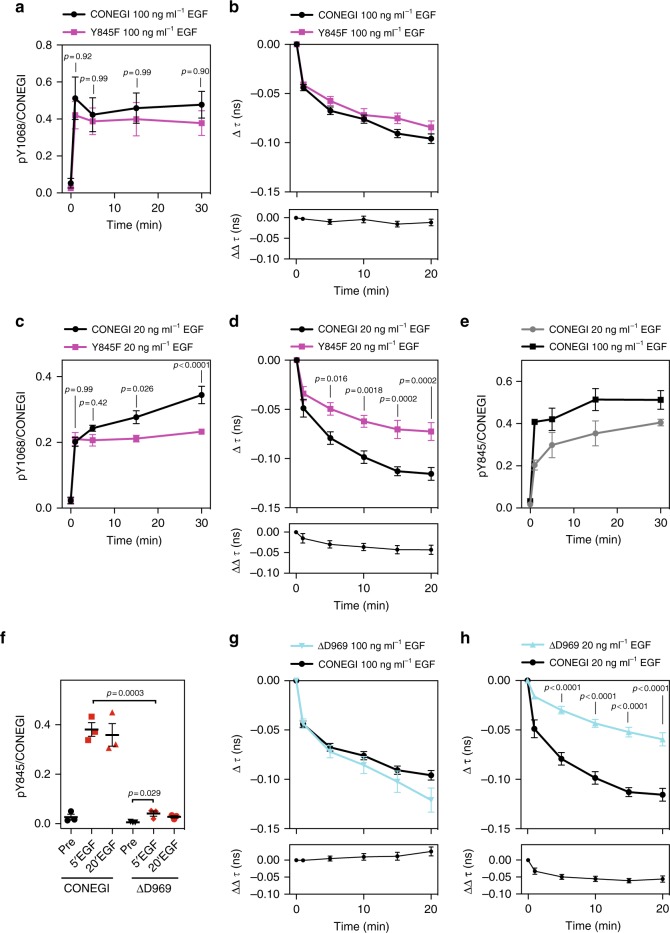
Epidermal growth factor receptor (EGFR) activation by growth factors (GFs) relies on dimerization and allosteric activation of its intrinsic kinase activity, resulting in trans-phosphorylation of tyrosines on its C-terminal tail. While structural and biochemical studies identified this EGF-induced allosteric activation, imaging collective EGFR activation in cells and molecular dynamics simulations pointed at additional catalytic EGFR activation mechanisms. To gain more insight into EGFR activation mechanisms in living cells, we develop a Förster resonance energy transfer (FRET)-based conformational EGFR indicator (CONEGI) using genetic code expansion that reports on conformational transitions in the EGFR activation loop. Comparing conformational transitions, self-association and auto-phosphorylation of CONEGI and its Y845F mutant reveals that Y845 phosphorylation induces a catalytically active conformation in EGFR monomers. This conformational transition depends on EGFR kinase activity and auto-phosphorylation on its C-terminal tail, generating a looped causality that leads to autocatalytic amplification of EGFR phosphorylation at low EGF dose.


Conflict of interest statement

The authors declare no competing interests.

Figures

Fig. 1
Fig. 1
Design and performance of CONEGI. a Schematic representation of CONEGI. mCitrine is fused to the C-terminal end of the tyrosine kinase domain (TKD) using a coiled-coil linker (dashed line) and Atto590 (red star) is site-specifically attached to the activation loop. b Alignment of active (red; PDB: 2J5F) and inactive (cyan; PDB: 2GS7) crystal structures of the EGFR TKD. mCitrine insertion (QG, yellow) and BCNK incorporation sites (blue, black arrows) are indicated. c Relative phosphorylation (PY72/EGFR) of EGFR-mCitrine or EGFR-QG-mCitrine upon EGF stimulation determined by western blot analysis (n = 4; two-way analysis of variance (two-way ANOVA)) (Supplementary Fig. 1b). d Fluorescence images and western blot analysis following SDS-PAGE of HEK293T cell lysates showing Atto590 fluorescence and expression level of EGFR-QG-mCitrine and CONEGIs depending on BCNK. Blots were probed with anti-EGFR and anti-Tubulin (left). Normalized relative EGFR expression (EGFR/Tub) (middle) and Atto590 fluorescence intensity (right) of EGFR-QG-mCitrine and CONEGIs (n = 3 blots). e Representative mCitrine and Atto590 fluorescence images of EGFR-QG-mCitrine and CONEGIs in HEK293T cells and corresponding green/magenta overlay. f Representative fluorescence images of EGFR(BCNK851)-QG-mCitrine upon tetrazine-Atto590 labeling and corresponding τ. g Mean τ in CONEGIs and EGFR-QG-mCitrine (QG: n = 10 cells; 712/713: n = 8; 713: n = 6; 730: n = 11; 737: n = 7; 843: n = 10; 851: n = 17) at the PM upon tetrazine-Atto590 addition. h Dependency of τ in CONEGIs and EGFR-QG-mCitrine (QG: n = 42 cells; 712/713: n = 36; 713: n = 43; 730: n = 36; 737: n = 30; 843: n = 44; 851: n = 32) on mean Atto590 fluorescence intensity (F of Atto590) at the PM after 20 min labeling. Data points represent individual cells. τ, fluorescence lifetime of mCitrine. Scale bars, 10 μm. EGF stimulation, 100 ng ml−1. Error bars: SEM, except Fig. 1c: Tukey box plot
Fig. 2
Fig. 2
CONEGI-851 reports on conformational changes in the activation loop. a Representative CONEGI-851 fluorescence and corresponding τ images upon EGF stimulation. b Change in Δτ of CONEGIs and EGFR-QG-mCitrine (QG: n = 5 cells; 712/713: n = 7; 713: n = 7; 730: n = 7; 737: n = 7; 843: n = 6; 851: n = 31) at the PM upon EGF stimulation (Supplementary Fig. 2a: absolute τ). c Representative fluorescence images of EGFR(BCNK851)-QG-mCitrine, PTB-mCherry, and corresponding τ upon EGF stimulation. d Change in Δτ of EGFR-QG-mCitrine or EGFR(BCNKXXX)-QG-mCitrine variants (QG: n = 4 cells; 712/713: n = 6; 713: n = 8; 730: n = 8; 737: n = 5; 843: n = 6; 851: n = 6) at the PM upon EGF-mediated PTB-mCherry recruitment. e Relative Y1068 phosphorylation (pY1068/EGFR) of EGFR-QG-mCitrine and CONEGIs upon EGF stimulation by western blot analysis (n = 5; paired two-tailed t-test) (Supplementary Fig. 2c). f Fold-change in Y1068 phosphorylation (5′EGF/pre) (quantified from e) versus Δτ upon PTB-mCherry recruitment (quantified from d) for CONEGIs and EGFR-QG-mCitrine. g Relative Y1068 phosphorylation (pY1068/EGFR) of EGFR-QG-mCitrine (QG) and EGFR(BCNK851)-QG-mCitrine (851) at the PM upon EGF stimulation by immunofluorescence (851: pre: n = 72 cells; 5′ÉGF: n = 67: QG: pre: n = 73; 5′ÉGF: n = 74) (Supplementary Fig. 2d). h τ of EGFR-QG-mCitrine in absence (QG; n = 6 cells) or presence of tetrazine-Atto590 (QG + Atto590; n = 9), EGFR-QG-mCitrine co-expressed with Atto590-labeled EGFR(BCNK851) (QG + A-851 + Atto590; n = 36) and CONEGI (n = 32; unpaired two-tailed t-test) (Supplementary Fig. 2f). i Change in Δτ of CONEGI (n = 27 cells) or EGFR-QG-mCitrine co-expressed with Atto590-labeled EGFR(BCNK851) (n = 7) upon EGF stimulation. j Mean mCitrine fluorescence anisotropy of CONEGI upon EGF stimulation in presence or absence of 1 μM Lapatinib (Lap) (Supplementary Fig. 2h) (N = 3 experiments; n = 21–26 fields of view/condition; unpaired two-tailed t-test). k τ of CONEGI at the PM upon EGF stimulation in presence (left; n = 22 cells) or absence (right; n = 33) of 1 μM Lap (unpaired two-tailed t-test). Scale bars, 10 μm. EGF stimulation, 100 ng ml−1. Error bars: SEM, except Fig. 2e: Tukey box plot. τ fluorescence lifetime of mCitrine
Fig. 3
Fig. 3
Y845 phosphorylation induces an active conformation of EGFR monomers. a Mean mCitrine fluorescence anisotropy of CONEGI upon EGF or pervanadate (PV) treatment (Supplementary Fig. 3a, b) (N = 3 experiments; n = 30–47 fields of view/condition; unpaired two-tailed t-test). b, c Normalized relative Y1068 (pY1068/CONEGI) (b) or pY845 phosphorylation (pY845/CONEGI) (c) of CONEGI upon EGF or PV treatment by western blot analysis (n = 3) (Supplementary Fig. 3e, f). d Change in Δτ of CONEGI (upper panel) at the PM and the difference between EGF and PV treatment (ΔΔτ) (lower panel) (EGF: n = 19 cells; PV: n = 6) (Supplementary Fig. 3g). e Normalized relative Y1068 phosphorylation (pY1068/CONEGI) of CONEGI or CONEGI-Y845F upon PV treatment by western blot analysis (n = 3; unpaired two-tailed t-test) (Supplementary Fig. 3i). f Change in Δτ of CONEGI and CONEGI-Y845F upon PV treatment (upper panel) and the difference (ΔΔτ) between CONEGI and CONEGI-Y845F (lower panel) (CONEGI: n = 6 cells; Y845F: n = 8; two-way ANOVA) (Supplementary Fig. 3h). g Relative Y1068 phosphorylation (pY1068/EGFR) of CONEGI and CONEGI-Y845F at increasing EGFR expression levels as measured by mCitrine intensity per cell (Fcit binned as follows: <230, 230–330, 330–430, >430) (CONEGI: n = 80 cells; Y845F: n = 81; unpaired two-tailed t-test). h Mean τ in CONEGI and CONEGI-Y845F at increasing EGFR expression levels (n = 47 cells/variant; unpaired two-tailed t-test). i Relative Y1068 phosphorylation (pY1068/EGFR) of CONEGI and CONEGI-Y845F versus their τ of mCitrine upon increasing expression levels (Fcit < 230, 230–330, 330–430, >430; as indicated by increasing dot size). j Distribution of relative EGFR expression in MCF10A (n = 125 cells), A431 (n = 129), and CONEGI-expressing HEK293T cells (n = 80) as derived from fluorescence histograms of EGF-Alexa647 binding per cell to the respective cell lines (Supplementary Figure 3k). EGF stimulation, 100 ng ml−1. PV treatment, 0,33 mM. Error bars: SEM. τ fluorescence lifetime of mCitrine
Fig. 4
Fig. 4
EGFR dimers can induce autocatalytic activation of EGFR monomers. a Relative Y1068 phosphorylation (pY1068/CONEGI) of CONEGI and CONEGI-Y845F upon stimulation with 100 ng ml−1 EGF by western blot analysis (n = 4; two-way ANOVA) (Supplementary Fig. 4b). b Change in Δτ of CONEGI and CONEGI-Y845F at the PM (upper panel) upon stimulation with 100 ng ml−1 EGF and the difference (ΔΔτ) between CONEGI and CONEGI-Y845F (lower panel) (CONEGI: n = 19 cells; Y845F: n = 8) (Supplementary Fig. 4d). c Relative Y1068 phosphorylation (pY1068/CONEGI) of CONEGI and CONEGI-Y845F upon stimulation with 20 ng ml−1 EGF by western blot analysis (n = 4; two-way ANOVA) (Supplementary Fig. 4b). d Change in Δτ of CONEGI and CONEGI-Y845F at the PM upon stimulation with 20 ng ml−1 EGF (upper panel) and the difference (ΔΔτ) between CONEGI and CONEGI-Y845F (lower panel) (CONEGI: n = 6 cells; Y845F: n = 7; two-way ANOVA) (Supplementary Fig. 4e). e Relative Y845 phosphorylation (pY845/CONEGI) of CONEGI upon stimulation with 20 and 100 ng ml−1 EGF by western blot analysis (n = 3) (Supplementary Fig. 4f). f Relative Y845 phosphorylation (pY845/CONEGI) of CONEGI and CONEGI-ΔD969 upon stimulation with 100 ng ml−1 EGF by western blot analysis (n = 3; unpaired two-tailed t-test) (Supplementary Fig. 4h). g, h Change in Δτ of CONEGI-ΔD969 and CONEGI at the PM upon stimulation with 20 (h) and 100 ng ml−1 EGF (g) (upper panel) and the difference (ΔΔτ) between CONEGI and CONEGI-ΔD969 (lower panel) (CONEGI: 20 ng ml−1 EGF: n = 6 cells; 100 ng ml−1 EGF: n = 19; ΔD969: 20 ng ml−1 EGF: n = 9; 100 ng ml−1: n = 6; two-way ANOVA) (Supplementary Fig. 4i). Error bars: SEM. τ fluorescence lifetime of mCitrine

References

    1. Schlessinger J. Ligand-induced, receptor-mediated dimerization and activation of EGF receptor. Cell. 2002;110:669–672. doi: 10.1016/S0092-8674(02)00966-2. - DOI - PubMed
    1. Zhang X, Gureasko J, Shen K, Cole PA, Kuriyan J. An allosteric mechanism for activation of the kinase domain of epidermal growth factor receptor. Cell. 2006;125:1137–1149. doi: 10.1016/j.cell.2006.05.013. - DOI - PubMed
    1. Wagner MJ, Stacey MM, Liu BA, Pawson T. Molecular mechanisms of SH2- and PTB-domain-containing proteins in receptor tyrosine kinase signaling. Cold Spring Harb. Perspect. Biol. 2013;5:a008987. doi: 10.1101/cshperspect.a008987. - DOI - PMC - PubMed
    1. Batzer AG, Blaikie P, Nelson K, Schlessinger J, Margolis B. The phosphotyrosine interaction domain of Shc binds an LXNPXY motif on the epidermal growth factor receptor. Mol. Cell. Biol. 1995;15:4403–4409. doi: 10.1128/MCB.15.8.4403. - DOI - PMC - PubMed
    1. Ferguson KM, et al. EGF activates its receptor by removing interactions that autoinhibit ectodomain dimerization. Mol. Cell. 2003;11:507–517. doi: 10.1016/S1097-2765(03)00047-9. - DOI - PubMed

Publication types

Substances