. 2018 Sep 21;9(1):3849.
doi: 10.1038/s41467-018-06248-4.

A tissue-specific self-interacting chromatin domain forms independently of enhancer-promoter interactions

Affiliations

A tissue-specific self-interacting chromatin domain forms independently of enhancer-promoter interactions

Jill M Brown et al. Nat Commun. .

Abstract

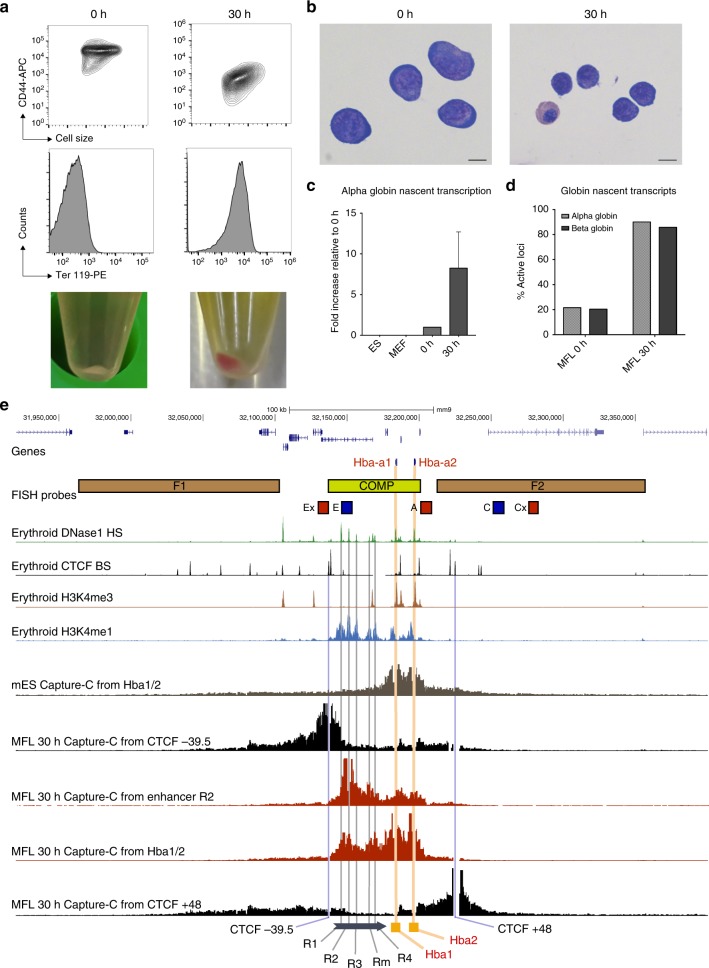
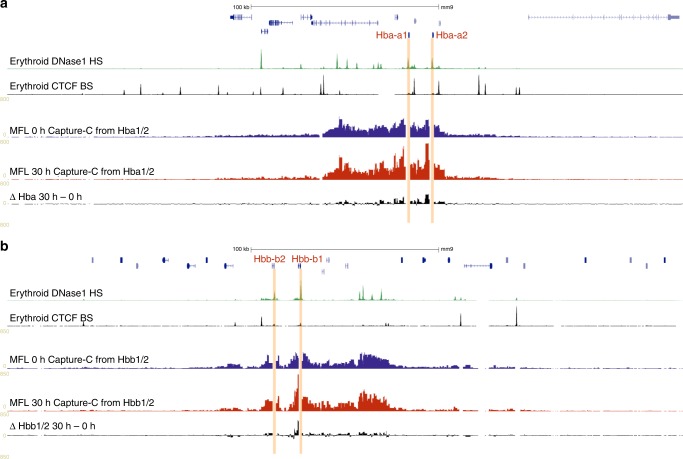
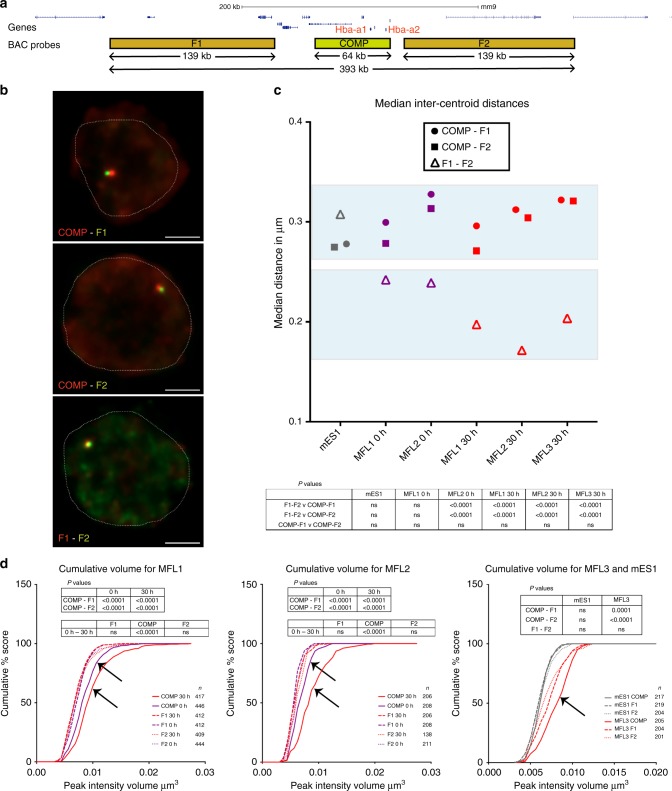
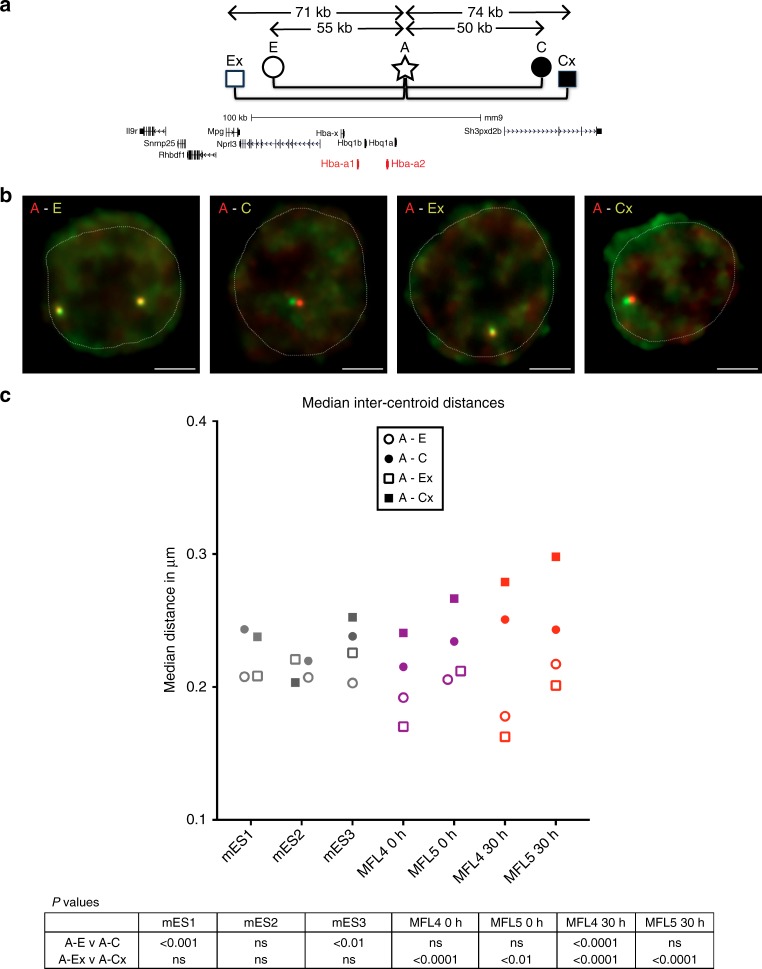
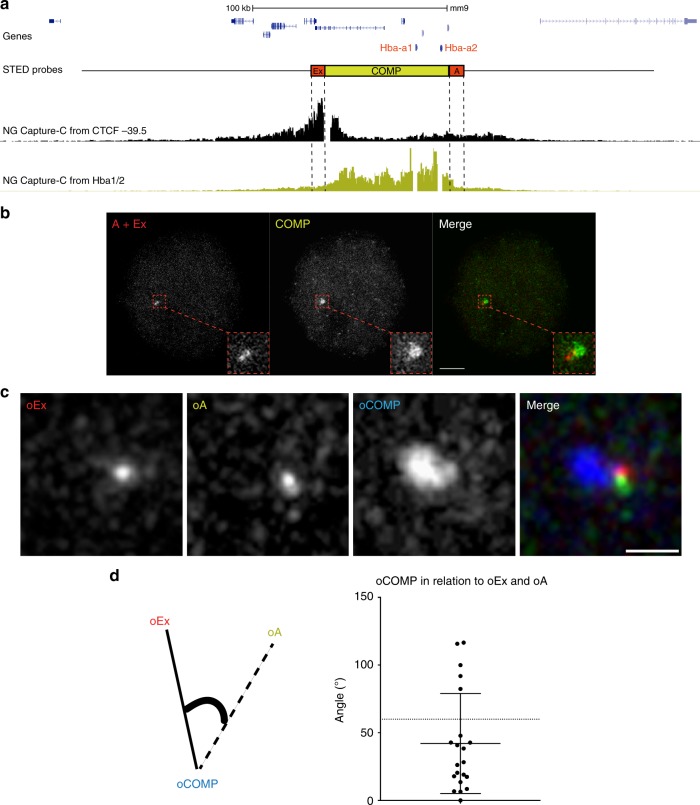
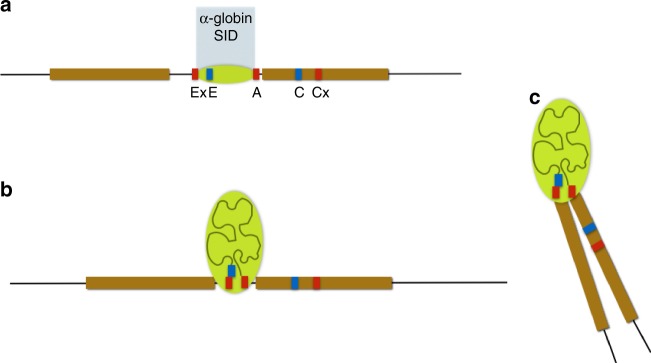
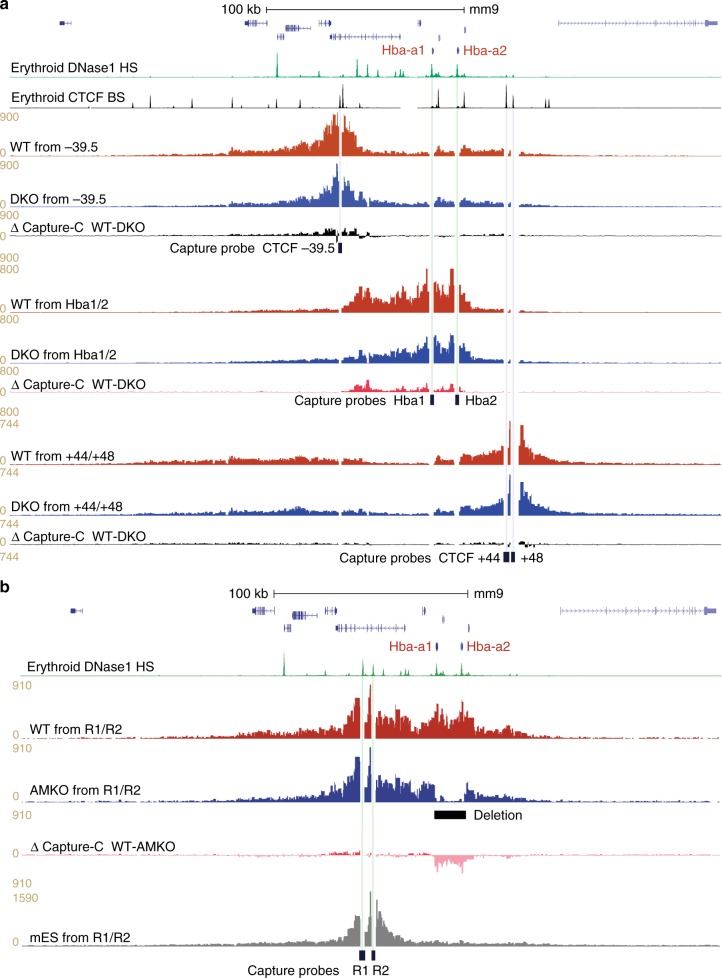
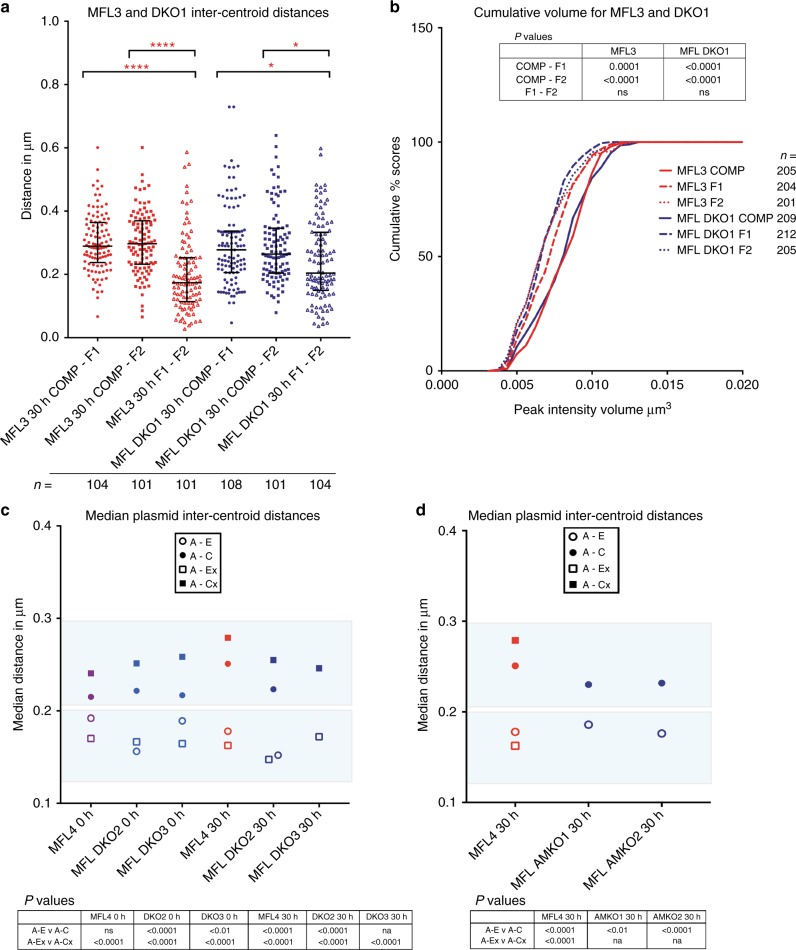
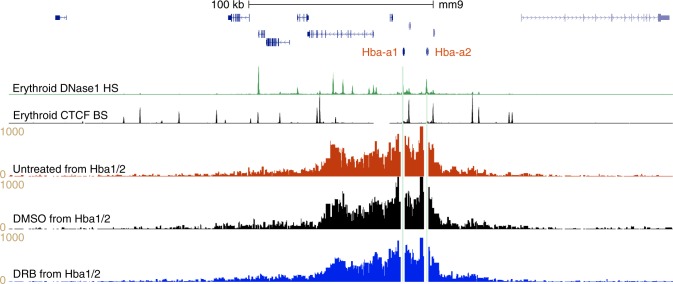
Self-interacting chromatin domains encompass genes and their cis-regulatory elements; however, the three-dimensional form a domain takes, whether this relies on enhancer-promoter interactions, and the processes necessary to mediate the formation and maintenance of such domains, remain unclear. To examine these questions, here we use a combination of high-resolution chromosome conformation capture, a non-denaturing form of fluorescence in situ hybridisation and super-resolution imaging to study a 70 kb domain encompassing the mouse α-globin regulatory locus. We show that this region forms an erythroid-specific, decompacted, self-interacting domain, delimited by frequently apposed CTCF/cohesin binding sites early in terminal erythroid differentiation, and does not require transcriptional elongation for maintenance of the domain structure. Formation of this domain does not rely on interactions between the α-globin genes and their major enhancers, suggesting a transcription-independent mechanism for establishment of the domain. However, absence of the major enhancers does alter internal domain interactions. Formation of a loop domain therefore appears to be a mechanistic process that occurs irrespective of the specific interactions within.


Conflict of interest statement

The authors declare no competing interests.

Figures

Fig. 1
Fig. 1
Description of the mouse foetal liver-derived erythroblast populations and of the active murine α-globin locus. a Representative FACS plots of MFL erythroblasts defined by CD44/cell size and Ter119, at 0 h and after a further 30 h differentiation in vitro, identifying distinct populations at the two timepoints. Bottom images are representative cell pellets at the two timepoints demonstrating the presence of haemoglobin at MFL 30 h. b Representative cytospins of the MFL 0 h and 30 h cultures. Scale bar 5 μm. c Nascent Hba transcription relative to 18s in the cell types and MFL timepoints indicated, from 3 biological replicates. Error bar is standard deviation. d RNA-FISH analysis of nascent transcription from the α-globin and β-globin genes at MFL 0 h and 30 h. n = 388 at MFL0h and 416 at MFL30h. e Map of the gene dense murine α-globin locus with Hba genes highlighted in red and positions of the FISH probes used in brown and lime green (BAC probes) and red and blue (plasmid probes). Gene browser tracks depict DNase1 hypersensitive sites (HS green), CTCF-binding sites (BS black), H3K4me3 (brown) and H3K4me1 (blue). NG Capture-C derived interaction frequencies are shown in mES cells from the Hba1/2 viewpoints (grey), and in MFL 30 h from viewpoints (CTCF BS -39.5 (black), MCS-R1 (red), Hba1/2 (red) and CTCF BS + 48 (black). The location of the Hba genes, the five murine enhancer elements and the CTCF BS −39.5 and +48 are marked against the browser tracks in yellow, grey and blue vertical bars, respectively
Fig. 2
Fig. 2
Self-interacting domains are already formed at globin loci in MFL 0 h erythroblasts. a NG Capture-C tracks using Hba1/2 as viewpoints in MFL erythroblasts at 0 h (blue) and 30 h (red) with a differential track (black) showing minimal changes between the two timepoints. b NG Capture-C tracks using Hbb1/2 as viewpoints in MFL erythroblasts at 0 h and 30 h with a differential track showing minimal changes between the two timepoints
Fig. 3
Fig. 3
Volume and proximity measurements across the α-globin locus in WT mice. a Gene map and locations of the BAC FISH probes to scale, with genomic distances encompassed. b Representative images for the three BAC probe pairs in MFL 30 h erythroblasts with nuclei delineated (white dotted line). Scale bar 2 μm. c Median inter-centroid distances between the three probe pairs indicated, in mES cells (grey) and erythroblasts at 0 h (purple) and 30 h (red) timepoints. MFL1, 2 and 3 represent cultures from three individual foetal livers. Light blue shading emphasises proximity of the flanking regions F1–F2 in erythroblasts. n = 87–236 — see Supplementary Fig. 3 for the complete data set. d Cumulative frequency plots of BAC signal volumes in mES cells (grey) and erythroblasts at 0 h (purple) and 30 h (red). COMP values indicating expanded volume are arrowed. All P values are derived by a Kruskal–Wallis test with Dunn’s multiple comparisons. ns not significant
Fig. 4
Fig. 4
Proximity measurements at the α-globin locus in mouse WT cells. a Gene map with plasmid FISH probe locations showing the pairwise combinations used to measure inter-probe distances. Using probe A as a point of reference, measurements were made to the domain side (E, Ex) of probe A compared to the control non-interacting side (C, Cx). Genomic distances between midpoints of the probe pairs are shown. b Representative images of RASER-FISH hybridisation signals for the four plasmid probe pairs in MFL 30 h erythroblasts. White dotted line delineates nuclei. Scale bar 2 μm. c Median inter-centroid distances measured between the four probe pairs in three different cell types, mES1–3 (grey), MFL4–5 0 h (purple) and MFL4-5 30 h (red). p values, derived by a Kruskal–Wallis test with Dunn’s multiple comparisons, are shown. See Supplementary Fig. 4 for full data with statistical analyses. At MFL 0 h and 30 h but not mES, the distance between A and Ex is consistently statistically shorter (p < 0.0001) than A to Cx
Fig. 5
Fig. 5
Super-resolution imaging of the α-globin domain. a Gene map with FISH probe Ex, COMP and A locations marked against NG Capture-C tracks depicting interactions at MFL 30 h from the viewpoints CTCF BS -39.5 (black) and Hba1/2 promoters (lime green). b 2D STED maximum intensity projection images of FISH probes A and Ex (both red) which flank the α-globin domain, the COMP BAC (green) defining the extent of the domain and a merged image showing a cloud of domain signal distinct from the paired probes A and Ex. Scale bar 2 μm. c Three-colour 3D STED maximum intensity projection images of oligonucleotide probe pools (oEx, oCOMP and oA) designed to match the probe set shown in a. The oCOMP probe (blue) detects a cloud of signal that is distinct from the adjacent probes oEx (red) and oA (green). Scale bar 0.5 μm. d A drawing describes the angle measured in Euclidean 3D space between vectors joining the oCOMP signal with oEx and oA. The angles measured are charted on the right, with a median of 42°, well below an expected 60° for a random distribution. n = 28
Fig. 6
Fig. 6
A schematic model of the alpha globin locus. Schematic model showing the α-globin self-interacting domain (SID) (lime green). Sites detected by FISH probes are as for Fig. 1. a represents the linear locus, while b and c depict conformations of the self-interacting domain, where the domain expands as chromatin decompacts and the flanking regions can sit in proximity
Fig. 7
Fig. 7
The α-globin domain still forms in the absence of elements critical for α-globin expression. a Gene map with DNase1 HS (green) and CTCF BS (black) genome browser tracks, followed by NG Capture-C tracks highlighting interactions from CTCF BS −39.5, Hba1/2 and CTCF BS + 44/48 viewpoints in 30 h  MFL WT (red) and MFL DKO (homozygous deletions for MCS-R1/R2) (blue), with differential tracks (Δ) showing persistence of domain structure when viewed from CTCF sites even though interaction frequencies internal to the domain are affected. b Gene map with DNase1 HS (green) followed by NG Capture-C tracks highlighting interactions from MCS-R1/R2 viewpoint in MFL WT (red) and MFL AMKO (blue), with a differential track (Δ) showing persistence of domain structure in AMKO when contrasted with the absence of a domain observed in mES cells (grey)
Fig. 8
Fig. 8
The α-globin domain still forms in the absence of elements critical for α-globin expression. a Pairwise inter-centroid distances between three BAC probes in 30 h erythroblasts derived from littermates MFL3 (WT) and DKO1 (homozygous deletions for MCS-R1/R2). F1–F2 are significantly closer than COMP-F1 and COMP-F2 in both WT (p < 0.0001 for both) and DKO1-derived erythroblasts (p = 0.0374 and 0.0468 respectively). Total number of measurements is indicated by ‘n’. b Cumulative frequency plots of BAC signal volumes in 30 h erythroblasts from MFL3 and DKO1. The larger COMP volumes are arrowed. Total number of measurements is indicated by ‘n’. c Median inter-centroid distances between four plasmid probe pairs at MFL 0 h and 30 h from littermates WT MFL4 and two homozygous double knockout embryos DKO2 and DKO3. Light blue shading emphasises the shorter distances within the self-interacting domain in both WT and knockouts. See Supplementary Fig. 6 for the complete data set. d Median inter-centroid distances between plasmid probe pairs A-Ex (represented as A-E distance because of a 16 kb α-globin gene deletion) and A-C at MFL 30 h in two α-globin knockout lines from littermates AMKO1 and AMKO2, plotted against WT MFL4. Light blue shading is as for c. See Supplementary Fig. 6 for full data. All p values are derived by a Kruskal–Wallis test with Dunn’s multiple comparisons. ns not significant
Fig. 9
Fig. 9
Transcriptional elongation is not required for the maintenance of domain structure. Gene map with DNase1 HS (green) and CTCF BS (black) genome browser tracks, followed by NG Capture-C tracks from the Hba1/2 viewpoints in MFL 30 h cells untreated (red) and cultured for 3 h in presence of control DMSO (black) and DRB (blue), showing retention of interaction frequencies within the domain despite loss of transcription

References

    1. Dixon JR, et al. Topological domains in mammalian genomes identified by analysis of chromatin interactions. Nature. 2012;485:376–380. doi: 10.1038/nature11082. - DOI - PMC - PubMed
    1. Nora EP, et al. Spatial partitioning of the regulatory landscape of the X-inactivation centre. Nature. 2012;485:381–385. doi: 10.1038/nature11049. - DOI - PMC - PubMed
    1. Dowen JM, et al. Control of cell identity genes occurs in insulated neighborhoods in mammalian chromosomes. Cell. 2014;159:374–387. doi: 10.1016/j.cell.2014.09.030. - DOI - PMC - PubMed
    1. Phillips-Cremins JE, et al. Architectural protein subclasses shape 3D organization of genomes during lineage commitment. Cell. 2013;153:1281–1295. doi: 10.1016/j.cell.2013.04.053. - DOI - PMC - PubMed
    1. Rao SS, et al. A 3D map of the human genome at kilobase resolution reveals principles of chromatin looping. Cell. 2014;159:1665–1680. doi: 10.1016/j.cell.2014.11.021. - DOI - PMC - PubMed

Publication types