. 2018 Sep 21;8(1):14190.
doi: 10.1038/s41598-018-31170-6.

Mitochondrial transcription factor A (TFAM) shapes metabolic and invasion gene signatures in melanoma

Affiliations

Mitochondrial transcription factor A (TFAM) shapes metabolic and invasion gene signatures in melanoma

L F Araujo et al. Sci Rep. .

Abstract

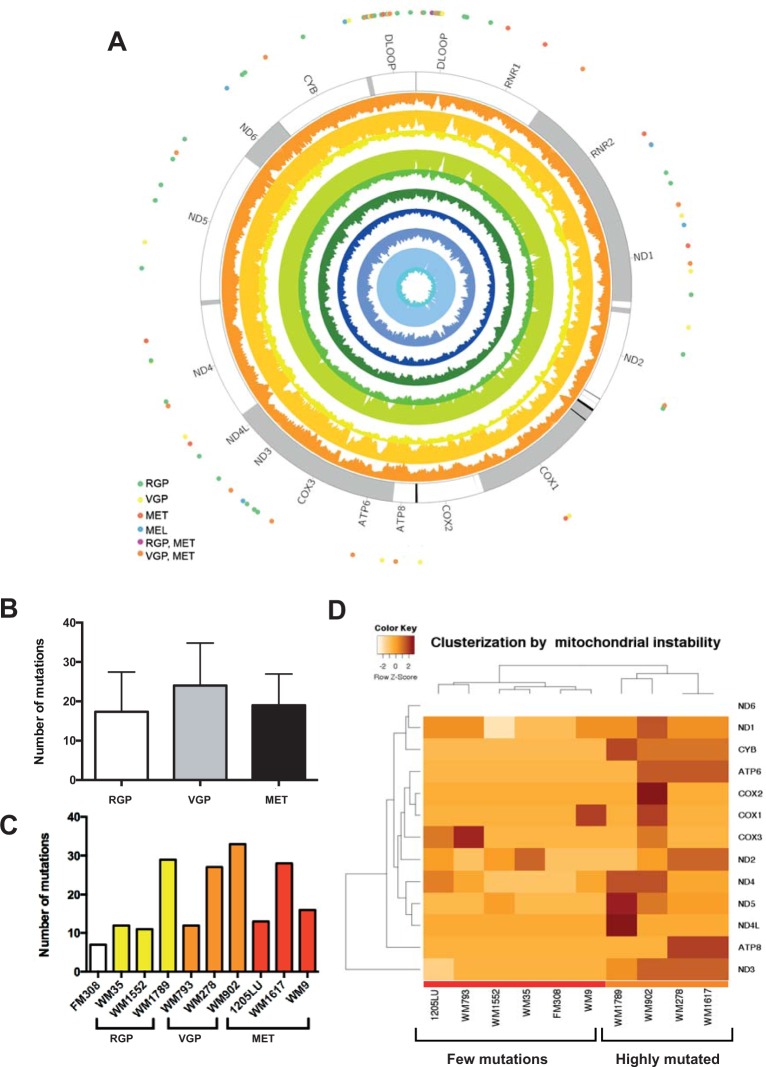
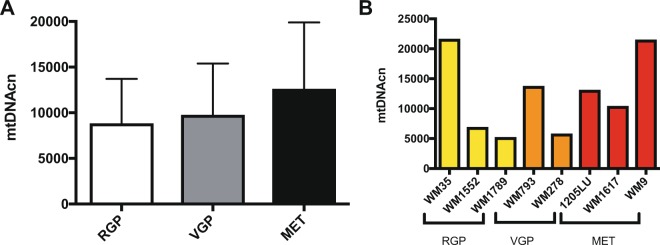
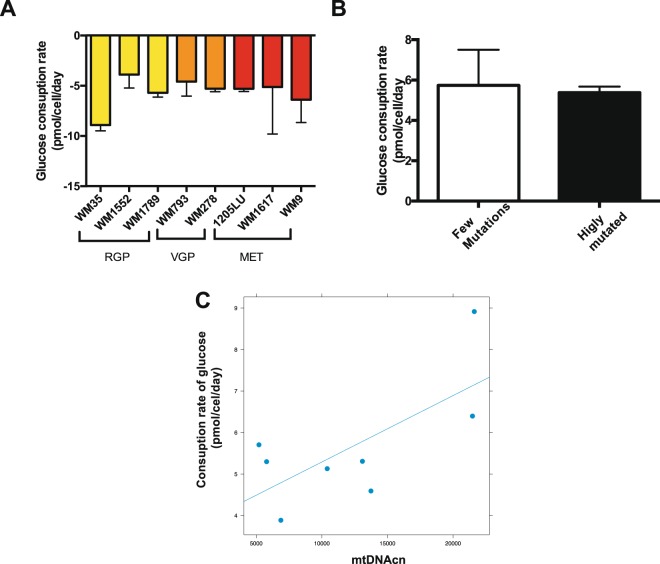
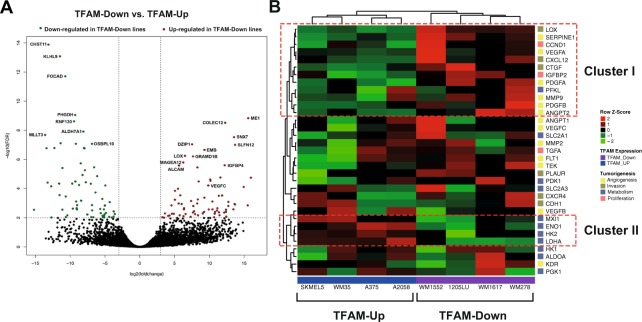
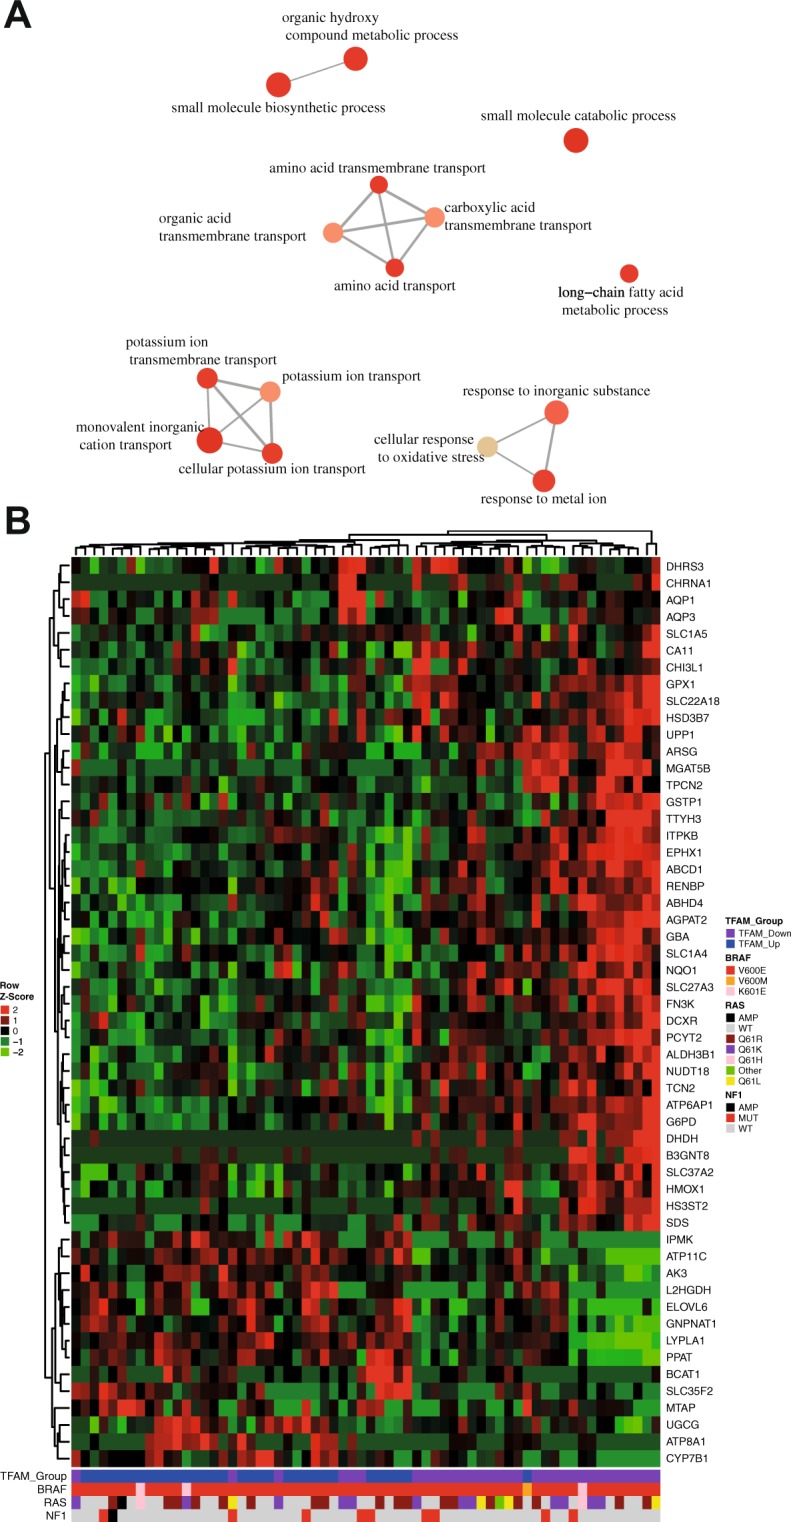
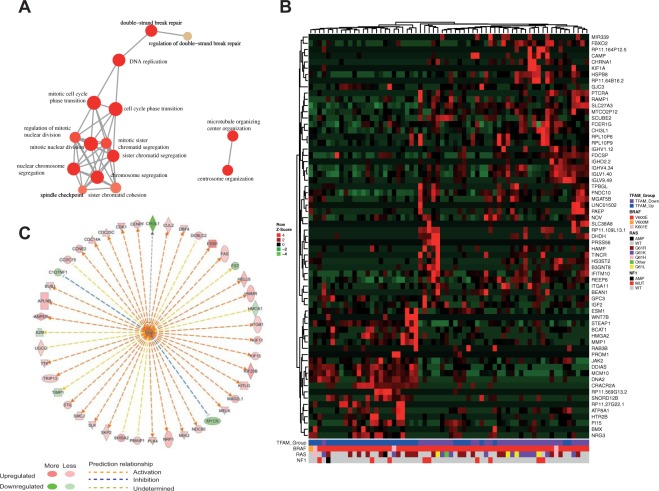
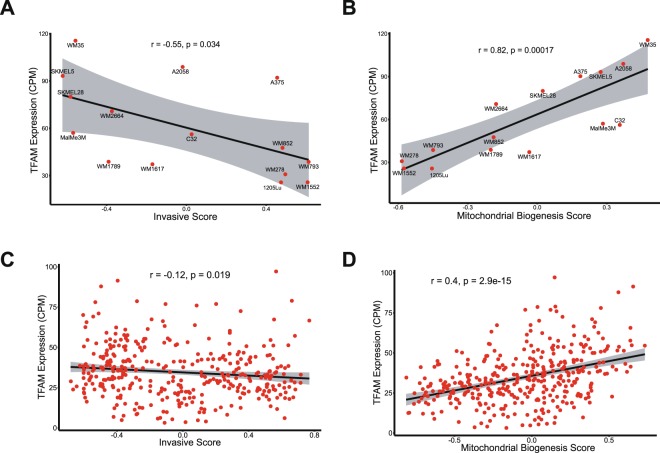
Mitochondria are central key players in cell metabolism, and mitochondrial DNA (mtDNA) instability has been linked to metabolic changes that contribute to tumorigenesis and to increased expression of pro-tumorigenic genes. Here, we use melanoma cell lines and metastatic melanoma tumors to evaluate the effect of mtDNA alterations and the expression of the mtDNA packaging factor, TFAM, on energetic metabolism and pro-tumorigenic nuclear gene expression changes. We report a positive correlation between mtDNA copy number, glucose consumption, and ATP production in melanoma cell lines. Gene expression analysis reveals a down-regulation of glycolytic enzymes in cell lines and an up-regulation of amino acid metabolism enzymes in melanoma tumors, suggesting that TFAM may shift melanoma fuel utilization from glycolysis towards amino acid metabolism, especially glutamine. Indeed, proliferation assays reveal that TFAM-down melanoma cell lines display a growth arrest in glutamine-free media, emphasizing that these cells rely more on glutamine metabolism than glycolysis. Finally, our data indicate that TFAM correlates to VEGF expression and may contribute to tumorigenesis by triggering a more invasive gene expression signature. Our findings contribute to the understanding of how TFAM affects melanoma cell metabolism, and they provide new insight into the mechanisms by which TFAM and mtDNA copy number influence melanoma tumorigenesis.


Conflict of interest statement

The authors declare no competing interests.

Figures

Figure 1
Figure 1
mtDNA mutational analysis in primary melanocytes and melanoma cell lines. (A) Circos plot of the mtDNA. External dots represent all the 86 mutation events in corresponding genes, and inner circular plots represent the average coverage of the sequencing for each cell line in the following order (from inside): FM308, WM35, WM1552, WM1789, WM278, WM793, WM902, 1205Lu, WM1617 and WM9; (B) There was no difference in the mtDNA mutation load among the melanoma stages (p = 0.6969, Kruskal-Wallis test); (C) Total number of mtDNA mutations per cell line. Note that mutation rates varied independently of the melanoma stage; (D) Unsupervised hierarquical clustarization analysis using the frequency of mutations in protein-coding genes. The clustarization was able to distinguish two mutated cell lines clusters (color bar at the bottom). Red color bar shows the cell line cluster with few mutations and the orange color bar the mtDNA highly mutated cluster. ND6 row is blank because the ND6 gene was hit by only one synonymous mutations in all cell lines, therefore there was not variation among the cell lines (Supplementary Table S1). Note in C, that genetically paired cell lines (WM793/1205Lu and WM278/WM1617) consistently showed equal number of mutations between the members of each pair. RGP: Radial Growth Phase; VGP: Vertical Growth Phase; MET: Metastatic Melanoma.
Figure 2
Figure 2
mtDNA copy number analysis in the melanoma cell lines. (A) Average mtDNA content of melanoma cell lines per staging (RGP, VGP and metastatic stages) (p = 0.9873, Kruskal-Wallis test); (B) Average mtDNA copy number for each cell line. RGP: Radial Growth Phase; VGP: Vertical Growth Phase; MET: Metastatic Melanoma; mtDNAcn: Mitochondrial DNA copy number.
Figure 3
Figure 3
Rates of ATP content in the melanocyte and melanoma cell lines. (A) ATP basal levels in the melanocyte and melanoma cell lines. Oligomycin treatment was used as a control of the reaction. (B) Average basal levels of ATP in the two groups of cell lines clustered according to mtDNA mutation clusters (p = 0.06, Student t test); (C) Correlation between ATP levels and mtDNAcn (r = 0.86, p = 0.002, Pearson Correlation).RGP: Radial Growth Phase; VGP: Vertical Growth Phase; MET: Metastatic Melanoma; mtDNAcn: Mitochondrial DNA copy number. ATP measurements were performed in the following melanoma cell lines: WM35, WM1552, WM1789, WM793, WM278, 1205Lu, WM1617 and WM9.
Figure 4
Figure 4
Glucose consumption rates in melanoma cell lines. (A) Glucose consuption rates (qGlc) for the indicated melanoma cell lines. The negative number indicates consuption of the metabolite over a period of 24 hours. (B) Average glucose consuption rates for the mtDNA mutated clusters of cell lines (p = 0.7480, Student t test); (C) Positive correlation between qGlc and mtDNAcn (r = 0.693, p = 0.0282, Pearson Correlation); For the B and C graphs we ploted the absolute number of qGlc. RGP: Radial Growth Phase; VGP: Vertical Growth Phase; MET: Metastatic Melanoma; mtDNAcn: Mitochondrial DNA copy number. Glucose consumption rates were evaluated in the following melanoma cell lines: WM35, WM1552, WM1789, WM793, WM278, 1205Lu, WM1617 and WM9.
Figure 5
Figure 5
Differential expression analysis in melanoma cell lines with different TFAM expression, joining transcriptomic data generated by our group and by Pawlikowski et al.. (A) Volcano plot showing the highly different expressed genes up (red dots) and down-regulated (green dots) in TFAM down cell lines; (B) Heatmap with the gene expression pattern of the HIF-α main targets, that were categorazed according with their role in tumorigenesis. The analysis revealed two distinct genes clusters, highlighted in dotted red lines. FDR: False discovery rate.
Figure 6
Figure 6
Differential expression analysis of metabolic enzymes between TFAM-Up and TFAM-Down in metastatic melanoma. (A) Gene ontology pathways enriched with the differentially expressed enzymes. Each circle represents gene pathways and correlated pathways are linked. The sizes of the circles are proportional to the enrichment analysis p-values; (B) Heatmap showing the top 54 genes differently expressed between TFAM up and down metastatic melanoma samples. Color bar at the bottom indicates the presence of mutations in BRAF, RAS and NF1 genes. AMP: Gene Amplification; WT: Wild-type; MUT: Mutated.
Figure 7
Figure 7
Proliferation assay of melanoma cell lines in different L-glutamine availability. TFAM-up melanoma cell line (WM35) had a similar growth under different L-glutamine availability (A) until 120 h (p < 0.0001), whereas cells cultured in media with glutamine grow more. On the other hand, there was a growth arrest in TFAM-down cell line (WM1552) in glutamine-free media at 96 h (p = 0.0004) that continued for 120 h (p < 0.0001). In all statistical analysis it was performed a two-way-ANOVA followed by Sidak’s multiple comparison test.
Figure 8
Figure 8
Differential expression analysis between TFAM-Up and TFAM-Down metastatic melanoma tumors from TCGA. (A) Gene ontology pathways enriched with the DEGs. Each circle represents gene pathways and correlated pathways are linked. The sizes of the circles are proportional to the enrichment analysis p-values; (B) Heatmap showing the top 65 genes differently expressed between the groups. Color bar at the bottom indicates the presence of mutations in BRAF, RAS and NF1 genes; (C) Upstream analysis plot representing the VEGF gene family (center) and its targets that were differently expressed in the analysis. Red circles indicate higher expression and green circles lower expression of the respective gene, as for the arrows, orange arrows indicate that VEGF was predicted to activate the gene and the blue arrow indicate that VEGF was predicted to inhibited. AMP: Gene Amplification; WT: Wild-type; MUT: Mutated.
Figure 9
Figure 9
Correlation of TFAM expression with invasive and mitochondrial biogenesis signatures. Correlation analysis showed a negative correlation of TFAM expression with invasive signature in both melanoma cell lines (r = −0.55; p = 0.034) (A) and TCGA metastatic melanoma samples (r = −0.12; p = 0.019) (C). TFAM expression was also positive correlated with mitochondrial biogenesis in both cell lines (r = 0.82; p = 0.00017) (B) and TCGA data (r = 0.4; p = 2.9 × 10−15) (D).

References

    1. Zaidi MR, Day C-P, Merlino G. From UVs to metastases: modeling melanoma initiation and progression in the mouse. J. Invest. Dermatol. 2008;128:2381–2391. doi: 10.1038/jid.2008.177. - DOI - PubMed
    1. Akbani R, et al. Genomic Classification of Cutaneous Melanoma. Cell. 2015;161:1681–1696. doi: 10.1016/j.cell.2015.05.044. - DOI - PMC - PubMed
    1. Hodis E, et al. A landscape of driver mutations in melanoma. Cell. 2012;150:251–263. doi: 10.1016/j.cell.2012.06.024. - DOI - PMC - PubMed
    1. Hayward NK, et al. Whole-genome landscapes of major melanoma subtypes. Nature. 2017;545:175–180. doi: 10.1038/nature22071. - DOI - PubMed
    1. Haq R, et al. Oncogenic BRAF Regulates Oxidative Metabolism via PGC1α and MITF. Cancer Cell. 2013;23:302–315. doi: 10.1016/j.ccr.2013.02.003. - DOI - PMC - PubMed

Publication types

MeSH terms