. 2018 Sep 21;9(1):3838.
doi: 10.1038/s41467-018-06193-2.

Positive cardiac inotrope omecamtiv mecarbil activates muscle despite suppressing the myosin working stroke

Affiliations

Positive cardiac inotrope omecamtiv mecarbil activates muscle despite suppressing the myosin working stroke

Michael S Woody et al. Nat Commun. .

Abstract

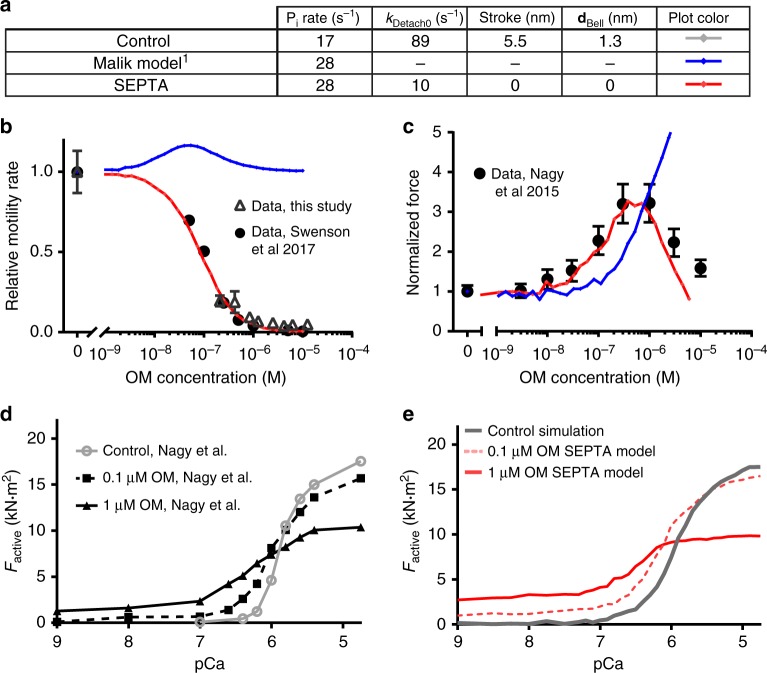
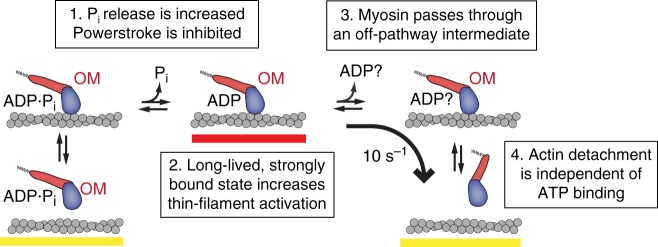
Omecamtiv mecarbil (OM) is a positive cardiac inotrope in phase-3 clinical trials for treatment of heart failure. Although initially described as a direct myosin activator, subsequent studies are at odds with this description and do not explain OM-mediated increases in cardiac performance. Here we show, via single-molecule, biophysical experiments on cardiac myosin, that OM suppresses myosin's working stroke and prolongs actomyosin attachment 5-fold, which explains inhibitory actions of the drug observed in vitro. OM also causes the actin-detachment rate to become independent of both applied load and ATP concentration. Surprisingly, increased myocardial force output in the presence of OM can be explained by cooperative thin-filament activation by OM-inhibited myosin molecules. Selective suppression of myosin is an unanticipated route to muscle activation that may guide future development of therapeutic drugs.


Conflict of interest statement

The authors declare no competing interests.

Figures

Fig. 1
Fig. 1
Biochemical cycle of cardiac myosin. Omecamtiv mecarbil has been shown to increase the rate of phosphate release (step 5) and bias the ATP hydrolysis step (step 3) towards the post-hydrolysis M·ADP·Pi state, which is proposed to cause myosin to enter the strong binding states (red underline) more rapidly. Other biochemical steps have been previously shown through stop-flow biochemical experiments to be nearly unchanged by the presence of OM. Inset: Example optical trapping trace of the position (median filtered with 0.4 ms window) of an actin filament during one interaction with a single-myosin molecule reproduced from Fig. 2b. The step size and attachment duration of these interactions can be measured as shown
Fig. 2
Fig. 2
The effect of OM on myosin working stroke size. a Example trace of the position of one bead during several interactions of cardiac myosin with actin in the absence of OM (blue). The covariance of the two beads’ positions is shown in black and was used to determine when a binding event occurred, as indicated by the dark horizontal lines above the position trace. b An expanded section of the data inside the dashed box in a, where two clear interactions can be visualized. c, d Example trace similar to that in a and b, but with 10 μM OM present. The interactions are more difficult to distinguish in the position trace (red) but are clear from the covariance (black). Position traces in ad are median filtered with a 0.4 ms window. e Binding events were synchronized at their starts and averaged forward in time to show the average stroke size observed in the presence of OM ranging from 0 to 10 μM. Average stroke size decreases with increasing OM concentration. f The average observed stroke size was decreased by OM in a dose-dependent manner. Error bars give the standard deviation of the mean step sizes from each molecule observed. N-values are presented in Supplementary Table 1
Fig. 3
Fig. 3
Actin-attachment durations as a function of OM concentration. a Cumulative distributions of the actomyosin attachment durations (solid lines) at 4 mM MgATP. Without OM, the attachment durations are well-described by a single-exponential distribution (dotted blue line); however, at 100 nM and 10 μM OM, double exponential distributions were required (yellow and red dashed lines). Inset: 100 nM OM durations on logarithmic x-scale, highlighting the two phases of detachment. b Concentration-dependent effect of OM prolonging the mean observed attachment duration (black) at 4 mM MgATP. Black error bars show the standard deviation of the mean durations from each molecule. Red squares show the expected duration calculated from the global fit to durations. c The fraction of events which were found to detach at ka, (black), or at the OM-associated rate (kb, red) from the durations global fit as a function of OM concentration. d Observed step size linearly correlates with the fraction of events which detach at the OM-associated rate, kb. Vertical error bars are the standard deviation of the mean step from each molecule studied. e Detachment rates at 10 μM OM as a function of MgATP concentration. Rate ka (blue) was proportional to MgATP concentration at low ATP concentrations. Rate kb (red) was only observed in the presence of the drug and was independent of the ATP concentration at all concentrations studied. Unless otherwise noted, error bars from all panels show the 95% confidence intervals obtained via bootstrapping. N-values are presented in Supplementary Table 1
Fig. 4
Fig. 4
Force dependence of detachment is reduced by OM. a, b Example traces of force on the motor bead (blue, red) with the trap’s isometric feedback system engaged. Events, as detected by covariance, are indicated by dark lines above the force traces. a In the absence of OM (blue), forces are predominantly in the positive direction (myosin is under resisting load). b In the presence of 10 μM OM (red), forces are generated in both directions. c The observed detachment rates in the absence of OM (blue) and at 10 μM OM (red) as a function of applied load are shown as circles at the average force and rate of 20 events sorted by force. Green and yellow lines show the detachment rate calculated from Eq. 1 and parameters from the MLE fit in the absence of and presence of 10 μM OM, respectively, with 95% confidence intervals shown as shaded gray areas. Data are composed of 665 and 583 binding events from 3 and 4 molecules for the absence of OM and 10 μM OM, respectively. d Distance parameter estimates for the control (no OM) and 10 μM OM data from all observed molecules (closed circles) are shown with 95% confidence intervals from bootstrapping and the estimated distance parameters from individual molecules (open circles)
Fig. 5
Fig. 5
Simulations of OM’s effect on in vitro actin gliding velocity and isometric force of muscle preparations. a Summary of parameters used in models in be. b Comparison of gliding filament velocity for the protein used in this study (open triangles) and from Swenson et al. (closed circles) to simulated data from the various model parameter sets (colored lines as in a). The Stroke Eliminated, Prolonged Time of Attachment (SEPTA) Model (red), with parameters from the single-molecule measurements, fully accounts for the observed marked decrease in vitro velocity as a function of OM concentration. Motility error bars are standard deviations of velocities from individual filaments (n of filaments = 92–6709). c Comparison of simulated, normalized, isometric forces at an intermediate calcium concentration (15% activation, lines colored as in a) and results from Nagy et al. who reported a bell-shaped force response of permeabilized myocardial trabeculae as a function of OM (black circles). The SEPTA model (red) shows a similar biphasic shape. d Active force data reproduced from Nagy et al. as a function of pCa (−log [Ca2+]) at 0, 100 nM and 1 μM OM. e Simulated isometric force at 0 OM (gray line), and using the SEPTA model at 100 nM (red dashed line) and 1 μM OM (red, solid line) for comparison with the experimental data in d. The SEPTA model recapitulates the leftward shift in the pCa-tension curve (calcium sensitization) and decreased force production at fully activating [Ca2+]
Fig. 6
Fig. 6
Model of OM’s effect on cardiac myosin. (1) OM increases the rate of entry into strong binding as previously measured by phosphate release rates, but the force generating power stroke is inhibited. (2) Myosin remains strongly bound to actin (red bar), contributing to increased thin-filament activation at intermediate calcium concentrations. (3) OM disrupts the typical pathway of myosin, causing it to pass through an ADP or apo (nucleotide-free) state with its lever arm still in the pre-power stroke position. (4) Myosin detaches from actin without needing to bind ATP. ATP binding must occur before the cycle can start again

References

    1. Malik FI, et al. Cardiac myosin activation: a potential therapeutic approach for systolic heart failure. Science. 2011;331:1439–1443. doi: 10.1126/science.1200113. - DOI - PMC - PubMed
    1. Teerlink JR, et al. Chronic Oral Study of Myosin Activation to Increase Contractility in Heart Failure (COSMIC-HF): a phase 2, pharmacokinetic, randomised, placebo-controlled trial. Lancet. 2016;388:2895–2903. doi: 10.1016/S0140-6736(16)32049-9. - DOI - PubMed
    1. Teerlink JR, et al. Dose-dependent augmentation of cardiac systolic function with the selective cardiac myosin activator, omecamtiv mecarbil: a first-in-man study. Lancet. 2011;378:667–675. doi: 10.1016/S0140-6736(11)61219-1. - DOI - PubMed
    1. Cleland JG, et al. The effects of the cardiac myosin activator, omecamtiv mecarbil, on cardiac function in systolic heart failure: a double-blind, placebo-controlled, crossover, dose-ranging phase 2 trial. Lancet. 2011;378:676–683. doi: 10.1016/S0140-6736(11)61126-4. - DOI - PubMed
    1. Francis GS, Bartos JA, Adatya S. Inotropes. J. Am. Coll. Cardiol. 2014;63:2069–2078. doi: 10.1016/j.jacc.2014.01.016. - DOI - PubMed

Publication types