. 2018 Oct 4;72(1):127-139.e8.
doi: 10.1016/j.molcel.2018.08.016. Epub 2018 Sep 20.

The BRCT Domains of the BRCA1 and BARD1 Tumor Suppressors Differentially Regulate Homology-Directed Repair and Stalled Fork Protection

Affiliations

The BRCT Domains of the BRCA1 and BARD1 Tumor Suppressors Differentially Regulate Homology-Directed Repair and Stalled Fork Protection

David Billing et al. Mol Cell. .

Abstract

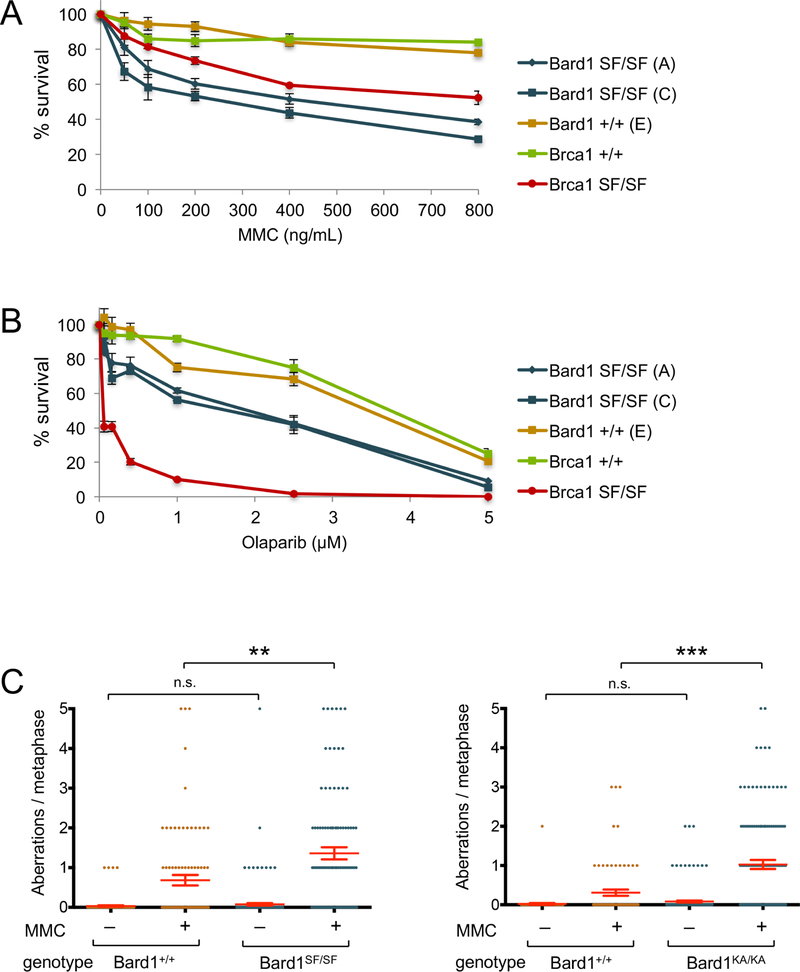
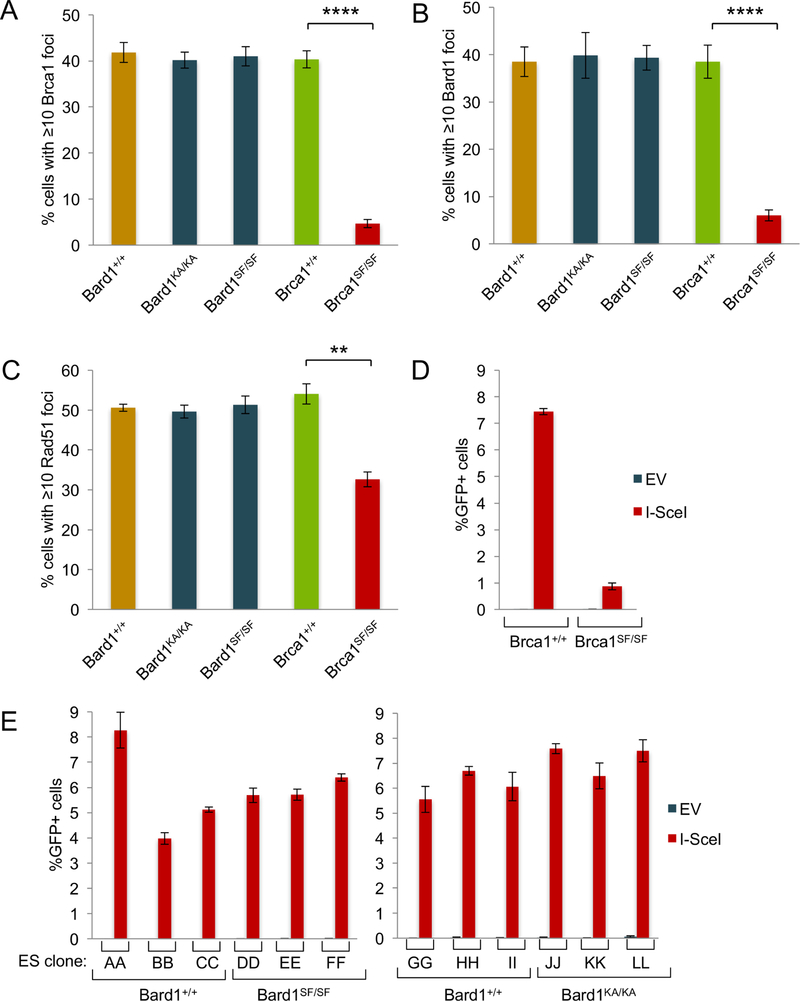
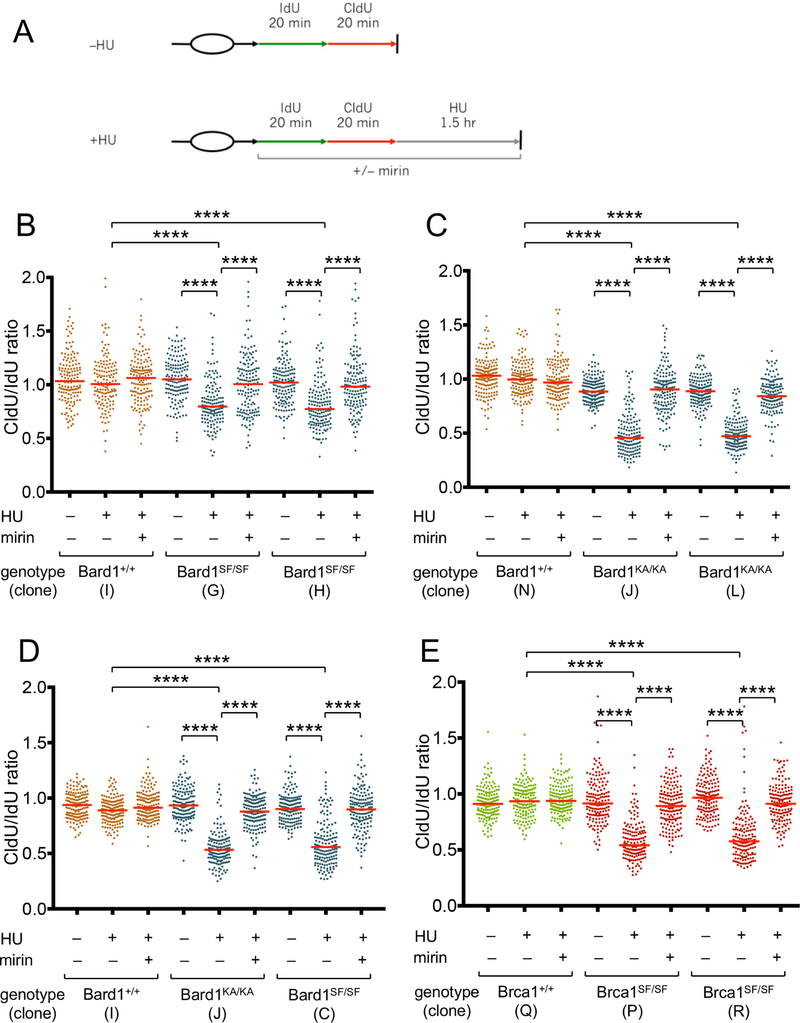
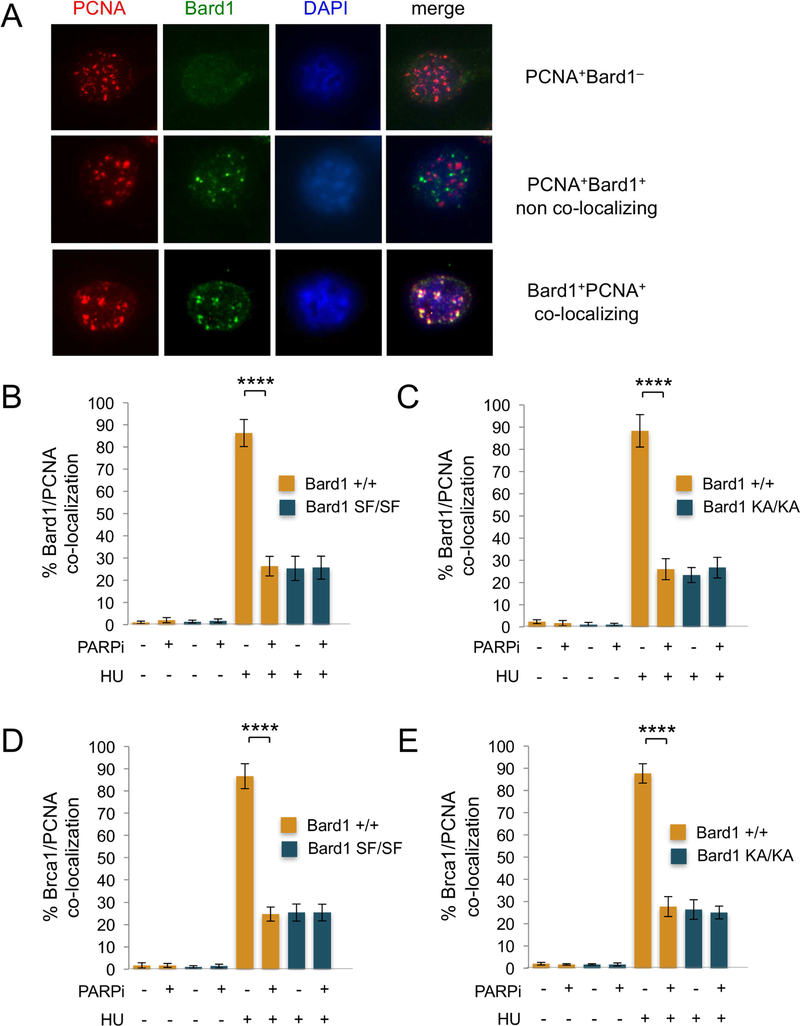
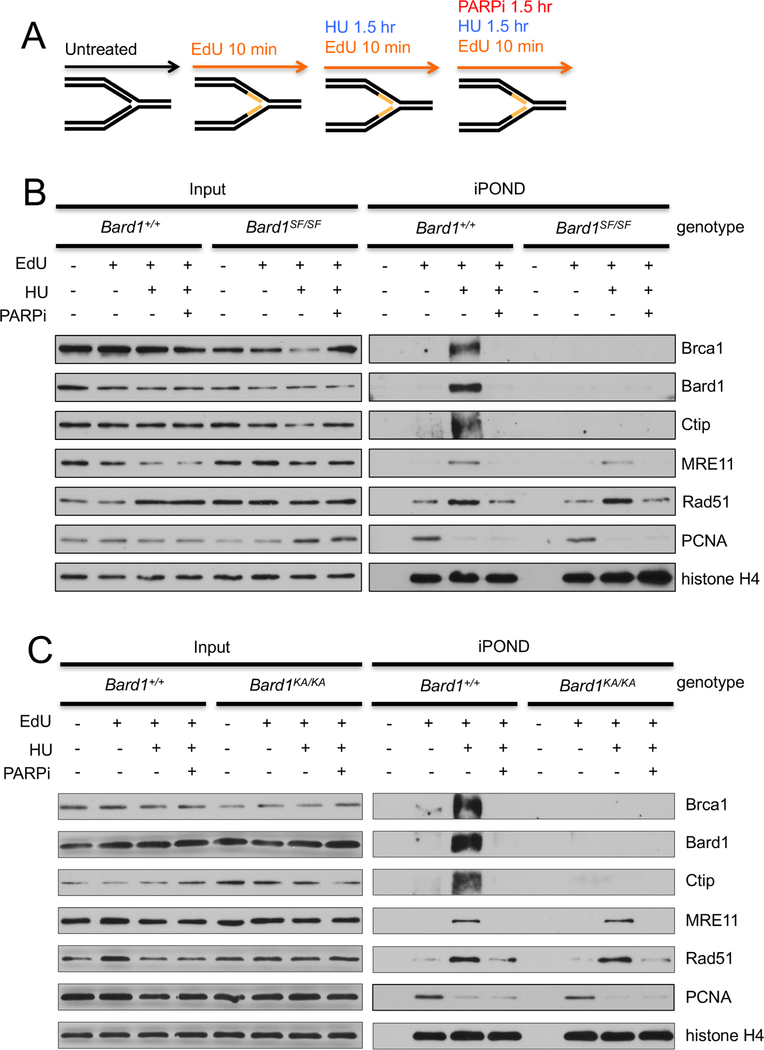
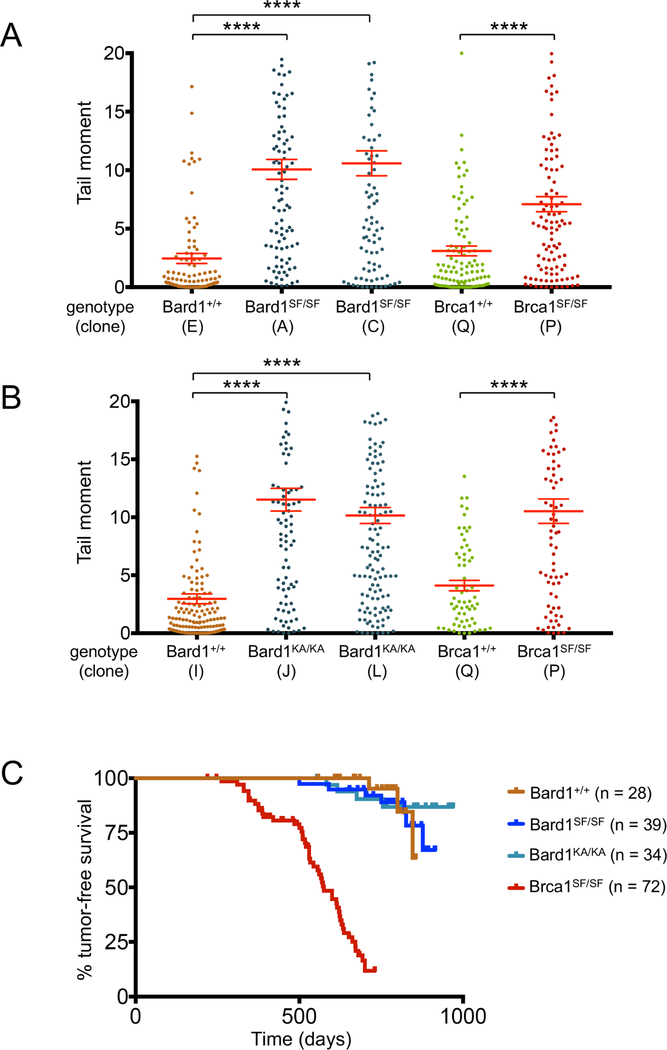
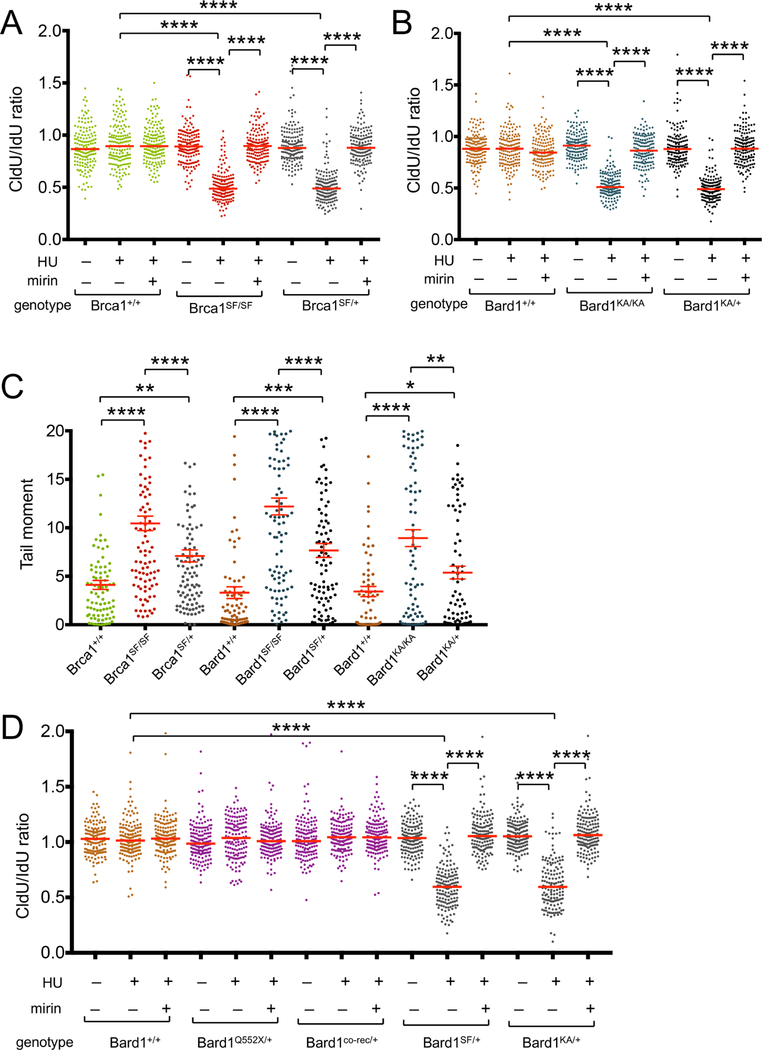
The BRCA1 tumor suppressor preserves genome integrity through both homology-directed repair (HDR) and stalled fork protection (SFP). In vivo, BRCA1 exists as a heterodimer with the BARD1 tumor suppressor, and both proteins harbor a phosphate-binding BRCT domain. Here, we compare mice with mutations that ablate BRCT phospho-recognition by Bard1 (Bard1S563F and Bard1K607A) or Brca1 (Brca1S1598F). Brca1S1598F abrogates both HDR and SFP, suggesting that both pathways are likely impaired in most BRCA1 mutant tumors. Although not affecting HDR, the Bard1 mutations ablate poly(ADP-ribose)-dependent recruitment of BRCA1/BARD1 to stalled replication forks, resulting in fork degradation and chromosome instability. Nonetheless, Bard1S563F/S563F and Bard1K607A/K607A mice, unlike Brca1S1598F/S1598F mice, are not tumor prone, indicating that HDR alone is sufficient to suppress tumor formation in the absence of SFP. Nevertheless, because SFP, unlike HDR, is also impaired in heterozygous Brca1/Bard1 mutant cells, SFP and HDR may contribute to distinct stages of tumorigenesis in BRCA1/BARD1 mutation carriers.

Keywords: BARD1; BRCA1; BRCT domain; DNA break repair; familial breast cancer; genome instability; poly(ADP-ribose); stalled replication forks; tumor suppression.


Figures

Figure 1.
Figure 1.. Bard1SF/SF cells are hypersensitive to DNA damaging agents and display genotoxin-induced chromosomal instability.
A) Colony survival analysis of MMC-treated isogenic Bard1+/+ and Bard1SF/SF MEFs, along with Brca1+/+ and Brca1SF/SF MEFs. Survival is quantified as percentage of colonies on MMC-treated relative to untreated plates. Each condition was tested in triplicate, and error bars represent standard error of the mean. B) Colony survival analysis of olaarib-treated Bard1+/+ and Bard1SF/SF MEFs, along with Brca1+/+ and Brca1SF/SF MEFs. C) Bard1+/+ and Bard1SF/SF primary MEFs were cultured with or without 40 ng/mL MMC for 16 hours and structural chromosome abnormalities were quantified by T-FISH. The mean number of aberrations per cell is denoted by a horizontal red line, and the error bars represent standard error of the mean. P values were calculated by unpaired Student’s T-Test (n.s. = no significance, ** = p<0.01, *** = p<0.001). D) T-FISH analysis of Bard1+/+ and Bard1KA/KA primary MEFs.
Figure 2.
Figure 2.. Bard1SF/SF and Bard1KA/KA cells are competent for Rad51 focus formation and homology-directed repair (HDR).
A) Brca1 focus formation in isogenic Bard1+/+ and Bard1SF/SF MEFs and Brca1+/+ and Brca1SF/SF MEFs was measured 1 hour after exposure to 10 Gy. Each bar graph is an average of three independent experiments, and the error bars represent standard error of the mean. Statistical analyses were conducted using unpaired Student’s T-Test (** = p<0.01, **** = p<0.0001). B) Bard1 focus formation evaluated as in panel A C) Rad51 focus formation evaluated as in panel A. D) HDR efficiency was measured in Brca1+/+ and Brca1SF/SF embryonic stem (ES) cell subclones containing an integrated DR-GFP reporter. Cells were transfected with an empty (EV) or I-SceI-expressing (I-SceI) vector and the percentage of GFP-positive cells quantified by flow cytometry. Each ES cell subclone was analyzed in triplicate transfections. Error bars represent standard error of the mean. E) HDR efficiency was measured in independent subclones of isogenic Bard1+/+ and Bard1SF/SF ES cells (left) and Bard1+/+ and Bard1KA/KA ES cells (right) containing an integrated DR-GFP reporter.
Figure 3.
Figure 3.. Bard1SF/SF, Bard1KA/KA, and Brca1SF/SF cells have a defect in stalled fork protection.
A) Schematic of the DNA fiber assay. MEFs were exposed to sequential 20-minute pulses of IdU and CldU and then harvested immediately (–HU control) or after a 90-minute incubation with 2 mM hydroxyurea (HU). As indicated, cells were exposed to 50 µM mirin to inhibit Mre11 nuclease activity. B) DNA fiber analysis of isogenic immortalized Bard1+/+ and Bard1SF/SF MEFs. For each condition, the CldU/IdU ratios of at least 150 individual DNA fibers are presented as a dot plot, and the median CldU/IdU ratio is denoted by a horizontal red line. Statistical analyses were conducted using the Mann-Whitney rank sum test (**** p<0.0001). C) DNA fiber analysis of immortalized Bard1+/+ and Bard1KA/KA MEFs. D) DNA fiber analysis of primary Bard1+/+, Bard1SF/SF, and Bard1KA/KA MEFs. E) DNA fiber analysis of immortalized Brca1+/+ and Brca1SF/SF MEFs.
Figure 4.
Figure 4.. The recruitment of Brca1/Bard1 heterodimers to PCNA replication factories is defective in HU-treated Bard1SF/SF and Bard1KA/KA cells.
A) Representative images of late S phase PCNA+ cells. Upon immunoflourescent co-staining with antibodies specific for PCNA (red) and Bard1 (green), three distinct populations of PCNA+ cells were identified: 1) cells displaying ≥5 PCNA foci but no Bard1 foci (PCNA +Bard1, top); 2) cells displaying both ≥5 PCNA foci and ≥5 Bard1 foci that were spatially non-overlapping (PCNA+Brca1+ non-co-localizing, middle); and 3) cells displaying both ≥5 PCNA foci and ≥5 Bard1 foci in which more than half of the Bard1 foci co-localize with PCNA foci (PCNA+Brca1+ co-localizing, bottom). In panels B and C, the percent co-localization is the number of PCNA+Bard1+ co-localizing cells divided by the total number of PCNA+ late S phase cells (PCNA+Bard1 + PCNA+Bard1+ co-localizing + PCNA+Bard1+ non -co-localizing). B) The percentage of late S phase cells with co-localizing PCNA and Bard1 foci in isogenic Bard1+/+ and Bard1SF/SF MEFs cultured for 90 minutes in the presence or absence of 2mM hydroxyurea (HU) and/or 100 nM olaparib (PARPi). At least 200 late S phase PCNA+ cells were examined for each condition. The histogram presents the average of three independent experiments and the error bars represent standard error of the mean. Statistical analyses were performed using one-way ANOVA (**** p<0.0001). C) The percentage of late S phase cells with co-localizing PCNA and Bard1 foci in Bard1+/+ and Bard1KA/KA MEFs cultured in the presence or absence of HU and/or PARPi. D) The percentage of late S phase cells with co-localizing PCNA and Brca1 foci in Bard1+/+ and Bard1SF/SF MEFs cultured in the presence or absence of HU and/or PARPi. E) The percentage of late S phase cells with co-localizing PCNA and Brca1 foci in Bard1+/+ and Bard1KA/KA MEFs cultured in the presence or absence of HU and/or PARPi.
Figure 5.
Figure 5.. The assembly of Brca1/Bard1 heterodimers onto stalled replication forks is defective in Bard1KA/KA and Bard1SF/SF cells.
A) For iPOND analysis (Sirbu et al., 2012), cell lysates and iPOND-purified fractions were prepared from untreated cell cultures and from parallel cultures pulsed-labeled for 10 minutes with IdU. The IdU-labeled cultures were harvested immediately or after a subsequent 90-chase with 2mM hydroxyurea (HU) and/or 100 nM olaparib (PARPi). B) Immunoblot analysis of protein abundance in the input cell lysates (left) and the corresponding iPOND-purified fractions (right) from Bard1+/+ and Bard1SF/SF cells. C) Immunoblot analysis of protein abundance in the input cell lysates (left) and the corresponding iPOND-purified fractions (right) from Bard1+/+ and Bard1KA/KA cells.
Figure 6.
Figure 6.. Although Bard1SF/SF and Bard1KA/KA cells accumulate DNA damage during replication stress, Bard1SF/SF and Bard1KA/KA mice are not tumor prone.
A) The alkaline comet assay was used to assess HU-induced DNA damage in isogenic Bard1+/+ and Bard1SF/SF MEFs, as well as isogenic Brca1+/+ and Brca1SF/SF MEFs. For each condition, the individual tail moments of at least 75 cells are presented as a dot plot; the mean tail moment is denoted by a horizontal red line and the standard error of the mean is indicated by error bars. Statistical analyses were conducted using one-way ANOVA (Bard1 clones) or unpaired Student’s t test (Brca1 clones) (**** p<0.0001). B) Alkaline comet assay to assess HU-induced DNA damage in Bard1+/+ and Bard1KA/KA MEFs, as well as Brca1+/+ and Brca1SF/SF MEFs. C) Kaplan-Meier tumor-free survival curves of the Bard1+/+ (n = 28), Bard1SF/SF (n = 39), and Bard1KA/KA (n=34) cohorts. Using the log-rank (Mantel-Cox) test, no statistical significance (defined as p<0.05) was observed between the Bard1SF/SF and Bard1+/+ curves (p = 0.9854) or the Bard1KA/KA and Bard1+/+ curves (p = 0.8387). The Kaplan-Meier survival curve of Brca1SF/SF mice (n=72) from (Shakya et al., 2011) is superimposed for comparison.
Figure 7.
Figure 7.. Heterozygous Bard1SF/+, Bard1KA/+, and Brca1SF/+ cells are haploinsufficient for stalled fork protection and accumulate DNA damage upon replication stress.
A) DNA fiber analysis (as described in Figure 3) of Brca1+/+, Brca1 SF/SF, and Brca1SF/+ MEFs. B) DNA fiber analysis of Bard1+/+, Bard1KA/KA, and Bard1KA/+ MEFs. C) Alkaline comet assay (as described in Figure 6) to assess HU-induced DNA damage in isogenic panels of wild type, homozygous-mutant, and heterozygous-mutant MEFs harboring the Brca1SF, Bard1SF, and Bard1KA alleles. Statistical analyses were conducted using one-way ANOVA (* p<0.05, ** p<0.01, *** p<0.001, **** p<0.0001). D) DNA fiber analysis of Bard1+/+, Bard1Q552X/+, Bard1co-rec/+, Bard1SF/+, and Bard1KA/+ MEFs.

References

    1. Ayi TC, Tsan JT, Hwang LY, Bowcock AM, and Baer R (1998). Conservation of function and primary structure in the BRCA1-associated RING domain (BARD1) protein. Oncogene 17, 2143–2148. - PubMed
    1. Birrane G, Varma AK, Soni A, and Ladias JA (2007). Crystal structure of the BARD1 BRCT domains. Biochemistry 46, 7706–7712. - PubMed
    1. Botuyan MV, Nomine Y, Yu X, Juranic N, Macura S, Chen J, and Mer G (2004). Structural basis of BACH1 phosphopeptide recognition by BRCA1 tandem BRCT domains. Structure 12, 1137–1146. - PMC - PubMed
    1. Clapperton JA, Manke IA, Lowery DM, Ho T, Haire LF, Yaffe MB, and Smerdon SJ (2004). Structure and mechanism of BRCA1 BRCT domain recognition of phosphorylated BACH1 with implications for cancer. Nature Struct. Mol. Biol 11, 512–518. - PubMed
    1. De Brakeleer S, De Greve J, Desmedt C, Joris S, Sotiriou C, Piccart M, Pauwels I, and Teugels E (2016). Frequent incidence of BARD1-truncating mutations in germline DNA from triple-negative breast cancer patients. Clin. Genet 89, 336–340. - PubMed

Publication types

LinkOut - more resources