. 2018 Oct 4;23(4):544-556.e4.
doi: 10.1016/j.stem.2018.08.019. Epub 2018 Sep 20.

Impaired Notch Signaling Leads to a Decrease in p53 Activity and Mitotic Catastrophe in Aged Muscle Stem Cells

Affiliations

Impaired Notch Signaling Leads to a Decrease in p53 Activity and Mitotic Catastrophe in Aged Muscle Stem Cells

Ling Liu et al. Cell Stem Cell. .

Abstract

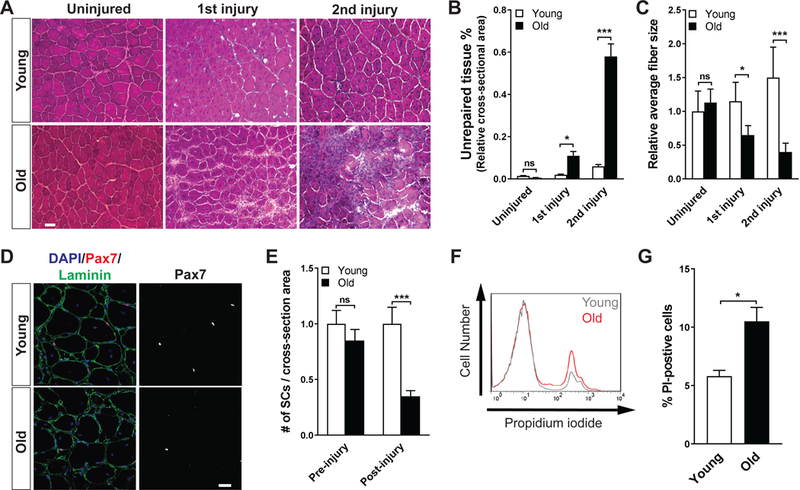
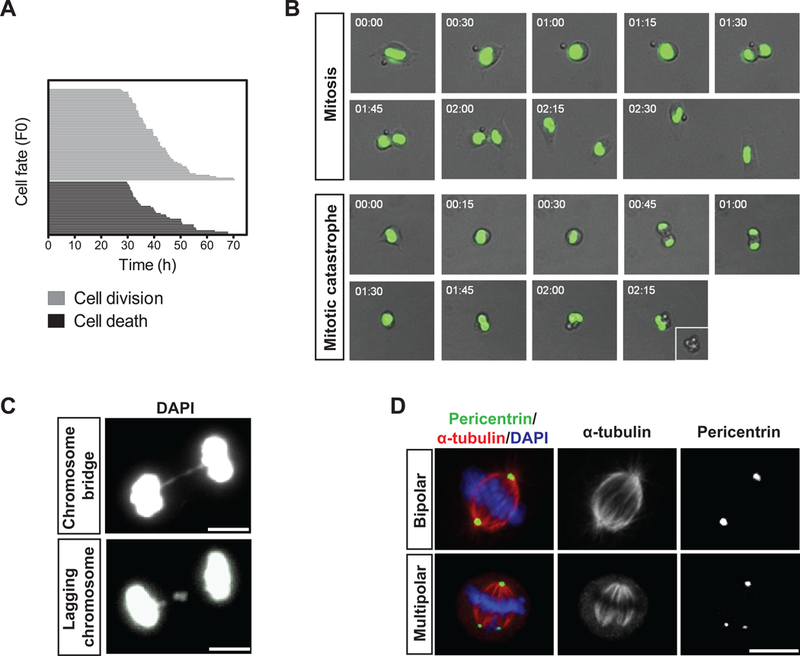
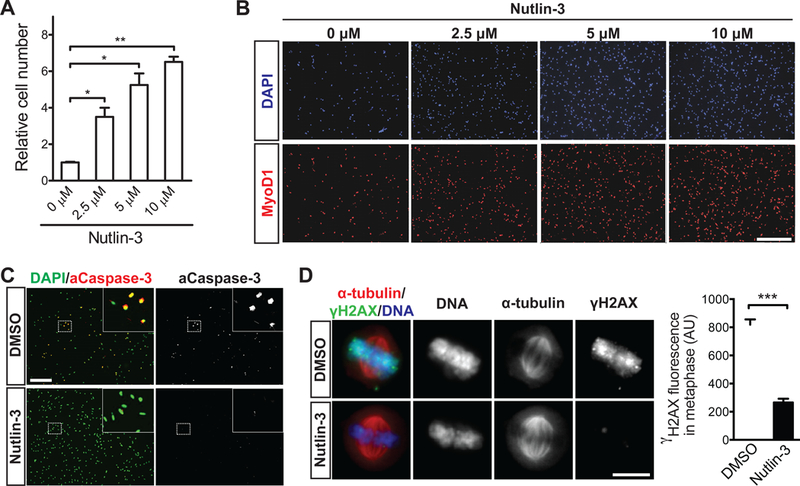
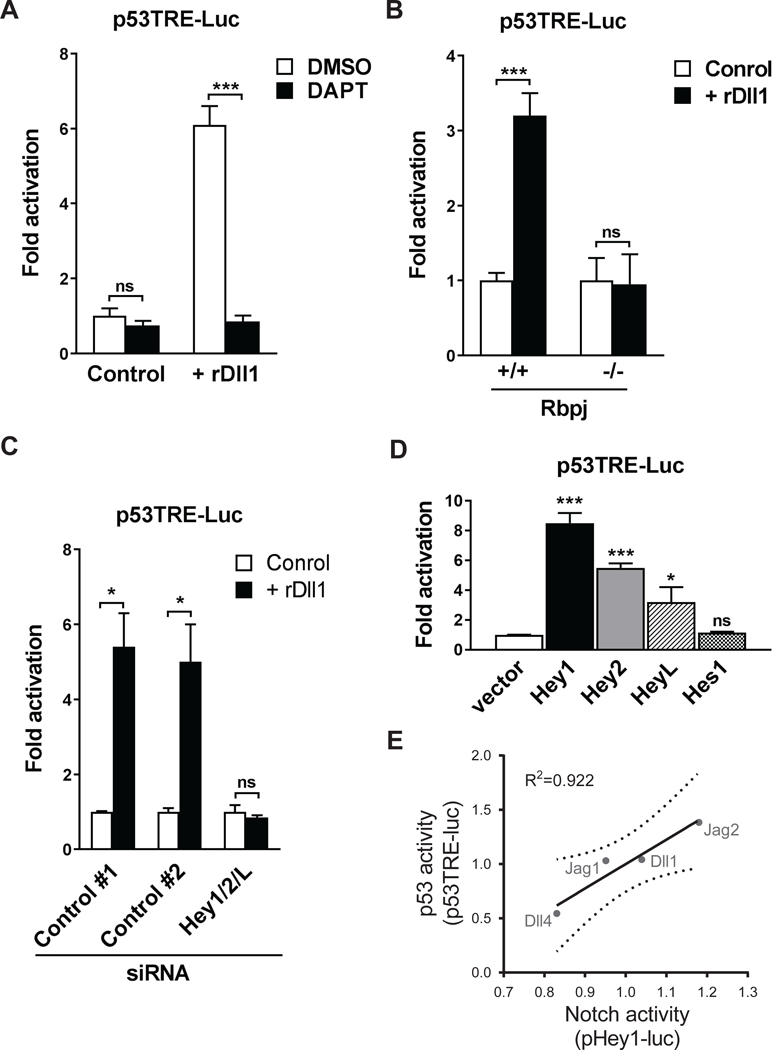
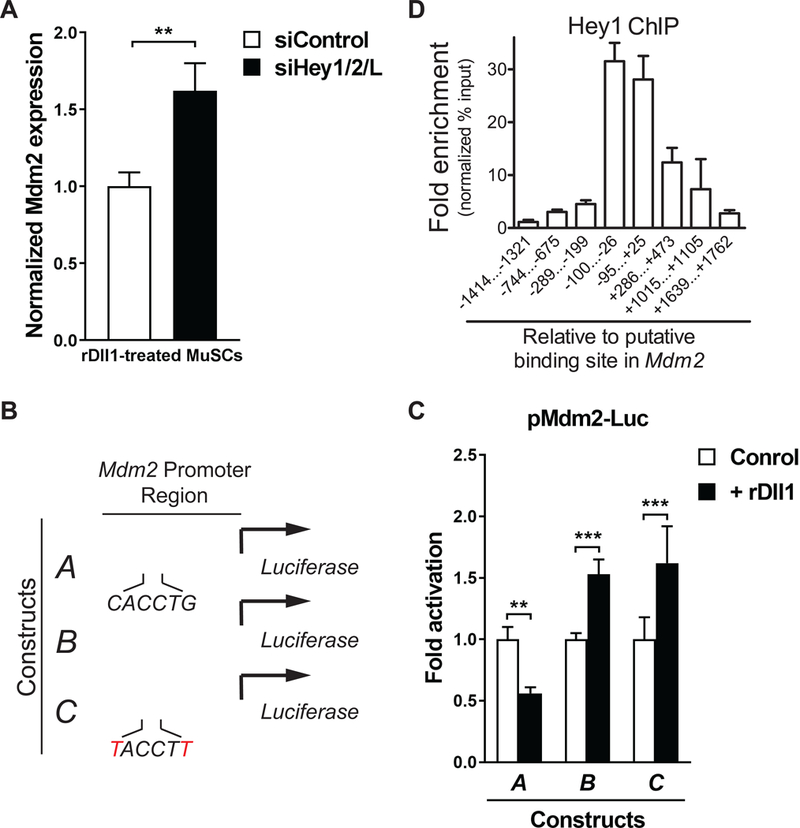
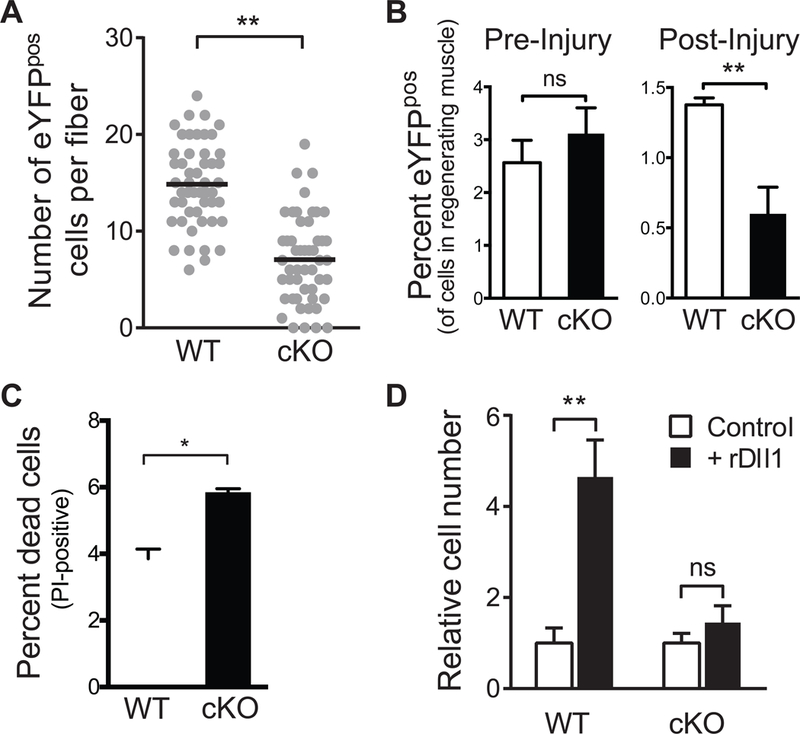
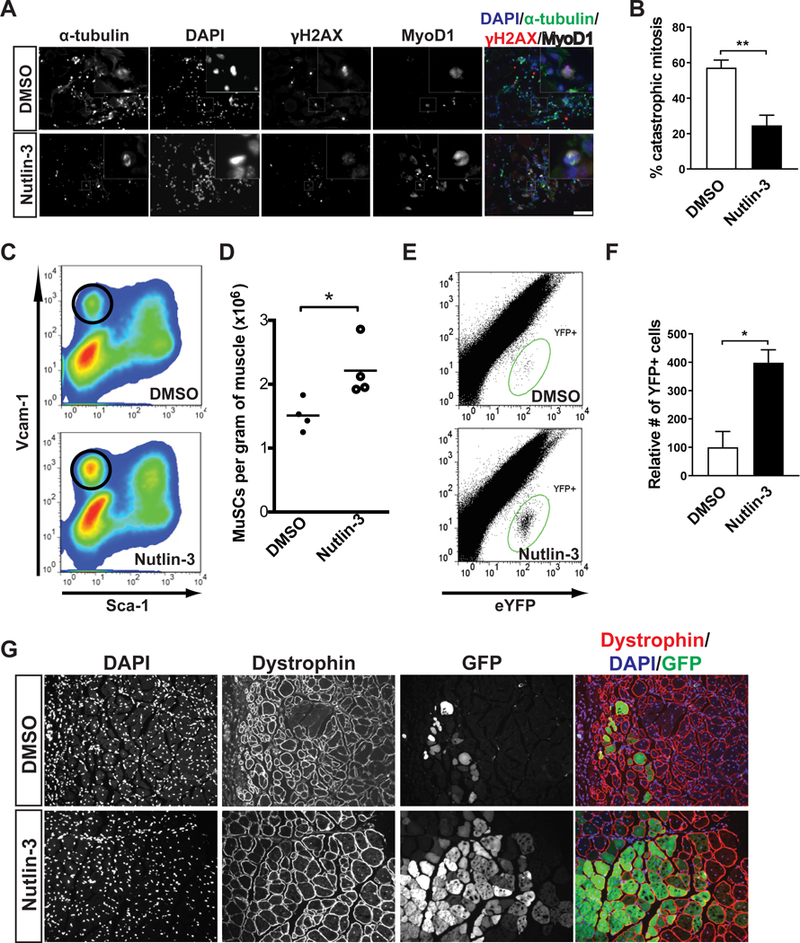
The decline of tissue regenerative potential with age correlates with impaired stem cell function. However, limited strategies are available for therapeutic modulation of stem cell function during aging. Using skeletal muscle stem cells (MuSCs) as a model system, we identify cell death by mitotic catastrophe as a cause of impaired stem cell proliferative expansion in aged animals. The mitotic cell death is caused by a deficiency in Notch activators in the microenvironment. We discover that ligand-dependent stimulation of Notch activates p53 in MuSCs via inhibition of Mdm2 expression through Hey transcription factors during normal muscle regeneration and that this pathway is impaired in aged animals. Pharmacologic activation of p53 promotes the expansion of aged MuSCs in vivo. Altogether, these findings illuminate a Notch-p53 signaling axis that plays an important role in MuSC survival during activation and is dysregulated during aging, contributing to the age-related decline in muscle regenerative potential.

Keywords: Notch; aging; mitotic catastrophe; muscle regeneration; muscle stem cells; p53; satellite cells; stem cells.


Conflict of interest statement

Declaration of Interests

The authors declare no competing interests.

Figures

Figure 1.
Figure 1.. Impaired self-renewal and increased cell death of aged MuSCs.
(A) Representative hematoxylin and eosin-stained frozen transverse sections of Tibialis Anterior (TA) muscles of young and old mice during the course of sequential injuries. Muscles were collected 7 days post-injury. (B) Quantification of the percentage of non- myofiber tissue over total section area of A (n = 3 per condition). (C) Quantification of fiber diameter in panel (A). The average fiber diameter of uninjured muscles from young mice set at 1. (D) Representative immunofluorescence (IF) analysis of Pax7-expressing MuSCs in regenerated TA muscles of young and old mice. Muscles were analyzed 21 days post-injury. (E) Quantification of the number of MuSCs prior to and 21 days after injury in young and old mice. The average number of Pax7-expressing cells per area of transverse section of uninjured young mice was used as standard and set at 1 (n = 4 per condition). (F) Representative flow cytometric analysis of cell death in the MuSC population from young and old animals 60 hours after injury, measured by propidium iodide (PI) incorporation. (E) Quantification of the percentage of dead (PI-positive) MuSCs from young and old animals 60 hours after injury (n = 3).
Figure 2.
Figure 2.. Mitotic catastrophe of MuSCs during in vitro activation.
(A) Cell fate analysis by time-lapse microscopy of MuSCs following FACS isolation and plating. Each horizontal bar represents a single cell (n=100). The length of a given bar along the x-axis reflects the length of time required to reach the point of cell division (grey lines; top) or cell death (black lines; bottom). (B) Representative time-lapse images of H2B-GFP-expressing MuSCs undergoing successful mitosis or mitotic catastrophe. Merged bright field and fluorescence images are shown with the time at which the frames were captured indicated at the top left corner. (C) Representative IF images of dividing MuSCs exhibiting features of mitotic catastrophe. DNA was stained with DAPI. (D) Representative IF images of a normal bipolar (top panels) and an abnormal multipolar (bottom panels) mitotic spindle of MuSCs during in vitro activation. Pericentrin (green) and α-tubulin (red) were stained to visualize the mitotic spindle. DNA was stained with DAPI.
Figure 3.
Figure 3.. Pharmacologic activation of p53 prevents mitotic catastrophe in MuSCs.
(A) Quantification of MuSC number in cultures treated without Nutlin-3a (N3) or with the given concentration of N3 for a period of four days post-isolation (n = 3 for each condition). (B) Representative IF images of activated, Myod1-expressing MuSCs following four days in culture with the given concentration of N3. DNA was stained with DAPI. (C) Representative IF images of aCaspase-3 staining in control and N3-treated (10 μM) MuSC cultures. DNA was stained with DAPI. Percentage of aCaspase-positive MuSCs is indicated at the lower right corner for each condition (n = 500 cells per condition in each of three independent experiments). (D) Representative IF images of γ- H2AX staining (green) in control and N3-treated (10 μM) MuSCs in metaphase (n = 75 cells per condition from three independent experiments). Cells were analyzed 48 hours post-isolation. The spindles were labeled with α-tubulin staining (red) and DNA was stained with DAPI. Quantitative analysis of γ-H2AX fluorescence intensity in metaphase MuSCs was shown in the right panel (AU, arbitrary units).
Figure 4.
Figure 4.. Activation of p53 transcriptional activity by rDll1.
(A) γ-secretase-dependent activation of p53 transcription by rDlll. MuSCs were transfected with a p53 luciferase reporter plasmid and cultured with or without rDll1 in the presence and absence of 25 μM DAPT. Cells were collected 48 hours after transfection and assayed for luciferase activity. Normalized luciferase activity of the control culture was set at 1 (n = 3 independent cultures for each condition). (B) Rbpj- dependent activation of p53 transcription by rDll1. MuSCs isolated from conditional Rbpj knockout or control mice were transfected with a p53 luciferase reporter plasmid and cultured with or without rDll1. Cells were collected 48 hours after transfection and assayed for luciferase activity. Normalized luciferase activity of untreated cells from control mice was set at 1 (n = 3). (C) Hey1/2/L-dependent activation of p53 transcription by rDll1. MuSCs isolated from wildtype mice were co-transfected with either siRNAs specific for Hey1/2/L or control siRNAs, and with a p53 luciferase reporter plasmid. Transfected cells were cultured with or without rDll1 for 48 hours and subjected to luminescent assay. Normalized luciferase activity of untreated cells transfected with control siRNAs was set at 1 (n = 3). (D) Induction of p53 transcriptional activity by overexpression of Hey proteins. MuSCs isolated from wildtype mice were co-transfected with a p53 luciferase reporter plasmid and plasmids encoding Hey1, Hey2, HeyL or Hes1. Transfected cells were collected 48 hours after transfection and subjected to luminescent assay. Normalized luciferase activity of vector-transfected cells was set at 1 (n = 3). (E) Correlation of p53- and Notch-signaling activity in purified MuSCs treated with recombinant Notch ligands measured using p53 (p53TRE-luc) and Notch (pHey1- luc) transcriptional reporter plasmids. Linear regression (solid line) and 95% confidence intervals (dashed lines) are shown.
Figure 5:
Figure 5:. Activation of Mdm2 transcription by Hey1.
(A) Hey-dependent repression of Mdm2 expression in response to rDll1. Freshly isolated MuSCs were transfected with control siRNA or a cocktail of siRNAs targeting individual Hey genes. Transfected cells were cultured for 48 hours in the presence rDll1 and collected for RT-qPCR analysis. Mdm2 expression was normalized to GAPDH expression in each condition (n = 3 independent experiments). (B) Depiction of wild- type, truncated, and mutated versions of the Mdm2 promoter reporter. (C) Normalized activity of Mdm2 promoter luciferase reporters as depicted in (B) with and without rDll1 treatment. MuSCs were transfected with the individual reporter plasmids and cultured in the absence or presence of rDll1 for 48 hours. Cells were then harvested and subjected to luminescent assay. Normalized luciferase activity of untreated cells was set at 1. Fold change was calculated for other conditions and plotted (n = 3 independent experiments). (D) Direct binding of Hey1 to Mdm2 promoter. ChIP-qPCR analysis of Hey1 binding to various positions throughout the Mdm2 promoter using pairs of primers specific to these regions. Amplicons are identified by base-pair distance from the 5’ end of the CACCTG E-box sequence.
Figure 6:
Figure 6:. Impairment of MuSCs from conditional p53 cKO mice.
(A) Number of MuSCs on single myofibers in p53 cKO and control mice. Quantification of MuSCs that reside on single myofibers isolated from p53 cKO and control mice immediately following isolation (left) and after a period of three days in muscle fiber explant culture (right). Data were accumulated from explants in three independent cultures. Each data point represents the number of cells per fiber. The black lines represent median number of cells per fiber. (B) Quantification by FACS of MuSCs in p53 cKO and control mice pre- and three days post-injury (n = 5 mice in each condition). (C) Comparison of the percentage of dead MuSCs and their progeny in p53 cKO and control mice three days after injury. YFP-expressing cells were isolated by FACS in the presence of PI. The ratio between PI-labeled and YFP-expressing cells was calculated for each genotype (n=5). (D) Abrogation of the effect of rDll1 on MuSC expansion in the absence of p53. MuSCs were isolated from p53 cKO and control mice and cultured for 72 hours in the absence or presence of rDll1 prior to cell number quantification. The average cell number of each genotype was set at 1 (n = 3).
Figure 7.
Figure 7.. Rejuvenation of aged MuSC function by pharmacological activation of p53.
(A) Representative IF images of γ-H2AX staining (red) in mitotic myogenic cells in cross-sections of regenerating TA muscle from 24-month-old mice, three days post-injury with or without N3 treatment. Myogenic cells were labeled by MyoD1 staining (white) and spindles were labeled by α-tubulin staining (green). DNA was stained with DAPI. (B) From studies shown in panel (A), the percentages mitotic myogenic cells that were γ- H2AX-postive in each condition were calculated. (C) Representative FACS plot of MuSC progeny (circled population) in muscles of old mice, three days post-injury with or without N3 treatment. (D) The number of MuSC progeny were normalized by muscle weight from studies illustrated in panel (C) (n=4). (E) Representative FACS plots of engrafted eYFP-expressing cells 14 days following transplantation. MuSCs isolated from aged PAX7CreER/+; ROSA26eYFP/+ mice were cultured in control medium or medium supplemented with N3 for two days. From each condition, 10,000 cells were then transplanted into the TA muscles of 24-month-old mice. (F) From studies illustrated in panel (E), engrafted YFP cells were analyzed by FACS 14 days after transplantation (n = 4 mice analyzed in each condition). (G) Representative IF images of YFP-expressing muscle fibers 14 days following transplantation of YFP-expressing aged MuSCs treated or untreated with N3.

References

    1. Agostini M, Tucci P, Chen H, Knight RA, Bano D, Nicotera P, McKeon F, and Melino G (2010). p73 regulates maintenance of neural stem cell. Biochem Biophys Res Commun 403, 13–17. - PMC - PubMed
    1. Balaganapathy P, Baik SH, Mallilankaraman K, Sobey CG, Jo DG, and Arumugam TV (2017). Interplay between Notch and p53 promotes neuronal cell death in ischemic stroke. J Cereb Blood Flow Metab, 271678X17715956. - PMC - PubMed
    1. Bernet JD, Doles JD, Hall JK, Kelly Tanaka K, Carter TA, and Olwin BB (2014). p38 MAPK signaling underlies a cell-autonomous loss of stem cell self-renewal in skeletal muscle of aged mice. Nat Med 20, 265–271. - PMC - PubMed
    1. Bjornson CR, Cheung TH, Liu L, Tripathi PV, Steeper KM, and Rando TA (2012). Notch signaling is necessary to maintain quiescence in adult muscle stem cells. Stem cells 30, 232–242. - PMC - PubMed
    1. Brack AS, Conboy MJ, Roy S, Lee M, Kuo CJ, Keller C, and Rando TA (2007). Increased Wnt signaling during aging alters muscle stem cell fate and increases fibrosis. Science 317, 807–810. - PubMed

Publication types

Substances