. 2018 Oct 4;23(4):501-515.e7.
doi: 10.1016/j.stem.2018.08.008. Epub 2018 Sep 20.

Esophageal Organoids from Human Pluripotent Stem Cells Delineate Sox2 Functions during Esophageal Specification

Affiliations

Esophageal Organoids from Human Pluripotent Stem Cells Delineate Sox2 Functions during Esophageal Specification

Stephen L Trisno et al. Cell Stem Cell. .

Abstract

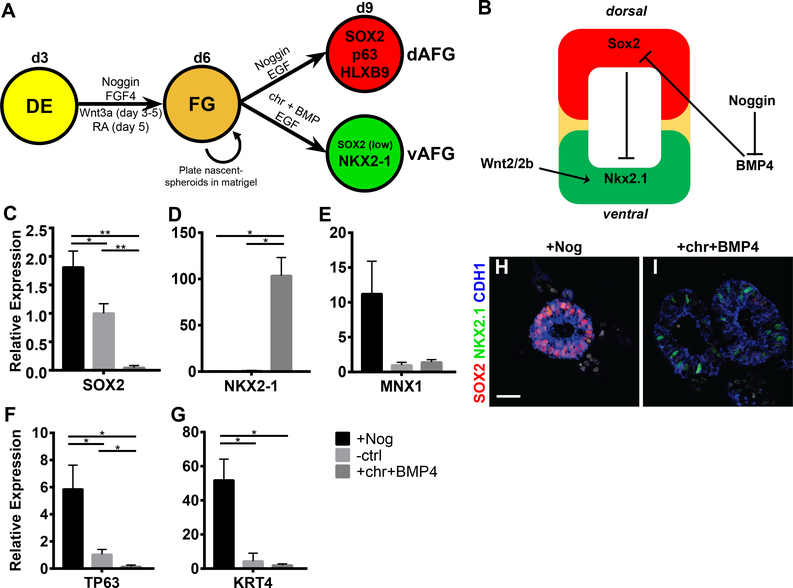
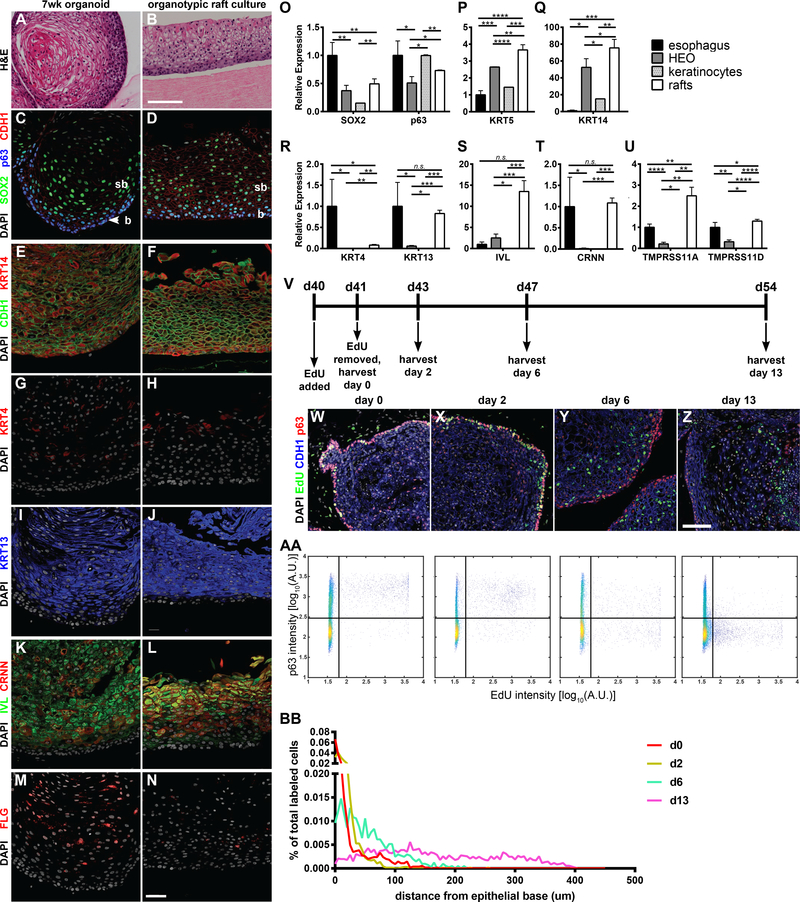
Tracheal and esophageal disorders are prevalent in humans and difficult to accurately model in mice. We therefore established a three-dimensional organoid model of esophageal development through directed differentiation of human pluripotent stem cells. Sequential manipulation of bone morphogenic protein (BMP), Wnt, and RA signaling pathways was required to pattern definitive endoderm into foregut, anterior foregut (AFG), and dorsal AFG spheroids. Dorsal AFG spheroids grown in a 3D matrix formed human esophageal organoids (HEOs), and HEO cells could be transitioned into two-dimensional cultures and grown as esophageal organotypic rafts. In both configurations, esophageal tissues had proliferative basal progenitors and a differentiated stratified squamous epithelium. Using HEO cultures to model human esophageal birth defects, we identified that Sox2 promotes esophageal specification in part through repressing Wnt signaling in dorsal AFG and promoting survival. Consistently, Sox2 ablation in mice causes esophageal agenesis. Thus, HEOs present a powerful platform for modeling human pathologies and tissue engineering.

Keywords: Sox2; esophagus; foregut; organoid.


Conflict of interest statement

DECLARATION OF INTERESTS

JMW and SLT have a pending patent application, number 62/570,182, related to this work that describes a method for generating esophageal tissue from human pluripotent stem cells. All other authors have no potential conflicts of interests to declare.

Figures

Figure 1:
Figure 1:
Specifying anterior foregut fate by modulating Wnt and retinoic acid signaling during foregut spheroid development. (A) The experimental protocol to pattern foregut spheroids along anterior-posterior axis by manipulating the duration of Wnt activation (chiron - chr). (B-C) qPCR analysis of varying chiron treatment duration on patterning of foregut spheroids as measured by (B) the foregut marker SOX2 and mid/hindgut marker CDX2, and (C) the anterior foregut (AFG) marker HNF1B, and the posterior foregut markers PROX1 and HNF6. (D-E) Whole-mount immunofluorescence (IF) analysis with HNF1B, SOX2 and CTNNB1 of nascent spheroids (day 6) treated with 1 day (D) and 3 days (E) of chiron. (F) The experimental protocol to pattern foregut spheroids along anterior-posterior axis using retinoic acid (RA). (G) Effects of varying the duration of RA treatment on 3-day-old foregut spheroids as measured by SOX2, TP63 (ΔN isoform), GATA4, and PDX1. (J-K) IF analysis on early esophageal markers SOX2 and p63 in untreated spheroids (I), and spheroids treated with RA for 1 day (J) or 4 days (K). (H) Quantification of the percent of SOX2+ and p63+ epithelial cells per spheroid. Scale bar = 25μm. See quantification and statistical analysis section for details. See also Figure S1 and S2.
Figure 2:
Figure 2:
Anterior foregut spheroids have esophageal-respiratory competence. (A) Schematic depicting experimental protocol to pattern AFG spheroids along the dorsal-ventral axis. (B) Current simplified model of the cues guiding dorsal-ventral patterning of the AFG of mouse and frog embryos. (C-G) qPCR analysis of 3-day-old spheroids (day 9) treated for 3 days with Noggin, untreated (ctrl), or chiron and BMP4 (10ng/mL) using dorsal markers SOX2 and MNX1 (C+E), the respiratory marker NKX2–1 (D), ΔN splice variant of TP63 (F), and the stratified squamous epithelium marker KRT4 (G). (H-I) IF staining for SOX2, NKX2–1, CDH1, and nuclei (DAPI) in Noggin (H) versus chiron+BMP4 (I) treated spheroids. Scale bar = 25μm. See quantification and statistical analysis section for details. See also Figure S3.
Figure 3:
Figure 3:
Dorsal anterior foregut spheroids form organoids comprised of a stratified squamous epithelium that expresses esophageal markers. (A) Schematic depicting differentiation of DE into human esophageal organoids (HEOs). (B-F) Brightfield images depicting growth of nascent spheroids into HEOs. (G-R) Comparison of E17.5 esophagi. (G,J,M,K) to 1- and 2-month-old HEOs (H-I,K-L,N-O,Q-R), by IF analysis of the transcription factors Sox2 and p63 (G-I), epithelial markers Krt8 versus Krt14 (J-O), and the suprabasal marker Krt13 (P-R). (S-V) qPCR analysis of the identity and maturation of esophageal organoids at 1- and 2- months of age compared to human gastric and intestinal organoids (HGO and HIO) and pediatric esophageal biopsies by the stratified squamous epithelial markers p63, KRT5, KRT13, IVL, CRNN. (W) Unsupervised hierarchical clustering of 2 month HEOs compared to various biopsies of the GI tract. (X) Principal component analysis of 1 month old HIOs, HGOs, and HEOs. (Y) Heat map of log2-transformed normalized TPM values of selected genes (esophageal, gastric, intestinal) averaged across replicates. SSE = stratified squamous epithelium; b = basal; sb = suprabasal. Scale bar = 500μm (B-F), 50μm (G-L), 100μm (O-R), and 25μm (O’-R’). See quantification and statistical analysis section for details. See also Figure S4.
Figure 4:
Figure 4:
HEOs contain progenitors that give rise to differentiated stratified squamous epithelium. (A-B) H&E staining comparing 7 week HEOs to organotypic rafts generated using HEO-derived from keratinocytes. (C-N) Comparison of 7 week HEOs to organotypic rafts by IF analysis of transcription factors SOX2 and p63 (C-D), basal marker KRT14 (E-F), suprabasal keratins KRT4 (G-H) and KRT13 (IJ), and differentiated markers IVL, CRNN, and FLG (K-N). (O-U) qPCR analysis of esophageal biopsies, 7 week HEOs, HEO-derived keratinocytes, and organotypic rafts for SOX2 and TP63 (O), KRT5 (P), KRT14 (Q), KRT4 and KRT13 (R), IVL (S), CRNN (T), and esophageal specific markers TMPRSS11A/D (U). (V) Protocol for EdU pulse-chase labeling experiment in HEOs. (W-Z) IF images of HEOs at various time-points post-labeling. (AA-BB) Analysis of IF images using a 2D histogram of P63 intensity versus EdU intensity. (AA) and a 1D histogram of percent of total EdU labeled cells versus distance from the epithelial base (BB). b = basal; sb = suprabasal. Scale bar = 50μm (C-N), 100μm (A-B,S-V). See quantification and statistical analysis section for details. See also Figure S5.
Figure 5:
Figure 5:
Early endodermal deletion of Sox2 results in esophageal agenesis in mouse. (A-D) IF analysis for Sox2 and Nkx2–1 in control embryos (Sox2fl/fl) and Sox2 conditional endodermal knockout embryos (Sox2-DE-LOF, FoxA2CreER;Sox2fl/fl) from pregnant dams gavaged with tamoxifen at 6.5dpc. Embryo sections at E9.5 (A-B) and whole-mount IF at E11.5 (C-D) in which the image is masked highlight the endoderm. (E-F) IF images of sections with the relative section indicated in the whole-mount images (C-D) for Nkx2–1 (E) and p63 (F). Insets show only the Sox2 channel (left) and the green/right (Nkx2–1 or p63) channel. (G-H) Analysis of cell death by cleaved Caspase 3 staining in E10.5 Sox2 cKO (Sox2CreER/fl) embryos from pregnant dams gavaged at 8.5dpc. The boxed region is magnified and shown in (G’-H’), with the endoderm is outlined in white and displays only the cleaved Caspase 3. (I-L) IF analysis of E11.5 mouse control and Sox2 cKO embryos (Sox2CreER/fl) from pregnant dams gavaged at 9.5dpc. (I and J) Whole-mount IF for Nkx2–1 and Foxa2 of the foregut from a side and frontal projection. (K and L) Sections of the E11.5 foregut corresponding to their relative position in the whole-mount IF projections (I-J), stained for Nkx2–1 (K) and p63 (J), with the yellow arrowhead pointing at the mutant esophagus. Scale bar = 50μm in all IF sections, and 100μm in all IF whole-mount projections. See quantification and statistical analysis section for details. fg = foregut, dfg = dorsal foregut, vfg = ventral foregut, eso = esophagus, tr = trachea, br = bronchi, st = stomach. See also Figure S6.
Figure 6:
Figure 6:
Sox2 represses the respiratory fate and promotes the dorsal (esophageal) lineage. (A-F) In situ hybridization for nkx2–1 of control (A,C,E) or Sox2 MO-injected (B,D,F) Xenopus endoderm explants analyzed at stage NF35 treated with Bio (GSK3β inhibitor) and Bio+BMP4. (G) Schematic depicting experimental protocol to generate human dorsal (Noggin) and ventral (BMP) AFG cultures. +SOX2 indicates tet-inducible SOX2, while -SOX2 indicates SOX2 CRISPRi. (H-N) Analysis of day 9 AFG cultures patterned along the dorsal-ventral axis, with or without SOX2 knockdown in the dorsal cultures using Dox-inducible CRISPRi on day 3–9; (H-K) IF staining of cultures for SOX2 and NKX2–1 and quantification in (L). (M-N) qPCR analysis for SOX2 and NKX2–1 in response to these patterning conditions. (O-U) Doxycycline-induced expression of exogenous SOX2 in ventral cultures on day 8 and analysis on day 9. (O-R) IF staining of cultures for NKX2–1 and HA-SOX2; and (S-T) qPCR analysis for SOX2 and NKX2–1 in response to patterning conditions. Scale bar = 50 μm for IF images, and 200 μm for Xenopus explant images. See quantification and statistical analysis section for details.
Figure 7:
Figure 7:
Sox2 regulates expression of secreted Wnt antagonists and Wnt signaling activity in the dorsal foregut endoderm. (A) Clustered heatmap of differentially expressed genes from RNA sequencing of day 9 dorsal (+Noggin) or ventral (+BMP4) AFG cultures with (+dox) and without SOX2 CRISPR interference (CRISPRi). (B) Venn diagram analysis of genes upregulated in dorsal and ventral cultures compared to genes that are elevated or decreased following SOX2 knockdown by CRISPRi. (C) Gene ontology (GO) term analysis on biological processes for genes positively regulated by SOX2. (D) Number of genes enriched in dorsal and ventral cultures and whether their expression was SOX2-dependent. (E) Gene set enrichment analysis of the gene ontology term “Regulation of Wnt signaling pathway”, red indicating higher expression while blue indicates low expression. (F-G) In situ hybridization for the Wnt-responsive gene Axin2 on E9.5 mouse anterior foreguts in (F) control (Sox2fl/fl) and (G) Sox2-DE-LOF (FoxA2CreER;Sox2fl/fl) embryos. (H-I) In situ hybridization for Axin2 in E10.5 mouse embryonic foregut of (H) control (Sox2fl/+) and (I) Sox2 cKO (Sox2CreER/fl) embryos taken from dams gavaged at 8.5dpc. Numbers of embryos analyzed is shown in the upper left. Boxed regions (F-I) highlight the dorsal foregut region. (J) qPCR analysis for AXIN2 in day 9 dorsal and ventral foregut cultures with or without SOX2 exogenously expressed. (K) Plotted TPM values for Wnt antagonists SFRP1, SFRP2, and DKK1 from RNA-seq of AFG cultures. (L) Proposed model on role of Sox2 in dorsal-ventral patterning of the anterior foregut. Scale bar = 100μm. See materials and methods & quantification and statistical analysis section for details. See also Figure S7 and Table S3.

Comment in

References

    1. Andl CD, Mizushima T, Nakagawa H, Oyama K, Harada H, Chruma K, Herlyn M, and Rustgi AK (2003). Epidermal growth factor receptor mediates increased cell proliferation, migration, and aggregation in esophageal keratinocytes in vitro and in vivo. Journal of Biological Chemistry, 278(3), 1824–1830. 10.1074/jbc.M209148200 - DOI - PubMed
    1. Arnold K, Sarkar A, Yram MA, Polo JM, Bronson R, Sengupta S, Seandel M, Geijsen N, and Hochedlinger K (2011). Sox2+ Adult Stem and Progenitor Cells Are Important for Tissue Regeneration and Survival of Mice. Cell Stem Cell, 9(4), 317–329. 10.1016/j.stem.2011.09.001 - DOI - PMC - PubMed
    1. Bamberger C, Pollet D, and Schmale H (2002). Retinoic acid inhibits downregulation of DeltaNp63alpha expression during terminal differentiation of human primary keratinocytes. The Journal of Investigative Dermatology, 118(1), 133–8. 10.1046/j.0022-202x.2001.01649.x - DOI - PubMed
    1. Bayha E, Jørgensen MC, Serup P, and Grapin-Botton A (2009). Retinoic acid signaling organizes endodermal organ specification along the entire antero-posterior axis. PloS One, 4(6), e5845 10.1371/journal.pone.0005845 - DOI - PMC - PubMed
    1. Chen H, Li J, Li H, Hu Y, Tevebaugh W, Yamamoto M, Que J, and Chen X (2012). Transcript profiling identifies dynamic gene expression patterns and an important role for Nrf2/Keap1 pathway in the developing mouse esophagus. PloS One, 7(5), e36504 10.1371/journal.pone.0036504 - DOI - PMC - PubMed

Publication types

Substances