. 2019 Jan 8;29(1):174-182.e5.
doi: 10.1016/j.cmet.2018.08.020. Epub 2018 Sep 20.

Inhibition of Acetyl-CoA Carboxylase by Phosphorylation or the Inhibitor ND-654 Suppresses Lipogenesis and Hepatocellular Carcinoma

Affiliations

Inhibition of Acetyl-CoA Carboxylase by Phosphorylation or the Inhibitor ND-654 Suppresses Lipogenesis and Hepatocellular Carcinoma

James S V Lally et al. Cell Metab. .

Abstract

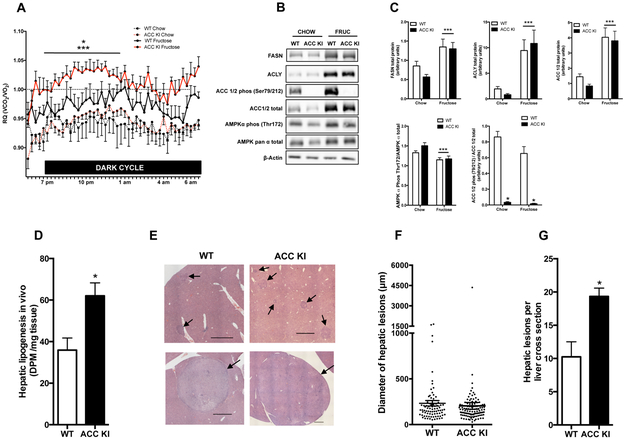
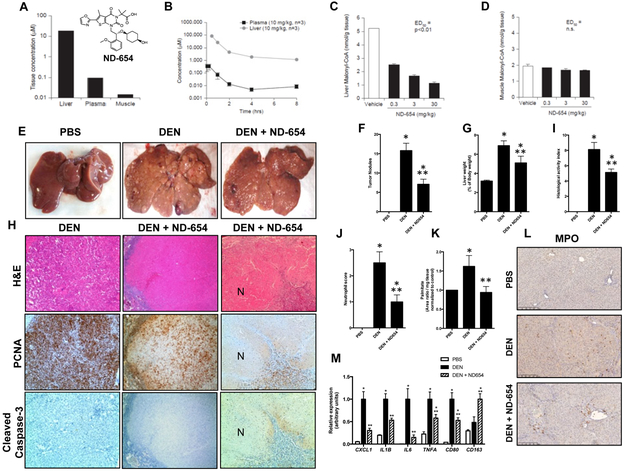
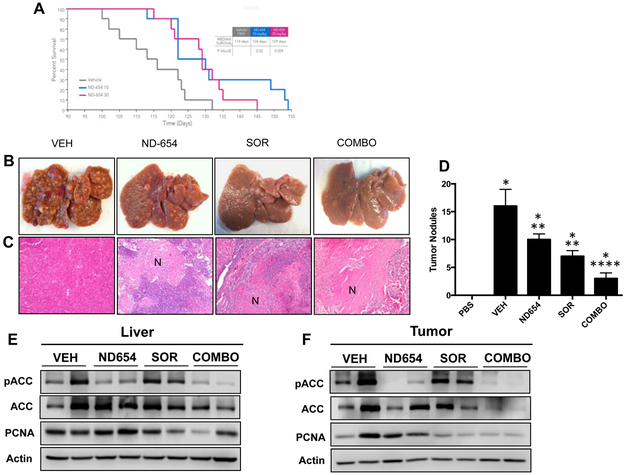
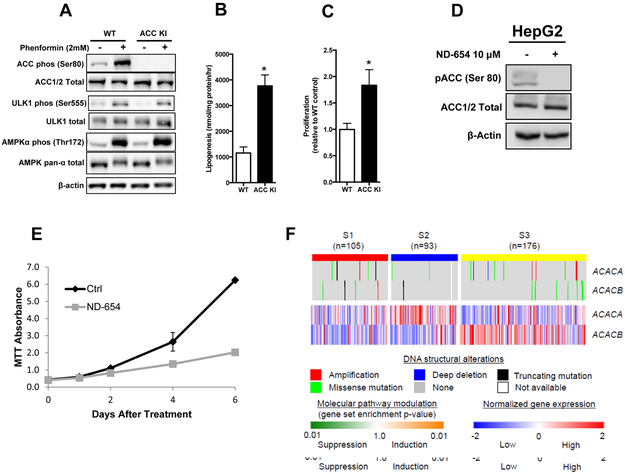
The incidence of hepatocellular carcinoma (HCC) is rapidly increasing due to the prevalence of obesity and non-alcoholic fatty liver disease, but the molecular triggers that initiate disease development are not fully understood. We demonstrate that mice with targeted loss-of-function point mutations within the AMP-activated protein kinase (AMPK) phosphorylation sites on acetyl-CoA carboxylase 1 (ACC1 Ser79Ala) and ACC2 (ACC2 Ser212Ala) have increased liver de novo lipogenesis (DNL) and liver lesions. The same mutation in ACC1 also increases DNL and proliferation in human liver cancer cells. Consistent with these findings, a novel, liver-specific ACC inhibitor (ND-654) that mimics the effects of ACC phosphorylation inhibits hepatic DNL and the development of HCC, improving survival of tumor-bearing rats when used alone and in combination with the multi-kinase inhibitor sorafenib. These studies highlight the importance of DNL and dysregulation of AMPK-mediated ACC phosphorylation in accelerating HCC and the potential of ACC inhibitors for treatment.

Keywords: NAFLD; NASH; cancer metabolism; fibrosis; fructose; inflammation; malonyl-CoA; non-alcoholic fatty liver disease; non-alcoholic steatohepatitis.


Conflict of interest statement

Declaration of Interests

Jamie Bates, Hailing Sun, Ting Wang, Henry Liu, and Adrian S. Ray are employees of Gilead Sciences. Jeremy Greenwood and Sathesh Bhat are employees of Schrodinger. Geraldine Harriman, Wenyan Miao, Jennifer L. Rocnik, William F. Westlin, H. James Harwood, Jr., and Rosana Kapeller are employees of Nimbus Therapeutics. Bryan C. Fuchs received research support from Nimbus Therapeutics.

Figures

Figure 1.
Figure 1.. AMPK phosphorylation of ACC is vital for limiting hepatocarcinogenesis and cellular proliferation.
(A) The RQ of WT and ACC KI mice during the dark cycle (7 pm- 7 am) after being maintained on either a chow diet alone or chow diet plus fructose for 4 months (n= 4 WT chow, n=5 WT fructose, n=7 ACC KI chow, n=7 ACC KI fructose). (B) and (C) Protein levels of FASN, ACLY, ACC total protein, ACC phospho-Ser79, AMPK α total protein, AMPK α phospho-Thr172 and β-actin in the liver from WT and ACC KI mice (n= 4 WT chow, n=5 WT fructose, n=6 ACC KI chow, n=6 ACC KI fructose). (D) Incorporation of [3H]acetate into total hepatic lipid (n=4). Representative images (E), diameter (F) and number (G) of hepatic lesions in photomicrographs of livers from DEN-treated ACC KI and WT mice maintained on fructose diet for 4 months (Haematoxylin and eosin stain, bar represents 1000 μm, n= 8 WT, n=6 ACC KI). * significantly different WT fructose vs ACC KI fructose, p < 0.05 ** significantly different from WT, p < 0.05 *** main effect of diet, p < 0.05
Figure 2.
Figure 2.. ND-654 selectively targets the liver and inhibits HCC proliferation.
(A inset) The structure of ND-654. (A-B) Rats were treated with a single oral dose of 10 mg/kg ND-654 and the concentration of ND-654 was measured (A) after 1 hour in the liver, muscle and plasma and (B) over 8 hours in the liver and plasma. (C-D) Rats were treated with a single oral dose of different concentrations of ND-654 (0.3, 3, and 30 mg/kg) and the presence of malonyl CoA was determined after 1 hour in (C) the liver and (D) muscle. (E-M) Male Wistar rats were separated into three groups (n = 8 per group). The first group received weekly intraperitoneal (IP) injections of PBS as control for 18 weeks. The second group received weekly IP injections of DEN (50 mg/kg diluted in PBS) for 18 weeks. The third group received weekly IP injections of DEN for 18 weeks as above and were also treated with ND-654 (10 mg/kg) once daily by oral gavage beginning at 15 weeks. In the DEN model, rats develop liver fibrosis after 8 weeks which progresses to cirrhosis at 13 weeks and HCC beginning at 15 weeks. (E) Representative images of gross livers are shown. (F) Tumor nodules ≥5 mm were counted. (G) Liver weight (LW) as a percentage of body weight (BW) was measured at the end of the study. (H) Representative images of H&E, proliferating cell nuclear antigen (PCNA; proliferative marker) and cleaved caspase-3 (apoptosis marker) staining of tumor are shown (100X magnification). The left column shows a representative tumor from the DEN group, the middle column and right columns show representative tumors from the DEN + ND-654 (10 mg/kg) group with reduced proliferation and extensive necrosis (N), respectively. (I) The Histological Activity Index (HAI) and (J) the presence of neutrophils were scored blindly by a GI pathologist. (K) Palmitate levels were measured. (L) Representative images of myeloperoxidase (MPO) staining are shown. (M) Inflammation-related gene expression in liver tissue was quantified. * significantly different from PBS, p < 0.05 ** significantly different from DEN, p < 0.05
Figure 3.
Figure 3.. ND-654 improves survival and the efficacy of sorafenib in cirrhotic rats with HCC.
(A) Male Wistar rats were separated into three groups (n = 10 per group). The first group received weekly IP injections of DEN (50 mg/kg diluted in PBS), the second and third groups received weekly IP injections of DEN as above and were also treated with either 10 or 30 mg/kg ND-654 once daily by oral gavage beginning at 14 weeks. Survival was examined by a Kaplan-Meier analysis. For combination studies, DEN-injured rats received vehicle control (VEH), 10 mg/kg ND-654 (ND-654), 10 mg/kg sorafenib (SOR), or the combination of 10 mg/kg ND-654 and 10 mg/kg sorafenib (COMBO) by oral gavage for 5 weeks. (B) Representative images of whole livers are shown. (C) Representative images of H&E stainings of tumor illustrating increased necrosis (N) in treated tumors (100X magnification). (D) Tumor nodules ≥5 mm were counted. (E and F) Levels of phosphorylated ACC (p-ACC), total ACC, proliferating cell nuclear antigen (PCNA), and actin were measured by western blot analysis in (E) liver tissue and (F) tumors (representative blot from 3 independent experiments). * significantly different from PBS, p < 0.05 ** significantly different from DEN, p < 0.05 **** significantly different from DEN, DEN + ND-654, and DEN + SOR, p < 0.05
Figure 4.
Figure 4.. AMPK phosphorylation of ACC limits HepG2 proliferation.
(A) AMPK Thr172, ACC Ser80, and ULK1 (Ser555) phosphorylation in WT and ACC KI HepG2 cells after treatment with phenformin (2 mM) for 1 hour (representative blot from 3 independent experiments). (B) De novo lipogenesis measured by incorporation of 3[H]acetate into lipid over 1 hour (means of two independent experiments performed in triplicate) and (C) Proliferation in WT and ACC KI HepG2 cells over 72 hours (n=7). (D) HepG2 cells were treated with or without ND-654 (10 μM) for 72 hours and levels of p-ACC, total ACC, and actin were measured by western blot analysis (representative blot from 3 independent experiments). (E) Proliferation in HepG2 cells treated with or without ND-654 (10 μM) was measured at 1 day, 2 days, 4 days, and 6 days post treatment by an MTT assay (representative results from 3 independent experiments). (F) Genomic DNA structural alterations and expression of ACC genes in 374 human HCC tissues are shown according to the transcriptomic HCC subtypes (S1, S2, and S3 subtypes). * significantly different from WT cells, p < 0.05

References

    1. Amanzada A, Malik IA, Nischwitz M, Sultan S, Naz N, and Ramadori G (2011). Myeloperoxidase and elastase are only expressed by neutrophils in normal and in inflamed liver. Histochem Cell Biol 135, 305–315. - PMC - PubMed
    1. Baffy G, Brunt EM, and Caldwell SH (2012). Hepatocellular carcinoma in nonalcoholic fatty liver disease: an emerging menace. J Hepatol 56, 1384–1391. - PubMed
    1. Calvisi DF, Wang C, Ho C, Ladu S, Lee SA, Mattu S, Destefanis G, Delogu S, Zimmermann A, Ericsson J, et al. (2011). Increased lipogenesis, induced by AKT-mTORC1-RPS6 signaling, promotes development of human hepatocellular carcinoma. Gastroenterology 140, 1071–1083. - PMC - PubMed
    1. DePeralta DK, Wei L, Ghoshal S, Schmidt B, Lauwers GY, Lanuti M, Chung RT, Tanabe KK, and Fuchs BC (2016). Metformin prevents hepatocellular carcinoma development by suppressing hepatic progenitor cell activation in a rat model of cirrhosis. Cancer 122, 1216–1227. - PMC - PubMed
    1. Donnelly KL, Smith CI, Schwarzenberg SJ, Jessurun J, Boldt MD, and Parks EJ (2005). Sources of fatty acids stored in liver and secreted via lipoproteins in patients with nonalcoholic fatty liver disease. J Clin Invest 115, 1343–1351. - PMC - PubMed

Publication types