Clinical Trial
. 2018 Nov 6;28(5):679-688.e4.
doi: 10.1016/j.cmet.2018.08.021. Epub 2018 Sep 20.

Integrated Pharmacodynamic Analysis Identifies Two Metabolic Adaption Pathways to Metformin in Breast Cancer

Affiliations
Clinical Trial

Integrated Pharmacodynamic Analysis Identifies Two Metabolic Adaption Pathways to Metformin in Breast Cancer

Simon R Lord et al. Cell Metab. .

Abstract

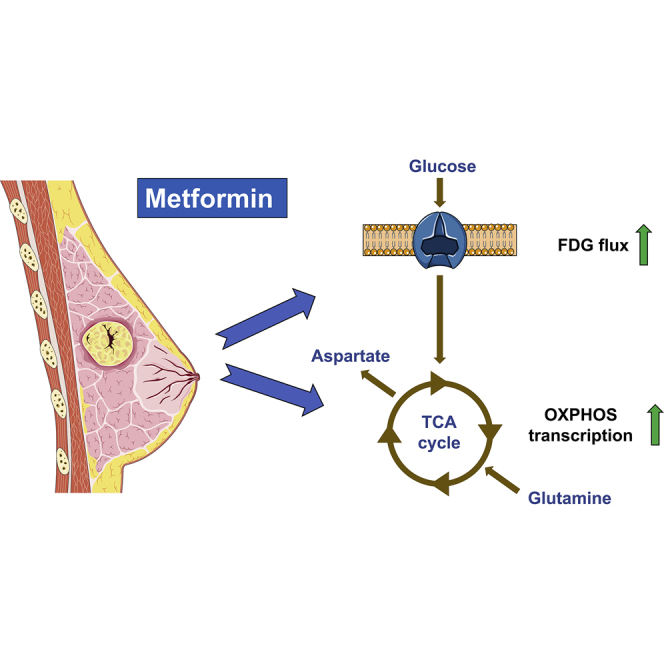
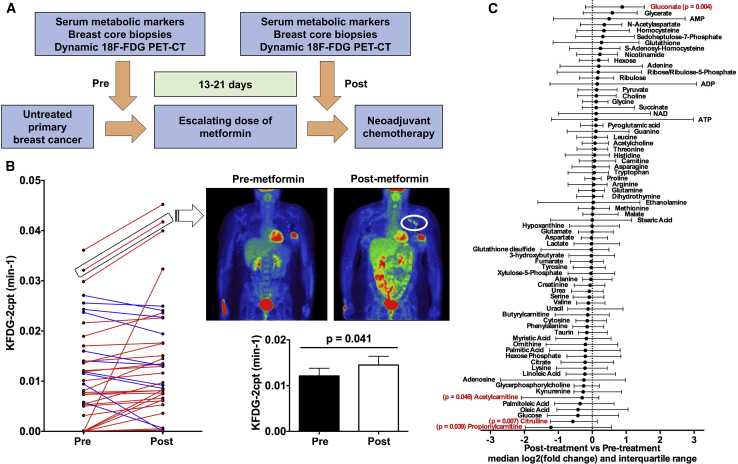
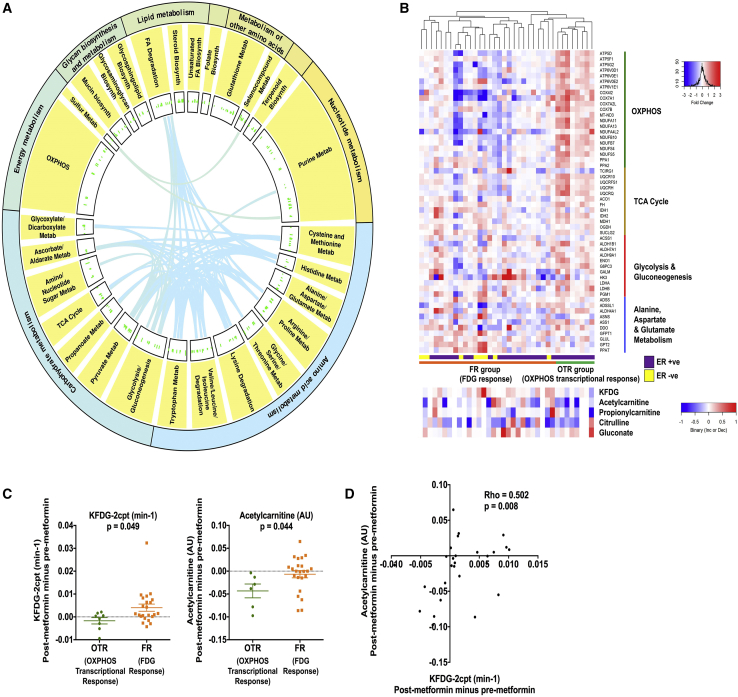
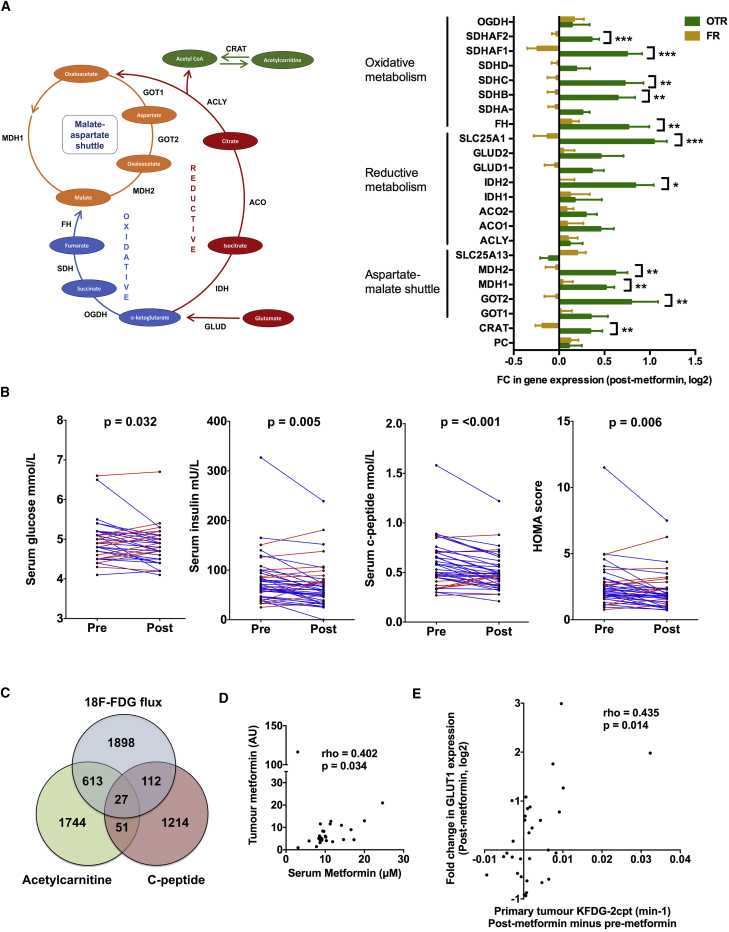
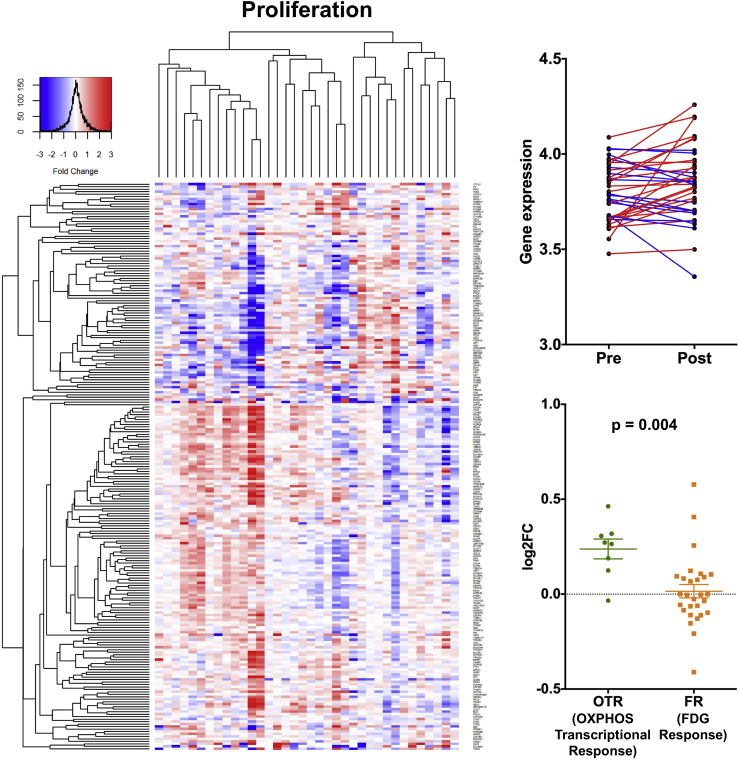
Late-phase clinical trials investigating metformin as a cancer therapy are underway. However, there remains controversy as to the mode of action of metformin in tumors at clinical doses. We conducted a clinical study integrating measurement of markers of systemic metabolism, dynamic FDG-PET-CT, transcriptomics, and metabolomics at paired time points to profile the bioactivity of metformin in primary breast cancer. We show metformin reduces the levels of mitochondrial metabolites, activates multiple mitochondrial metabolic pathways, and increases 18-FDG flux in tumors. Two tumor groups are identified with distinct metabolic responses, an OXPHOS transcriptional response (OTR) group for which there is an increase in OXPHOS gene transcription and an FDG response group with increased 18-FDG uptake. Increase in proliferation, as measured by a validated proliferation signature, suggested that patients in the OTR group were resistant to metformin treatment. We conclude that mitochondrial response to metformin in primary breast cancer may define anti-tumor effect.

Trial registration: ClinicalTrials.gov NCT01266486.

Keywords: breast neoplasms; cancer metabolism; clinical study; gene expression profiling; metabolomics; metformin; mitochondria; positron emission tomography.


Figures

None
Graphical abstract
Figure 1
Figure 1
Trial Design and Imaging Analysis (A) Study design. Shortly after diagnosis, patients with untreated primary breast cancer received 13–21 days of slow release metformin at escalating dose levels (500 mg for days 13, 1,000 mg for days 4–6, and 1,500 mg thereafter) with core biopsies taken pre- and post-metformin before proceeding to neoadjuvant chemotherapy. (B) Change in the FDG flux constant KFDG-2cpt of the primary tumor in individual patients (left panel) and overall (lower right panel) pre- and post-metformin (n = 36, paired t test; data shown are means ± SEM). Upper right panel: static PET-CT images in coronal plane pre- and post-metformin are from an individual with an increase in KFDG-2cpt following metformin; note increased uptake in axillary lymph nodes (circled). (C) Median fold change and interquartile range for metabolites pre- and post-metformin. Metabolites with statistically significant absolute change on Wilcoxon signed rank test are shown in red with p values (n = 29). See also Figure S1 and Tables S1–S3.
Figure 2
Figure 2
Metformin Alters Levels of Mitochondrial Metabolites and Increases OXPHOS Relevant Gene Transcription in a Subset of Patients (A and B) Circos plot to show all significantly upregulated metabolic pathways in the KEGG database. The width of the outer and inner circles show the mean relative abundances for the broadest hierarchy and secondary hierarchy. The bars in the innermost circle represent the mean relative abundances for genes encoding proteins within the individual pathways. The curved lines link genes that are shared among different pathways as indexed by KEGG (A). Heatmap of differentially expressed genes from the following KEGG pathways: oxidative phosphorylation (KEGG:00190); TCA cycle (KEGG:00020); glycolysis and gluconeogenesis (KEGG:00010); alanine, aspartate, and glutamate metabolism (KEGG:00250). Each row represents a gene and each column represents a single patient (n = 36). Colors reflect the fold change for each gene post-metformin: red, upregulation; blue, downregulation. Samples were visually clustered using hierarchical clustering. OXPHOS transcriptional response (OTR) and FDG response (FR) groups shown. Shown below is heatmap of change in significantly altered metabolites and KFDG-2cpt (all post minus pre) for same individual patients (B). (C) Scatterplot to show for the OTR and FR groups change in KFDG-2cpt and acetylcarnitine levels for the breast primary tumor (both post minus pre). Data shown are means ± SEM, unpaired t test. (D) Correlation between change in KFDG-2cpt and acetylcarnitine (both post minus pre). Spearman's rank correlation coefficient and significance are shown. See also Figure S2 and Table S4.
Figure 3
Figure 3
Effect of Metformin on Systemic Metabolism (A) Change in expression of genes involved in regulation of aspartate/malate shuttle and oxidative and reductive metabolism, unpaired t test (n = 36). Data shown are means ± SEM. p < 0.05; ∗∗p < 0.01; ∗∗∗p < 0.001. (B) Pre- and post-metformin serum glucose, insulin, insulin growth factor-1 levels, and HOMA score for individual patients. Significant decrease for each host metabolic marker, p value shown (paired t test, n = 40). (C) Venn diagram to show overlap of all genes whose change in expression correlated with either change in systemic levels of circulating c-peptide or tumor KFDG-2cpt or tumor acetylcarnitine. (D and E) Correlation between peak serum metformin levels (2 hr post dose) and tumor metformin levels (D). Correlation between change in KFDG-2cpt (post minus pre) and GLUT1 expression (log2FC) for the breast primary tumor (E). Spearman's rank correlation coefficient and significance are shown for (D) and (E). See also Figure S3 and Tables S5 and S6.
Figure 4
Figure 4
Effect of Metformin on Proliferation Left panel: heatmap of genes from the proliferation signature. Each row represents a gene and each column represents a single patient. Colors reflect the fold change for each gene post-metformin: red, upregulation; blue, downregulation. Samples were visually clustered using hierarchical clustering. Right upper panel: pre- and post-metformin expression of signatures for individual patients (n = 36); right lower panel, scatterplot to show change in expression of signatures for the OTR and FR groups. Data shown are means ± SEM, unpaired t test (n = 36).

Comment in

References

    1. Anders S., Huber W. Differential expression analysis for sequence count data. Genome Biol. 2010;11:R106. - PMC - PubMed
    1. Ben Sahra I., Laurent K., Giuliano S., Larbret F., Ponzio G., Gounon P., Le Marchand-Brustel Y., Giorgetti-Peraldi S., Cormont M., Bertolotto C. Targeting cancer cell metabolism: the combination of metformin and 2-deoxyglucose induces p53-dependent apoptosis in prostate cancer cells. Cancer Res. 2010;70:2465–2475. - PubMed
    1. Bertoldo A., Peltoniemi P., Oikonen V., Knuuti J., Nuutila P., Cobelli C. Kinetic modeling of [(18)F]FDG in skeletal muscle by PET: a four-compartment five-rate-constant model. Am. J. Physiol. Endocrinol. Metab. 2001;281:E524–E536. - PubMed
    1. Birsoy K., Possemato R., Lorbeer F.K., Bayraktar E.C., Thiru P., Yucel B., Wang T., Chen W.W., Clish C.B., Sabatini D.M. Metabolic determinants of cancer cell sensitivity to glucose limitation and biguanides. Nature. 2014;508:108–112. - PMC - PubMed
    1. Birsoy K., Wang T., Chen W.W., Freinkman E., Abu-Remaileh M., Sabatini D.M. An essential role of the mitochondrial electron transport chain in cell proliferation is to enable aspartate synthesis. Cell. 2015;162:540–551. - PMC - PubMed

Publication types

MeSH terms

Associated data