. 2018 Oct 18;175(3):665-678.e23.
doi: 10.1016/j.cell.2018.08.049. Epub 2018 Sep 20.

A Neural Circuit for Gut-Induced Reward

Affiliations

A Neural Circuit for Gut-Induced Reward

Wenfei Han et al. Cell. .

Erratum in

  • A Neural Circuit for Gut-Induced Reward.
    Han W, Tellez LA, Perkins MH, Perez IO, Qu T, Ferreira J, Ferreira TL, Quinn D, Liu ZW, Gao XB, Kaelberer MM, Bohórquez DV, Shammah-Lagnado SJ, de Lartigue G, de Araujo IE. Han W, et al. Cell. 2018 Oct 18;175(3):887-888. doi: 10.1016/j.cell.2018.10.018. Cell. 2018. PMID: 30340046 No abstract available.

Abstract

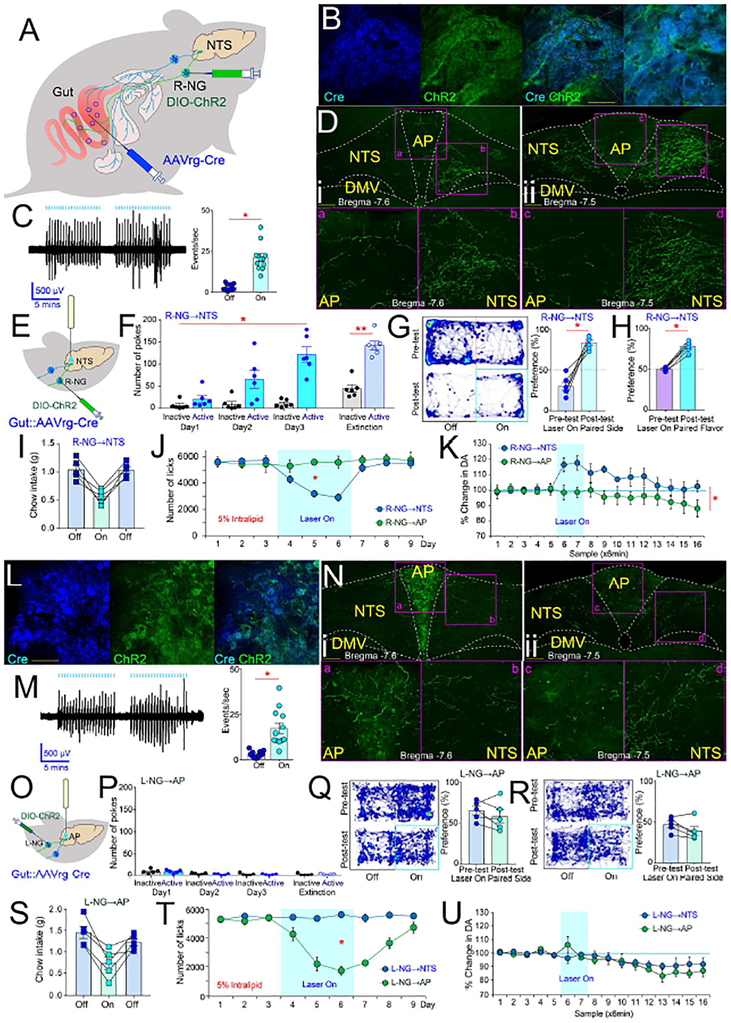
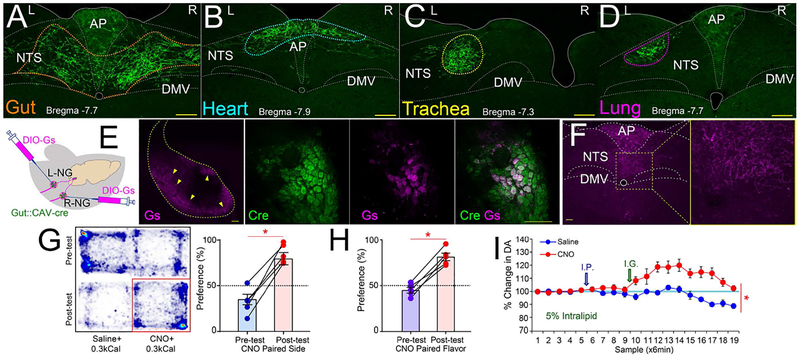
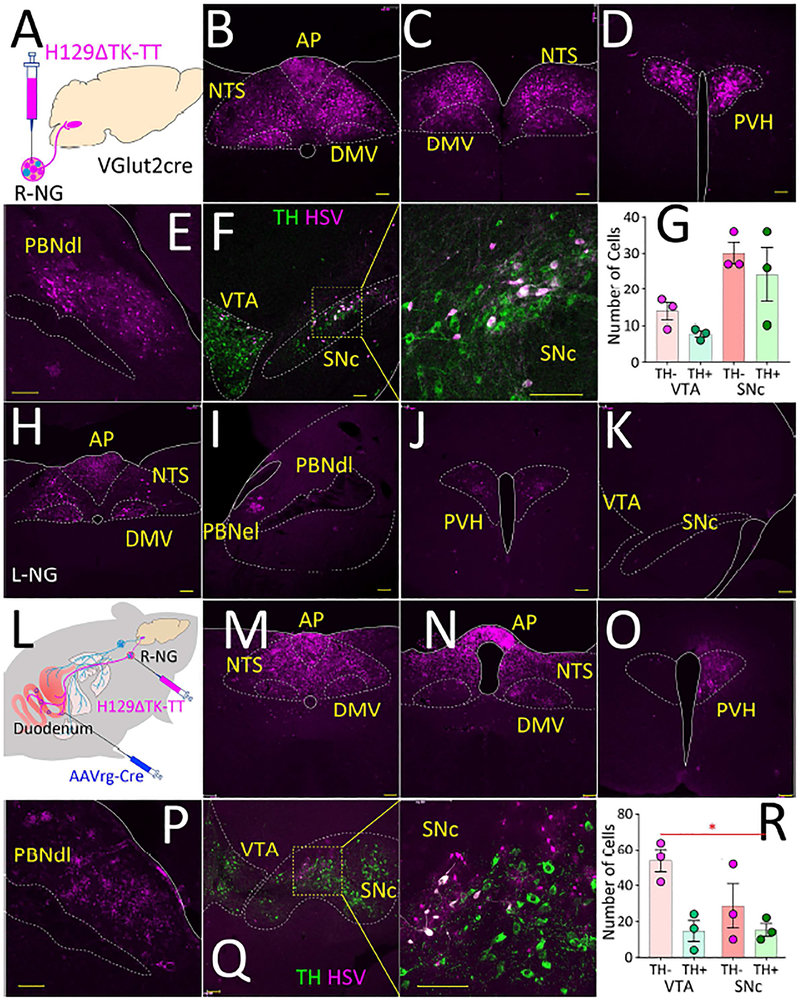
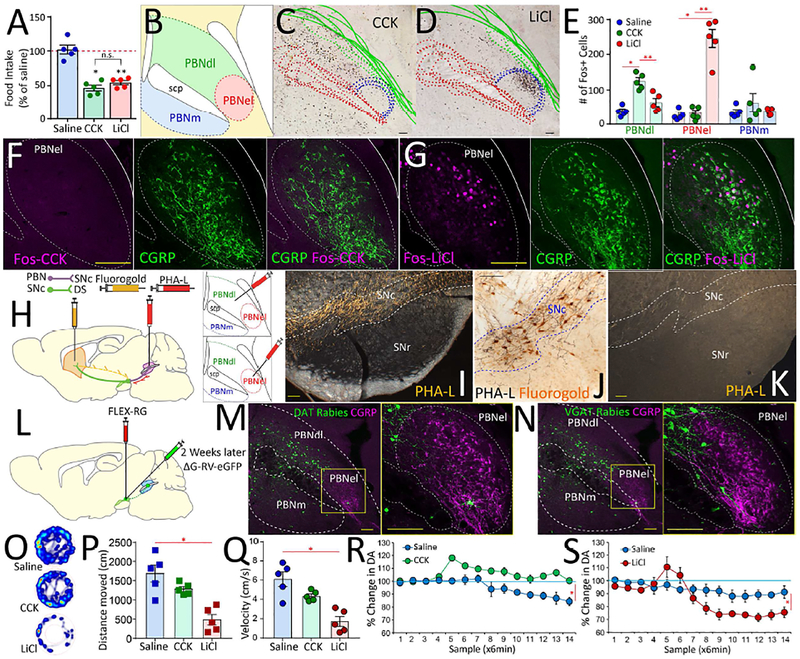
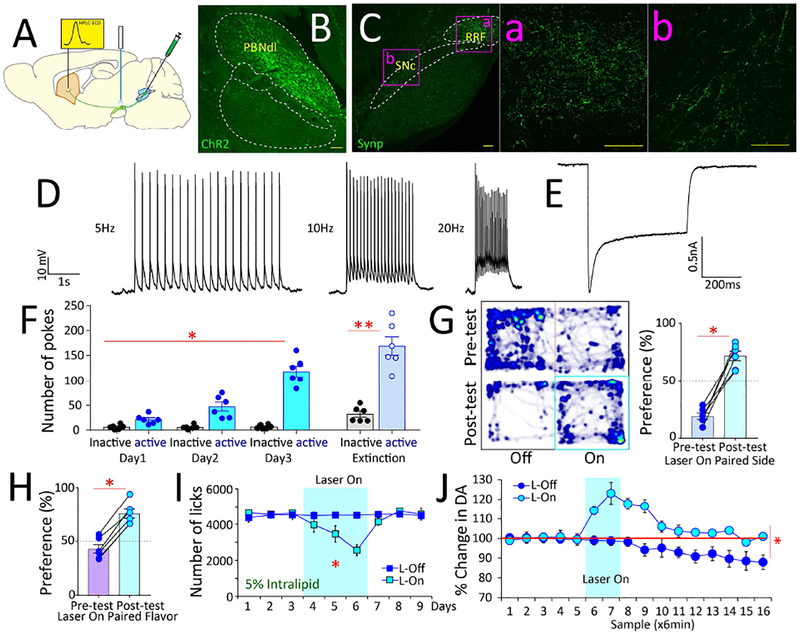
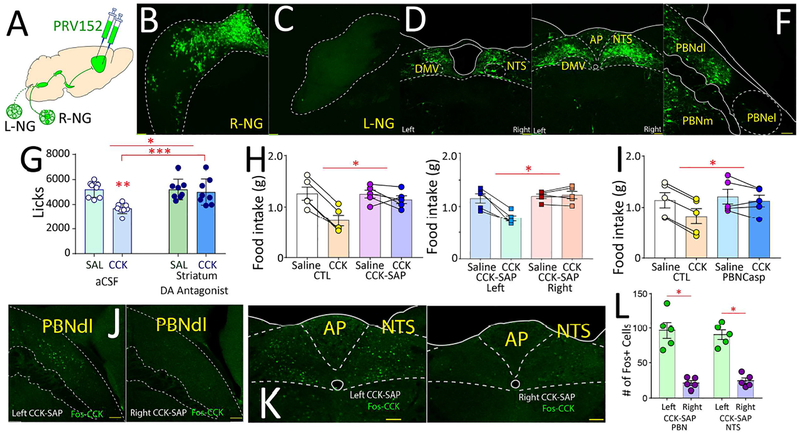
The gut is now recognized as a major regulator of motivational and emotional states. However, the relevant gut-brain neuronal circuitry remains unknown. We show that optical activation of gut-innervating vagal sensory neurons recapitulates the hallmark effects of stimulating brain reward neurons. Specifically, right, but not left, vagal sensory ganglion activation sustained self-stimulation behavior, conditioned both flavor and place preferences, and induced dopamine release from Substantia nigra. Cell-specific transneuronal tracing revealed asymmetric ascending pathways of vagal origin throughout the CNS. In particular, transneuronal labeling identified the glutamatergic neurons of the dorsolateral parabrachial region as the obligatory relay linking the right vagal sensory ganglion to dopamine cells in Substantia nigra. Consistently, optical activation of parabrachio-nigral projections replicated the rewarding effects of right vagus excitation. Our findings establish the vagal gut-to-brain axis as an integral component of the neuronal reward pathway. They also suggest novel vagal stimulation approaches to affective disorders.

Keywords: dopamine; gut-brain axis; reward; vagus nerve.


Conflict of interest statement

Declaration of Interests

The authors declare no competing interests.

Figures

Figure 1
Figure 1. Gut-brain optogenetics
A. Combinatorial viral strategy to target gut vagal sensory neurons. B. Cre-EBFP and DIO-ChR2-EYFP detected in R-NG. Bar=100μM. C. Left panel: Vagal nerve fiber activity upon light stimulation of R-NG DIO-ChR2-EYFP-positive neurons. Trace shows responses locked to light pulses (blue bars on top). Right panel: Supra-threshold events during nerve recordings. N=12; paired t-test t[11]=8.7 *p<0.001. D. R-NG DIO-ChR2-EYFP-positive terminals innervate ventromedial NTS at both anterior (i) and caudal (ii) levels (10×). Lower panels show delimited areas at 40×. AP (a and c) innervation was weaker than NTS (b and d) at both anterior (i) and caudal (ii) levels. Bar=100μM. E. Optical fibers above R-NG terminals in NTS. F. RNG→NTS optical stimulation sustains self-stimulation. N=6; Two-way RM-ANOVA, Main effect of poking on the laser-paired hole vs. inactive hole F[1,5]=60.4, p=0.001. Mice gradually increased the number of responses over daily sessions: Main effect of session, F[2,10]=8.0, p=0.008. Increases in response rates were specific to poking on the laser-paired hole: Laser × session interaction effect: F[2,10]=13.7, *p =0.001. During laser-off extinction tests, mice poked significantly more on the laser-paired hole, paired t-test t[5]=16.3, **p<0.001. G. R-NG→NTS optical stimulation induces place preferences. Left panel: Representative heat map showing the pre-test baseline (upper) and on-line place preference (lower). Right panel: Place preference for laser-paired side, N=6; paired t-test t[5]=7.2, *p=0.001. H. R-NG→NTS optical stimulation induces flavor preferences. Post-conditioning flavor preferences for laser-paired flavors N=6; paired t-test t[5]=14.8, *p<0.001. For one-sample t-tests against 50% (indifference) preferences: Preconditioning: t[5]=0.1, p=0.89; Post-conditioning, t[5]=10.8 Bonferroni-corrected p<0.0001. I. R-NG→NTS optical stimulation reduces chow intake. N=5, three daily sessions (laser on day 2), one-way RM-ANOVA F[2,8]=34.6, *p<0.0001). J. Optical stimulation of R-NG→NTS, but not R-NG→AP, induced robust satiety during 5% IntraLipid intake tests. Shaded blue area indicates sessions when laser was ON. N=5, two-way mixed effects ANOVA, group × session interaction: F[8,64]=7.8, *p<0.001. K. Optical stimulation of RNG→NTS, but not R-NG→AP, fibers induced robust dopamine release in dorsal striatum. Shaded blue area indicates sessions when laser was ON. N=5, two-way mixed effects ANOVA between-group × time interaction effect F[15,120]=3.4, *p<0.0001. L. Cre-EBFP and DIO-ChR2-EYFP detected in L-NG. Bar=100μM. M. Left panel: Vagal nerve fiber activity upon light stimulation of L-NG DIO-ChR2-EYFP-positive neurons. Responses were mostly locked to light pulses (blue bars on top). Right panel: Supra-threshold events during nerve recordings. N=12; paired t-test t[11]=4.7 *p=0.001. N. L-NG DIO-ChR2-EYFP-positive terminals substantially innervated AP at more caudal (i) but not anterior (ii) levels (10×). Lower panels show the delimited areas at 40×. NTS (b and d) innervation was weaker than AP (a and c) at more caudal (i) but not anterior (ii) levels. Bar=100μM. O. Optical fibers above L-NG terminals in AP. P. LNG→AP optical stimulation failed to sustain self-stimulation. N=5; Two-way RM-ANOVA, Laser × session interaction effect: F[2,8]=0.7, p=0.5. During laser-off extinction tests, mice failed to poke more on the laser-paired hole, paired t-test t[4]=0.1, p=0.8. Q-R. L-NG→AP optical stimulation failed to induce online place preferences (laser paired to less preferred location, t[4]=1.2, p=0.3, panel Q) or aversions (laser paired to more preferred location, t[4]=2.0, p=0.1 panel R). S. L-NG→AP optical stimulation reduces chow intake. N=5, three daily sessions (laser on day 2), one-way RM-ANOVA F[2,8]=16.5, *p=0.001). T. Optical stimulation of L-NG→AP, but not L-NG→NTS, induced satiety during 5% IntraLipid intake. Shaded blue area = laser ON. N=5, two-way mixed effects ANOVA, group × session interaction: F[8,64]=18.6, *p<0.001. U. Optical stimulation of neither L-NG→AP nor L-NG→NTS induced dopamine release in DS. Shaded blue area = laser ON. N=5, two-way mixed effects ANOVA between-group × time interaction F[15,120]=0.8, p=0.6. AP= area postrema; DMV=dorsal motor nucleus of vagus; NTS=nucleus of the tractus solitarius. Data reported as mean±SEM.
Figure 2
Figure 2. Organ-specific maps of gut vagal afferents
A-D. The retrograde Cre-carrying construct AAVrg-pmSyn1-EBFP-Cre was injected into upper gut, heart, lung or trachea. In all cases, DIO-ChR2-EYFP was bilaterally injected into nodose ganglia. Gut (panel A), heart (B), trachea (C), and lung (D) terminal sites were restricted to distinctively separate sites within the solitary complex. Additional sections shown in Figures S2A–D. E. The upper gut of mice was injected with the retrograde construct CAV2-Cre-GFP, and nodose ganglia were bilaterally injected with a Cre-inducible AAV-Gs-coupled-mCherry chemogenetic designer receptor construct. CAV2-Cre-GFP and AAV-DIO-GsmCherry were detected in nodose ganglia bilaterally. Middle panel: mCherry expression is restricted to outermost nodose neurons (10×, Bar=100 M). Right panel: 40×, Bar=100 M. F. AAV-DIO-Gs-mCherry-infected terminals by injections into both right nodose (terminal fibers in medial NTS) and left nodose (terminal fibers in AP). G. CNO injections induce place preferences. During conditioning, in all sessions animals were administered I.G. with IntraLipid (0.3kcal, 0.6ml). CNO injections were then paired to the less preferred side of the cage. Left panel: Representative heat map showing the pre-test baseline (upper) and post-CNO preferences (lower). Right panel: Place preference for CNO-paired side, N=5; paired t-test t[4]=9.2, *p=0.001. H. Post-conditioning flavor preferences for flavors paired with 5% I.G. IntraLipid (0.3kcal, 0.6ml) + CNO vs. 5% I.G. IntraLipid + saline, N=5; paired t-test t[4]=9.5, *p=0.001. For one-sample t-tests against 50% (indifference) preferences: Pre-conditioning: t[4]=1.6, p=0.18; Post-conditioning, t[4]=7.5, Bonferroni-corrected p=0.004. I. CNO injections significantly enhanced dopamine release in dorsal striatum induced by 5% I.G. IntraLipid (0.3kcal, 0.6ml), N=6; Two-way RM-ANOVA CNO × sampling time interaction effect F[18,72]=7.59, *p<0.0001. AP= area postrema; DMV=dorsal motor nucleus of vagus; NTS=nucleus of the tractus solitarius. Data reported as mean±SEM.
Figure 3
Figure 3. Transsynaptic labeling of central vagal pathways
A. VGlut2-ires-Cre mice were injected with the Cre-inducible, transsynaptic Herpes Simplex Viruses 1 strain H129ΔTK-TT into the right nodose ganglion (R-NG). B-C. Forty-eight hours after the injections, infection was restricted to the dorsal vagal complex (AP, DMV, NTS) at more caudal (B) and rostral (C) levels. D-E. Seventy-two hours after injection infection was detected at NTS targets including PVH and PBNdl. F. Ninety-six hours after injections infection was detected in SNc, including in dopaminergic, tyrosine hydroxylase-positive (TH, green) cells. G. Numbers of herpes-infected cells in SNc and VTA, including both GABAergic and TH+ cells (values correspond to average numbers of infected cells per section, N=3 mice). H-K. The left nodose ganglion (L-NG) was injected with H129ΔTK-TT. Infection was observed in the dorsal vagal complex (AP, DMV, NTS), PVH, PBNel. Note absence of herpes labeling in PBNdl, VTA and SNc. L. Upper gut transfected with AAVrg-pmSyn1-EBFP-Cre, right nodose ganglion (R-NG) then injected with H129ΔTK-TT. M-Q. Infection was observed in the dorsal vagal complex (AP, DMV, NTS), PVH, PBNdl, PBNel, and SNc. R. Numbers of herpes-infected cells in SNc and VTA, including both GABAergic and TH+ cells (values correspond to average numbers of infected cells per section, N=3 mice, main effect of cell type F[1,2]=28.76, *p=0.03). AP = area postrema; DMV = dorsal motor nucleus of the vagus; NTS = nucleus of the solitary tract; PBNdl = parabrachial nucleus, dorsolateral region; PBNel = parabrachial nucleus, externolateral part; PVH = paraventricular nucleus of the hypothalamus; SNc = Substantia nigra, pars compacta; VTA = ventral tegmental area. Bars=100μM. Data reported as mean±SEM.
Figure 4
Figure 4. Valence-specific organization of the lateral parabrachial area
A. Intraperitoneal doses of CCK and LiCl, were titrated to induce ~50% reduction in food intake. Main effect of treatment F[2,12]=38.65 p<0.001. N=5; Paired t-test saline vs. CCK Bonferroni p<0.001; saline vs. LiCl Bonferroni p<0.001; CCK vs. LiCl p=0.8. B. The mouse parabrachial area. PBNdl = parabrachial nucleus, dorsolateral region; PBNel = externolateral parabrachial nucleus; PBNm = medial parabrachial nucleus; scp = superior cerebellar peduncle (brachium conjunctivum). C-D. Compounded image of parabrachial sections showing Fos expression patterns in response to CCK (C) and LiCl (D) across 5 mice. E. Fos+ cells in response to CCK or LiCl. PBNdl specifically responded to CCK, whereas PBNel specifically responded to LiCl. No responses for saline injections. N=5 in each group. Main effect of treatment in PBNdl: F[2,12]=21.9, p<0.0001; Post-hoc two-sample t-tests saline vs. LiCl p=0.249; saline vs. CCK Bonferroni *p<0.001; LiCl vs. CCK Bonferroni **p=0.002. Main effect of treatment in PBNel: F[2,12]=59.5, p<0.0001; Post-hoc two-sample t-tests saline vs. LiCl Bonferroni *p<0.001; saline vs. CCK p=0.9; LiCl vs. CCK Bonferroni **p<0.001. Main effect of treatment in medial PBN (PBNm): F[2,12]=0.8, p=0.471; Post-hoc two-sample t-tests all p>0.85. F. No Fos expression in response to CCK was observed in PBNel (left), in particular no CGRP+ neurons (center) were found to express Fos in response to CCK (right). G. Robust Fos expression in response to LiCl was observed in PBNel (left). The region containing CGRP+ neurons (center) was found to include most of the LiCl-responding Fos-positive neurons (right). H. The anterograde tracer PHA-L was iontophoretically injected into either PBNdl or PBNel; in the same PBNdl case the retrograde tracer FluoroGold was iontophoretically injected into the dorsal striatum. I. Darkfield photomicrographs of coronal sections revealing a substantial anterograde labeling in the SNc after an injection in PBNdl. Note that these projection patterns were highly specific, with the Substantia nigra, pars reticulata (SNr) devoid of parabrachial terminals. Scale bar 100μm. J. Brightfield photomicrograph showing PHA-L anterograde labeling from PBNdl in register with FluoroGold retrograde labeling from the dorsal striatum in the SNc, suggesting the existence of a parabrachio-nigro-striatal pathway. Scale bar 20μm. K. Fibers of passage running dorsal to the SNc, itself unlabeled, after an injection in the PBNel. Scale bar 100μm. L. To assess the cell-type specificity of the SNc targets of parabrachial projections, we transfected the SNc of both DAT-ires-Cre and VGat-ires-Cre mice with the construct AAV5-EF1a-FLEX-TVAmCherry, and two weeks after with the Cre-inducible retrogradely transported pseudotyped rabies virus SAD G-GFP. M-N. In both DAT-ires-Cre (M) and VGat-ires-Cre (N) mice, robust expression of rabies-infected cells were observed in PBNdl and to a lesser extent in PBNm on 7days post rabies infection, but virtually no rabies-infected cells were observed in PBNel, including regions containing CGRP+ cells. Bars=100μM. O. Open-field heatmaps after intraperitoneal injections of saline (upper), CCK (center), or LiCl (lower). P-Q. LiCl injections significantly reduced distance traveled (P) and velocities (Q) compared to both saline and CCK. CCK produced no significant effects on either. ANOVA F[2,12]=15.9, p=0.001 (distance), F[2,12]=16.5, p<0.001 (velocity). Post-hoc t-tests Bonferroni *p<0.05. R. CCK injections significantly enhanced dopamine release in dorsal striatum N=5; Two-way RM-ANOVA injection × sampling time interaction effect F[13,52]=5.8, *p<0.0001. S. LiCl injections significantly inhibited dopamine levels in dorsal striatum N=5; F[13,52]=29.7 *p<0.0001. Data reported as mean±SEM.
Figure 5
Figure 5. Optical activation of parabrachio-nigral vs. parabrachio-amygdalar pathways mediate reward vs. avoidance behaviors
A. DIO-ChR2-EYFP was injected into PBNdl of VGlut2-ires-Cre mice, and optical fibers placed above parabrachial terminals on SNc (PBNdl[VGlut2]→SNc pathway). Microdialysis cannulae were implanted into the dorsal striatum. B. Injection of the DIO-ChR2-EYFP construct was restricted to PBNdl. C. Similar injections of Cre-inducible synaptophysin-EYFP into the PBNdl of VGlut2-ires-Cre mice reveal dense glutamatergic parabrachial terminals in SNc and RRF (magnification shown on panels Ca, Cb). D. Action potentials (current clamp) from ChR2-expressing VGlut2 neurons in PBNdl upon optogenetic stimulation. E. Inward membrane current recorded in VGlut2-ChR2 neurons under voltage clamp. Blue bar, the application of the LED-generated blue light pulse. F. PBNdl[VGlut2]→SNc optical stimulation sustains self-stimulation behavior. N=6; Two-way RM-ANOVA, Main effect of poking on the laser-paired hole vs. inactive hole F[1,5]=88.0, p<0.001. Mice gradually increased the number of responses over daily sessions: Main effect of session, F[2,10]=62.8, p<0.001. Increases in response rates were specific to poking on the laser-paired hole: Laser × session interaction effect: F[2,10]=69.5, *p <0.001. During laser-off extinction tests, mice poked significantly more on the laser-paired hole, paired t-test t[5]=6.589, **p=0.001. G. PBNdl[VGlut2]→SNc optical stimulation induces place preferences. The laser source was switched ON whenever the mouse was detected on the less preferred side of the cage. Left panel: Representative heat map showing the pre-test baseline (upper) and on-line place preference (lower). Right panel: Place preference for laser-paired side, N=6; paired t-test t[5]=9.5, *p=0.001. H. PBNdl[VGlut2]→SNc optical stimulation induces flavor preferences. Post-conditioning flavor preferences for laser-paired flavors N=6; paired t-test t[5]=14.6, *p<0.001. For one-sample t-tests against 50% (indifference) preferences: Pre-conditioning: t[5]=1.8, p=0.127; Post-conditioning, t[5]=5.9, Bonferroni-corrected p=0.002. I. PBNdl[VGlut2]→SNc optical stimulation during ingestion of 5% IntraLipid. After daily baseline sessions 1–3, intake is reduced during laser ON sessions 4–6, and immediately returned to baseline on post-laser sessions 7–9. N=6, two-way RM-ANOVA laser × session interaction effect F[8,40]=9.4, *p<0.001. J. PBNdl[VGlut2]→SNc optical stimulation induces significant dopamine release in dorsal striatum, N=6, two-way RM-ANOVA laser × sampling time interaction effect F[15,60]=7.1, *p<0.0001. PBNdl = parabrachial nucleus, dorsolateral part; SNc: Substantia nigra, pars compacta; RRF = retrorubral field. Bars=100μM. Data reported as mean±SEM.
Figure 6
Figure 6. Right nodose-parabrachio-nigral pathway is required for vagal effects on food intake
A-F. The polysynaptic pseudorabies PRV152-GFP was injected bilaterally into dorsal striatum. Dense retrograde labeling was observed in right (B), but not left (C), nodose ganglion. In NTS, labeling observed in medial rostral (D) and caudal (E) areas restricted to gut terminal fields. In PBN (F), labeling restricted to dorsolateral gut terminal fields. G. Dopamine receptor antagonism DS abolished satiating effects of CCK; N=8, two-way RM-ANOVA main effects of antagonist F[1,7]=5.124, p=0.058; CCK F[1,7]=47.7, p<0.001; antagonist × CCK F[1,7]=13.3, p=0.006. Post-hoc t-tests: CCK + striatal aCSF vs. saline + striatal aCSF Bonferroni *p<0.001; CCK + striatal aCSF vs. CCK + striatal antagonist Bonferroni p>0.08. H. Left panel: Right, but not left, gut vagal deafferentation abolished satiating effects of CCK (group F[1,8]=8.7, *p<0.02; injection × group F[1,8]=19.6, *p=0.002). Right panel: Bilateral deafferentation produces similar effects to right deafferentation (two-way mixed ANOVA injection × group F[1,8]=18.4, *p=0.003). I. PBNdl→SNc lesions abolished the suppressive effects of CCK on food intake: N=5 in each group, main effects of CCK F[1,8]=33.1, p<0.001; lesion F[1,8]=0.89, p=0.37; CCK × lesion F[1,8]=11.0, *p=0.01. J-L. Right, but not left, gut vagal deafferentation abolished Fos expression induced by CCK in PBNdl (J, left, left deafferentation, right, right deafferentation) and NTS (K, left, left deafferentation, right, right deafferentation). Panel L quantifies Fos+ cells. N=5, One sample t-test, PBN: t[8]=6.183, Bonferroni *p<0.001; NTS: t[8]=8.202, Bonferroni *p<0.001. AP = area postrema; DMV = dorsal motor nucleus of the vagus; NTS = nucleus of the solitary tract; PBNdl = parabrachial nucleus, dorsolateral region; PBNel = parabrachial nucleus, externolateral part; PBNm = medial parabrachial nucleus. Data reported as mean±SEM.

Comment in

  • Rewarding gut feeling.
    Lewis S. Lewis S. Nat Rev Neurosci. 2018 Nov;19(11):639. doi: 10.1038/s41583-018-0075-3. Nat Rev Neurosci. 2018. PMID: 30291300 No abstract available.

References

    1. Altschuler SM, Bao XM, Bieger D, Hopkins DA, and Miselis RR (1989). Viscerotopic representation of the upper alimentary tract in the rat: sensory ganglia and nuclei of the solitary and spinal trigeminal tracts. J Comp Neur 283, 248–268. - PubMed
    1. Angyan L (1975). Vagal influences on hypothalamic self-stimulation in the cat. Life Sci 17, 289–292. - PubMed
    1. Banfield BW, Kaufman JD, Randall JA, and Pickard GE (2003). Development of pseudorabies virus strains expressing red fluorescent proteins: new tools for multisynaptic labeling applications. J Virol 77, 10106–10112. - PMC - PubMed
    1. Berthoud HR (2008). Vagal and hormonal gut-brain communication: from satiation to satisfaction. Neurogastroenterol Motil 20 Suppl 1, 64–72. - PMC - PubMed
    1. Betley JN, Xu S, Cao ZFH, Gong R, Magnus CJ, Yu Y, and Sternson SM (2015). Neurons for hunger and thirst transmit a negative-valence teaching signal. Nature 521, 180–185. - PMC - PubMed

Publication types