. 2018 Oct 9;11(4):929-943.
doi: 10.1016/j.stemcr.2018.08.016. Epub 2018 Sep 20.

Targeting the Extracellular Signal-Regulated Kinase 5 Pathway to Suppress Human Chronic Myeloid Leukemia Stem Cells

Affiliations

Targeting the Extracellular Signal-Regulated Kinase 5 Pathway to Suppress Human Chronic Myeloid Leukemia Stem Cells

Ignazia Tusa et al. Stem Cell Reports. .

Abstract

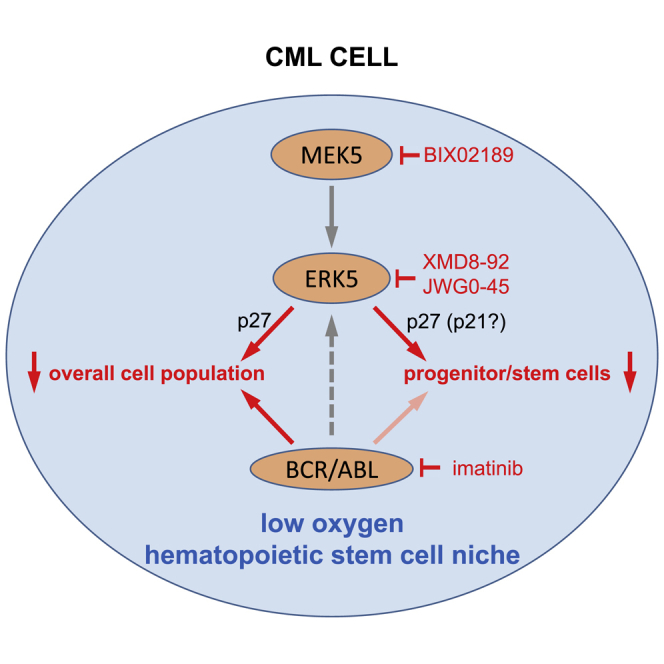
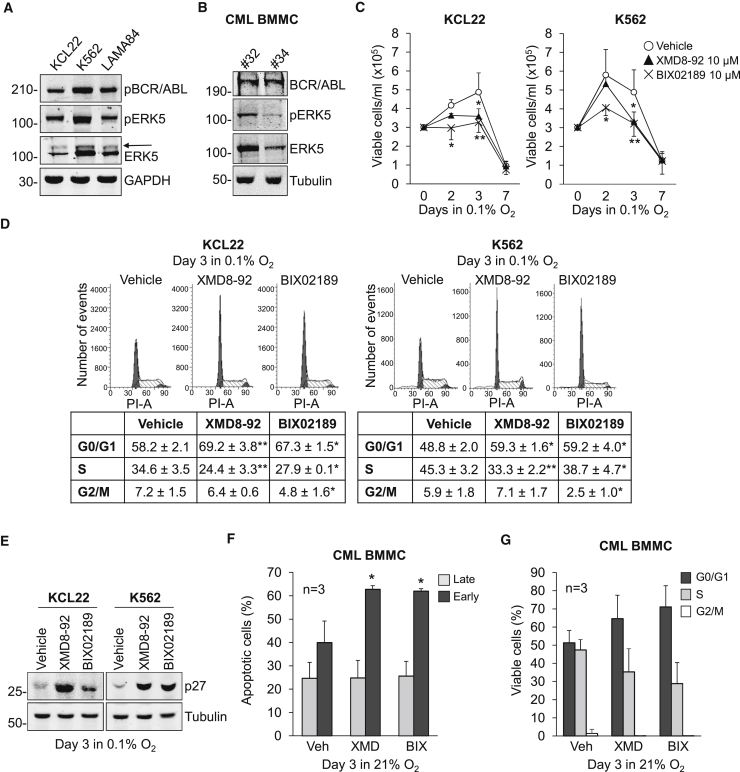
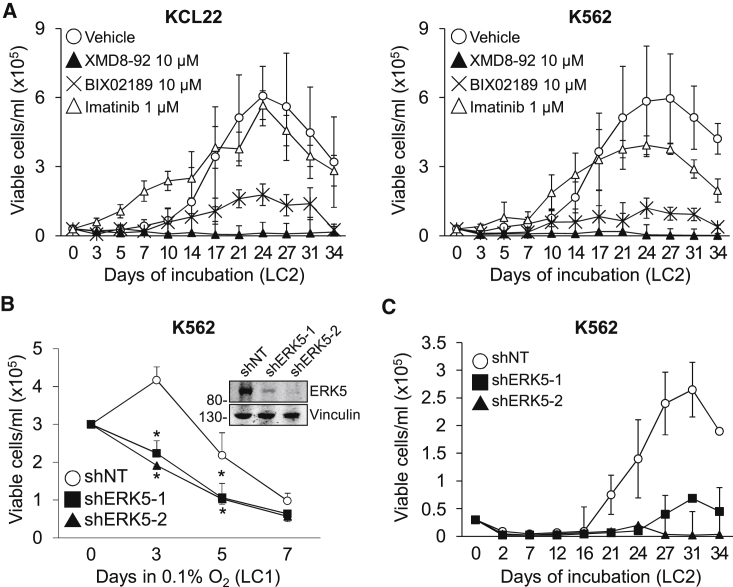
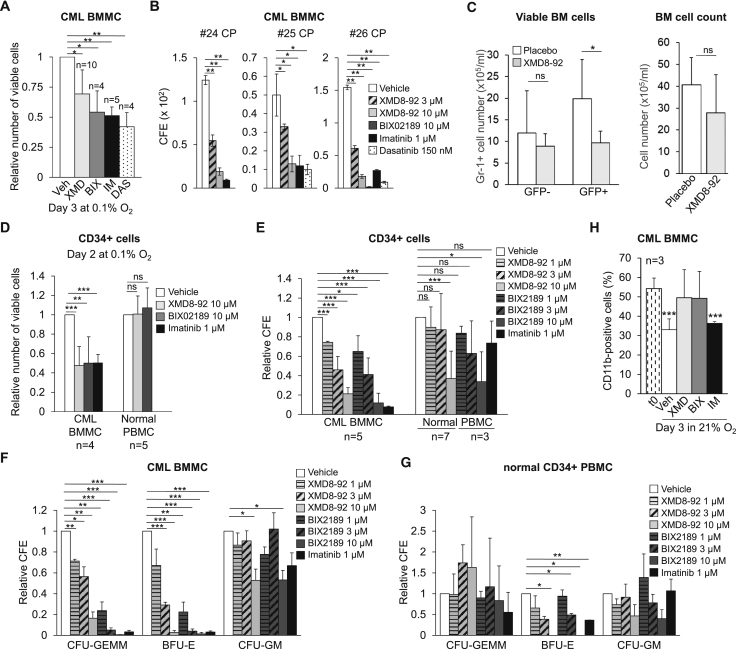
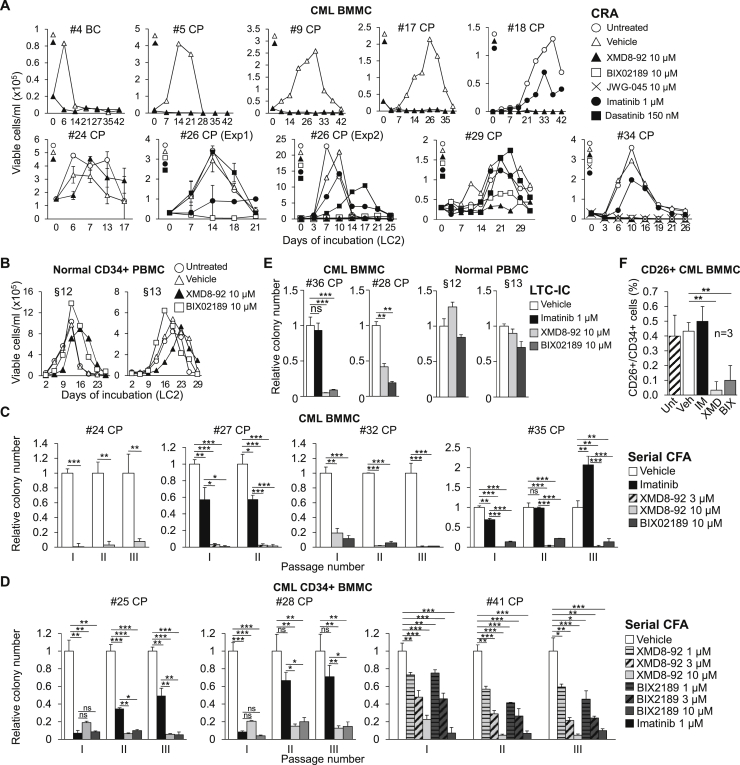
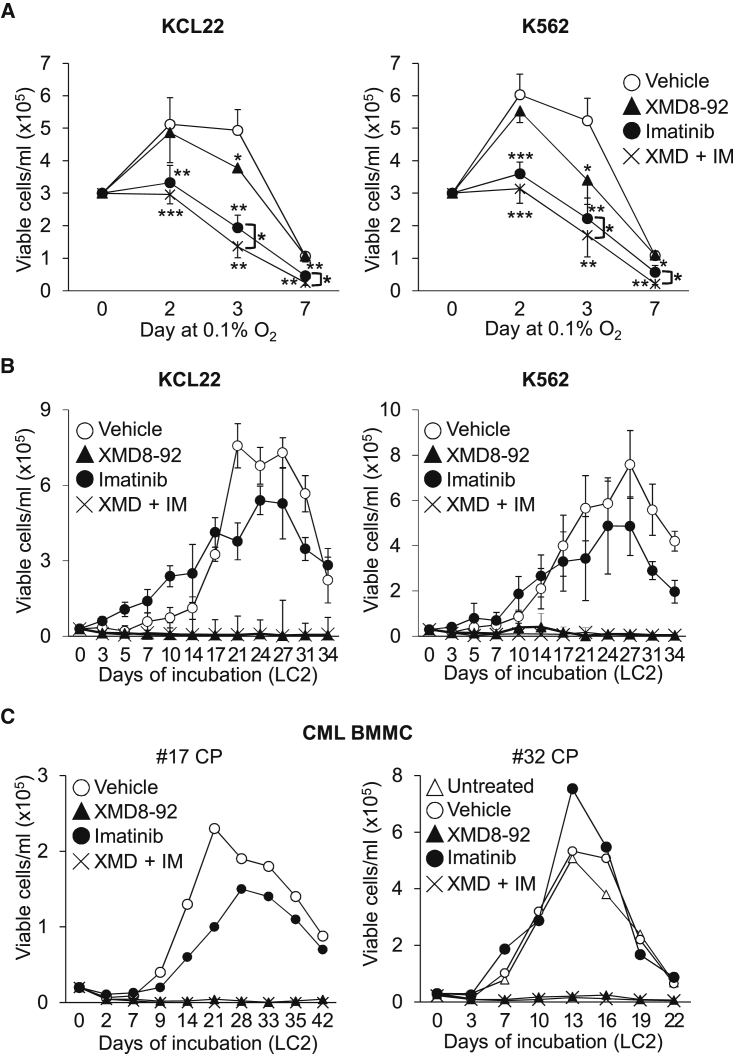
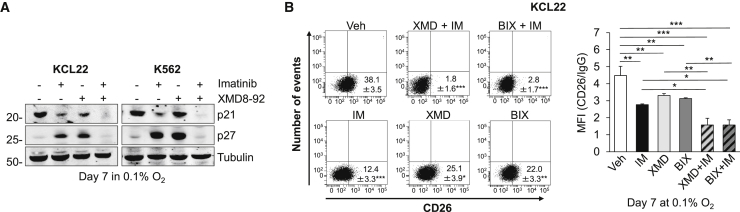
Tyrosine kinase inhibitors (TKi) are effective against chronic myeloid leukemia (CML), but their inefficacy on leukemia stem cells (LSCs) may lead to relapse. To identify new druggable targets alternative to BCR/ABL, we investigated the role of the MEK5/ERK5 pathway in LSC maintenance in low oxygen, a feature of bone marrow stem cell niches. We found that MEK5/ERK5 pathway inhibition reduced the growth of CML patient-derived cells and cell lines in vitro and the number of leukemic cells in vivo. Treatment in vitro of primary CML cells with MEK5/ERK5 inhibitors, but not TKi, strikingly reduced culture repopulation ability (CRA), serial colony formation ability, long-term culture-initiating cells (LTC-ICs), and CD26-expressing cells. Importantly, MEK5/ERK5 inhibition was effective on CML cells regardless of the presence or absence of imatinib, and did not reduce CRA or LTC-ICs of normal CD34+ cells. Thus, targeting MEK/ERK5 may represent an innovative therapeutic approach to suppress CML progenitor/stem cells.

Keywords: CML; ERK5/MAPK; MAP2K5; MAPK7; combination therapy; hypoxia; leukemia stem cells; microenvironment; stem cell niche; tyrosine kinase inhibitors/TKi.


Figures

None
Graphical abstract
Figure 1
Figure 1
ERK5 Expression and Effects of ERK5 Pathway Inhibition in CML Cells (A and B) ERK5 expression in human CML cell lines and primary cells. Immunoblotting of total cell lysates of routinely cultured (A) CML cell lines or (B) BMMCs from CML patients. (A) Slower-migrating phosphorylated form of ERK5 (arrow). GAPDH or tubulin are loading controls. Representative images from three (A) or two (B) independent experiments. (C–E) Effects of MEK5/ERK5 inhibitors on KCL22 and K562 cell number and cell-cycle phase distribution in low oxygen. Cells were incubated in 0.1% O2 and treated with DMSO (Vehicle) or the indicated inhibitors from time 0 to the indicated times. (C) Viable cell count; values are means ± SD of data from three independent experiments; p < 0.05; ∗∗p < 0.01 versus vehicle at the same time point. (D) Cell-cycle phase distribution; representative plots from three independent experiments, averaged (means ± SEM) in the table; p < 0.05, ∗∗p < 0.01 versus vehicle. (E) Immunoblotting of total cell lysates of CML cell lines; tubulin is a loading control; representative images from four independent experiments. (F and G) Effects of MEK5/ERK5 inhibitors on primary CML cells. Patient-derived cells were incubated in normoxia and treated with DMSO (Vehicle), 10 μM XMD8-92 (XMD), or 10 μM BIX02189 (BIX) from time 0 to day 3. (F) Data are means ± SD of the percentages of apoptotic cells (n = 3); p < 0.05 versus vehicle. (G) Data are means ± SD of data (n = 3) showing cell-cycle phase distribution. Differences between drug- and vehicle-treated samples were not statistically significant.
Figure 2
Figure 2
Effects of ERK5 Pathway Inhibition on the Progenitor Cell Potential of CML Cell Lines (A) Effects of MEK5/ERK5 inhibitors on CRA. Kinetics of repopulation of drug-free normoxic secondary cultures (LC2) established with KCL22 or K562 cells rescued from primary cultures (LC1) incubated in 0.1% O2 and treated for 7 days with DMSO (Vehicle) or the indicated inhibitors. Values are means ± SD of three independent experiments. Differences between drug- and vehicle-treated cultures were significant (p ≤ 0.01) from day 21 (KCL22) or day 17 (K562) on for BIX02189, and from day 14 (KCL22) or day 10 (K562) on for XMD8-92. (B and C) Effects of ERK5 genetic inhibition in K562 cells on cell number and CRA. (B) Cells transduced with (inset) non-targeting control (shNT) or two different ERK5-targeting shRNA (shERK5-1, shERK5-2) were incubated in 0.1% O2 and viable cells counted at the indicated times of LC1. p ≤ 0.05 versus shNT at the same time point. (C) LC2 repopulation by cells from day 7 LC1 shown in (B). Values are means ± SD of three independent experiments. Differences between shERK5-1 or shERK5-2 with respect to the shNT control were significant (p < 0.05) from day 24 on.
Figure 3
Figure 3
Effects of Pharmacological Inhibition of the ERK5 Pathway In Vivo and on Primary CML and Normal CD34+ Cells (A) Effects of MEK5/ERK5 inhibitors on the number of viable primary CML cells. CML BMMCs were incubated at 0.1% O2 and treated with DMSO (Vehicle) or the indicated inhibitors (XMD, XMD8-92; BIX, BIX02189; IM, imatinib; DAS, dasatinib) and viable cells counted at day 3. Values are means ± SD. See Figure S4A for single patient data. The number of patients for each group is indicated (vehicle group: n = 10). p ≤ 0.05; ∗∗p ≤ 0.01. (B) Effects of MEK5/ERK5 inhibitors on the CFA of primary CML cells. CML BMMCs were treated with DMSO (Vehicle) or inhibitors from time 0 and colonies scored after 7 days. Colony formation efficiency (CFE) values are means ± SD of data from single experiments performed in duplicate; p ≤ 0.05; ∗∗p ≤ 0.01. (C) Effects of XMD8-92 in vivo. CML mice (mice/group: n = 6) were treated twice daily with XMD8-92 (50 mg/kg) or placebo and euthanized after 1 additional day. Number of GFP+ (leukemic) or GFP− (non-leukemic) myeloid (Gr-1+) BM cells; data are means ± SD (left graph). Total number of viable BM cells; data are means ± SD (right graph). p < 0.05; ns, not significant. (D) Effects of MEK5/ERK5 inhibitors on the number of viable primary CML and normal CD34+ cells. CD34+-enriched CML BMMCs or healthy donor PBMCs were treated with DMSO (Vehicle) or inhibitors at the indicated concentrations and incubated in 0.1% O2 and viable cells counted at day 2. Values are means ± SD of data normalized for the respective vehicle-treated control. The number of patients/healthy donors is indicated; ∗∗p ≤ 0.01; ∗∗∗p ≤ 0.001; ns, not significant. (E) Effects of MEK5/ERK5 inhibitors on CFA of primary CML or normal CD34+ cells. CD34+-enriched CML BMMCs or healthy donor PBMCs were treated with DMSO (Vehicle) or inhibitors at the indicated concentrations from time 0 and colonies scored after 7 days. CFE values are means ± SD of data normalized for the respective vehicle-treated control. The number of patients/healthy donors is indicated (see Figures S4C and S4D for data of single experiments); p ≤ 0.05; ∗∗∗p ≤ 0.001; ns, not significant. (F and G) Effects of MEK5/ERK5 inhibitors on the differentiation potential of primary CML or normal CD34+ cells. In the same experiments shown in (E), differential CFA was scored for primary CML (F) or normal (G) CD34+ cells. CFE values are means ± SEM of data normalized for the respective vehicle-treated control. p ≤ 0.05; ∗∗p ≤ 0.01; ∗∗∗p ≤ 0.001; to reduce figure cluttering, non-significant differences are not indicated. (H) Effects of MEK5/ERK5 inhibitors on primary CD11b+ CML cells. Patient-derived cells were incubated in normoxia and treated with DMSO (Vehicle), 10 μM XMD8-92 (XMD), 10 μM BIX02189 (BIX), or 1 μM imatinib (IM) from time 0 to day 3. The percentages of CD11b-expressing cells were measured by flow cytometry. Data are means ± SD of data from three patients; ∗∗∗p < 0.001 versus time 0 (t0).
Figure 4
Figure 4
Effects of Pharmacological Inhibition of the ERK5 Pathway on the Stem Cell Potential of Primary CML Cells (A and B) Effects of MEK5/ERK5 inhibitors on CRA of primary CML and normal CD34+ cells. Kinetics of repopulation of drug-free normoxic LC2 established with CML BMMCs (A) or normal CD34+ PBMCs (B) that had been previously incubated in 0.1% O2 for 7 days in LC1 while left untreated or treated with DMSO (Vehicle) or the indicated inhibitors. Data represent results from single experiments (no. 24; no. 26, Exp1: means ± SD from triplicates). BC, blast crisis; CP, chronic phase. (C and D) Effects of MEK5/ERK5 inhibitors on serial CFA of primary CML cells. Total (C) or CD34+ (D) BMMCs from CML patients were treated with DMSO (Vehicle) or the indicated inhibitors from time 0 of incubation in passage I culture. Cells were washed to remove drugs and replated weekly (II–III) and colonies scored on day 7 after each passage. Values are means ± SD of data, normalized for the respective vehicle-treated control, from single experiments performed in duplicate; p ≤ 0.05; ∗∗p ≤ 0.01; ∗∗∗p ≤ 0.001; ns, not significant; CP, chronic phase. (E) Effects of MEK5/ERK5 inhibitors on primary CML and normal LTC-ICs. CML BMMCs or normal PBMCs were incubated in 0.1% O2 for 48 hr in LC1 treated with DMSO (Vehicle) or the indicated inhibitors and transferred to drug-free normoxic LC2. After 5 weeks, LC2 cells were replated and colony number was scored after 14 days. Values are means ± SD of data from one experiment performed in duplicate and are expressed as a fraction of the value obtained for vehicle-treated culture. ∗∗p ≤ 0.01; ∗∗∗p ≤ 0.001; ns, not significant; CP, chronic phase. (F) Effects of MEK5/ERK5 inhibitors on CD26+ CML BMMCs. Cells were incubated in normoxia for 3 days and left untreated or treated with DMSO (Vehicle), 1 μM imatinib (IM), 10 μM XMD8-92 (XMD), or 10 μM BIX02189 (BIX) from time 0. The percentages of CD26+/CD34+-expressing cells were determined by flow cytometry. Data are means ± SD of data from three patients; ∗∗p ≤ 0.01 versus vehicle.
Figure 5
Figure 5
Effects of the XMD8-92/Imatinib Combination on CML Cell Lines and Primary Cells (A) Effects of XMD8-92/imatinib combination on the number of viable CML cells. KCL22 or K562 cells were incubated in 0.1% O2 and treated with DMSO (Vehicle), XMD8-92 (10 μM), imatinib (1 μM), or their combination (XMD + IM) from time 0 and viable cells counted at the indicated times. Values are means ± SD of data from three independent experiments; p < 0.05; ∗∗p < 0.01; ∗∗∗p < 0.001. (B and C) Effects of XMD8-92 alone or in combination with imatinib on CRA of CML cells. Repopulation of drug-free normoxic LC2 by KCL22 or K562 (B) or patient-derived (C) CML cells that had been previously incubated in 0.1% O2 for 7 days in LC1 treated as in (A). Values are means ± SD of data from three independent experiments (B) or from single experiments (C). CP, chronic phase. (B) Differences between XMD8-92- or imatinib/XMD8-92-treated cultures were significant (p ≤ 0.05) from day 5 (versus vehicle-treated) or day 7 (versus imatinib-treated) on (KCL22). Differences between XMD8-92 or imatinib/XMD8-92 with respect to vehicle- or imatinib-treated cultures were significant (p ≤ 0.05) from day 14 on (K562).
Figure 6
Figure 6
Effects of the Combination of MEK5/ERK5 Inhibitors with Imatinib on the Expression of Stem Cell-Related Proteins (A) Cells were incubated in 0.1% O2 and treated with DMSO, 1 μM imatinib, 10 μM XMD8-92 (XMD), or their combination from time 0 to day 7. Cells were then lysed and immunoblotting performed; tubulin is a loading control; representative images from three independent experiments. (B) KCL22 cells were incubated in 0.1% O2 and treated with DMSO (Vehicle), 10 μM XMD8-92 (XMD), 10 μM BIX02189 (BIX), 1 μM imatinib (IM), or their combination (XMD + IM; BIX + IM) for 7 days. Percentages of CD26+ cells were measured by flow cytometry. Dot plots from one representative experiment including means ± SD (left) and histograms relative to CD26 mean fluorescence intensity values from three independent experiments (mean ± SD, right) are shown; p < 0.05; ∗∗p < 0.01; ∗∗∗p < 0.001.

Similar articles

Cited by

References

    1. Blom T., Nilsson G., Sundström C., Nilsson K., Hellman L. Characterization of a human basophil-like cell line (LAMA-84) Scand. J. Immunol. 1996;44:54–61. - PubMed
    1. Buschbeck M., Hofbauer S., Di Croce L., Keri G., Ullrich A. Abl-kinase-sensitive levels of ERK5 and its intrinsic basal activity contribute to leukaemia cell survival. EMBO Rep. 2005;6:63–69. - PMC - PubMed
    1. Carvajal-Vergara X., Tabera S., Montero J.C., Esparís-Ogando A., López-Pérez R., Mateo G., Gutiérrez N., Parmo-Cabañas M., Teixidó J., San Miguel J.F. Multifunctional role of Erk5 in multiple myeloma. Blood. 2005;105:4492–4499. - PubMed
    1. Cassuto O., Dufies M., Jacquel A., Robert G., Ginet C., Dubois A., Hamouda A., Puissant A., Luciano F., Karsenti J.M. All tyrosine kinase inhibitor-resistant chronic myelogenous cells are highly sensitive to ponatinib. Oncotarget. 2012;3:1557–1565. - PMC - PubMed
    1. Cheloni G., Tanturli M., Tusa I., Ho DeSouza N., Shan Y., Gozzini A., Mazurier F., Rovida E., Li S., Dello Sbarba P. Targeting chronic myeloid leukemia stem cells with the hypoxia-inducible factor inhibitor acriflavine. Blood. 2017;130:655–665. - PMC - PubMed

Publication types

MeSH terms