

Assessing threats of non-native species to native freshwater biodiversity: Conservation priorities for the United States
- PMID: 30245526
- PMCID: PMC6145479
- DOI: 10.1016/j.biocon.2018.05.019
Assessing threats of non-native species to native freshwater biodiversity: Conservation priorities for the United States
Abstract
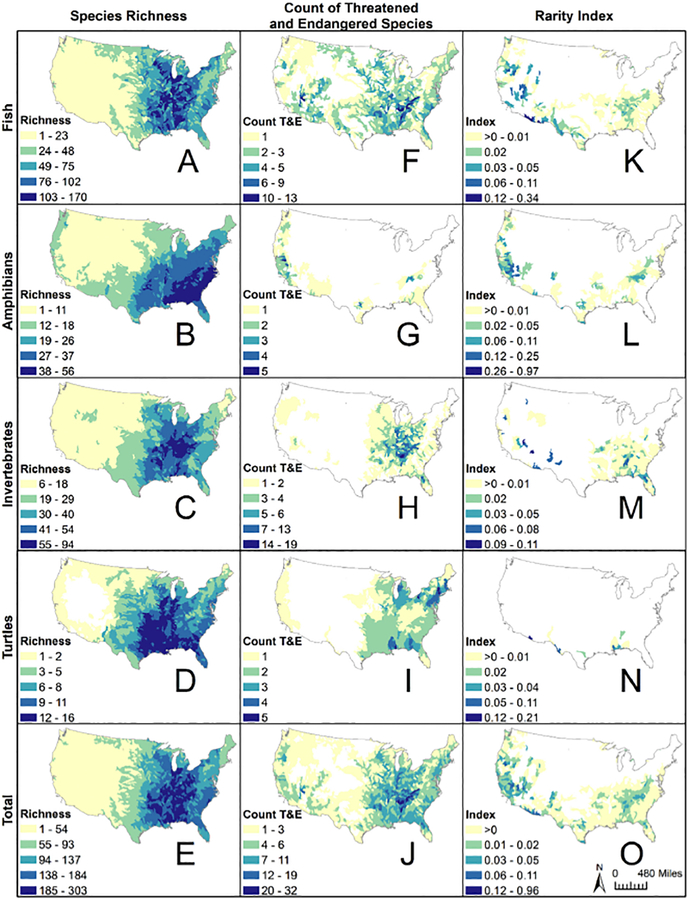
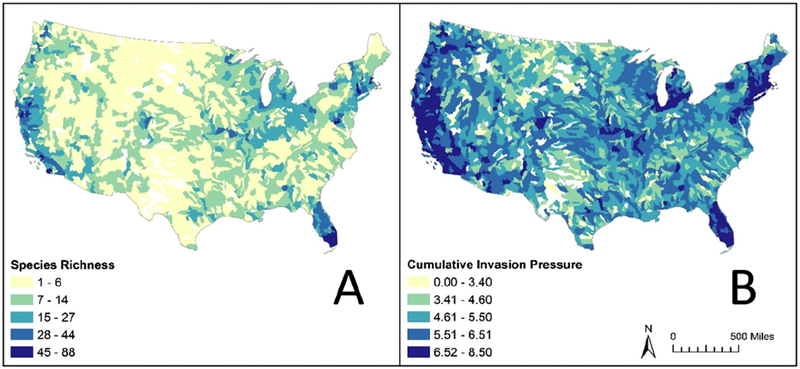
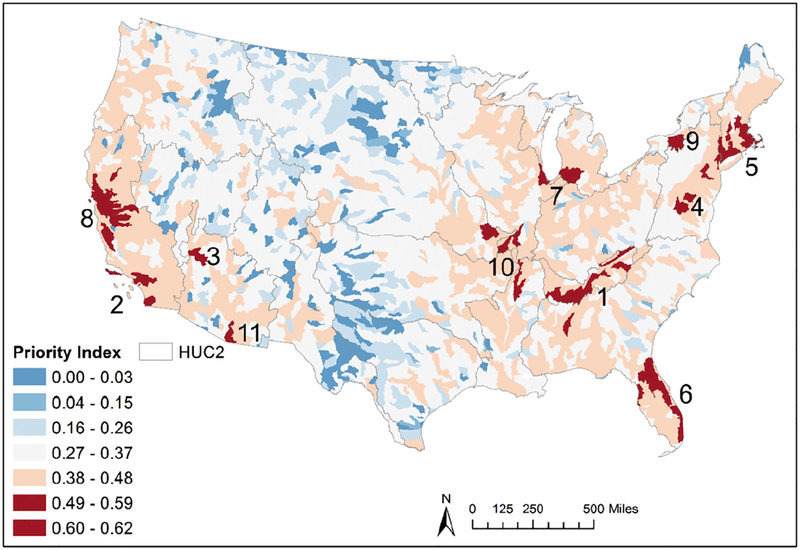
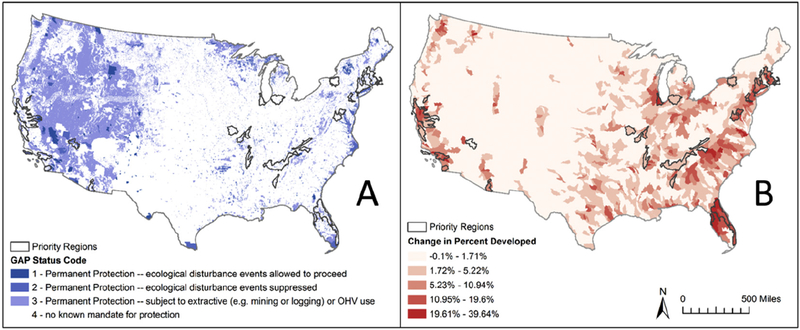
Non-native species pose one of the greatest threats to native biodiversity, and can have severe negative impacts in freshwater ecosystems. Identifying regions of spatial overlap between high freshwater biodiversity and high invasion pressure may thus better inform the prioritization of freshwater conservation efforts. We employ geospatial analysis of species distribution data to investigate the potential threat of non-native species to aquatic animal taxa across the continental United States. We mapped non-native aquatic plant and animal species richness and cumulative invasion pressure to estimate overall negative impact associated with species introductions. These distributions were compared to distributions of native aquatic animal taxa derived from the International Union for the Conservation of Nature (IUCN) database. To identify hotspots of native biodiversity we mapped total species richness, number of threatened and endangered species, and a community index of species rarity calculated at the watershed scale. An overall priority index allowed identification of watersheds experiencing high pressure from non-native species and also exhibiting high native biodiversity conservation value. While priority regions are roughly consistent with previously reported prioritization maps for the US, we also recognize novel priority areas characterized by moderate-to-high native diversity but extremely high invasion pressure. We further compared priority areas with existing conservation protections as well as projected future threats associated with land use change. Our findings suggest that many regions of elevated freshwater biodiversity value are compromised by high invasion pressure, and are poorly safeguarded by existing conservation mechanisms and are likely to experience significant additional stresses in the future.
Keywords: Freshwater biodiversity; Invasive species; Non-native species; Priority mapping; Threatened and endangered species.
Figures
Similar articles
-
Threats from urban expansion, agricultural transformation and forest loss on global conservation priority areas.PLoS One. 2017 Nov 28;12(11):e0188397. doi: 10.1371/journal.pone.0188397. eCollection 2017. PLoS One. 2017. PMID: 29182662 Free PMC article.
-
Prioritizing conservation in sub-Saharan African lakes based on freshwater biodiversity and algal bloom metrics.Conserv Biol. 2022 Oct;36(5):e13914. doi: 10.1111/cobi.13914. Epub 2022 May 26. Conserv Biol. 2022. PMID: 35435285 Free PMC article.
-
Major threats to European freshwater fish species.Sci Total Environ. 2021 Nov 25;797:149105. doi: 10.1016/j.scitotenv.2021.149105. Epub 2021 Jul 17. Sci Total Environ. 2021. PMID: 34303251
-
Freshwater biodiversity: importance, threats, status and conservation challenges.Biol Rev Camb Philos Soc. 2006 May;81(2):163-82. doi: 10.1017/S1464793105006950. Epub 2005 Dec 12. Biol Rev Camb Philos Soc. 2006. PMID: 16336747 Review.
-
Bending the curve of global freshwater biodiversity loss: what are the prospects?Biol Rev Camb Philos Soc. 2025 Feb;100(1):205-226. doi: 10.1111/brv.13137. Epub 2024 Sep 2. Biol Rev Camb Philos Soc. 2025. PMID: 39221642 Free PMC article. Review.
Cited by
-
Effect of freshwater on plant species diversity and interspecific associations in coastal wetlands invaded by Spartina alterniflora.Front Plant Sci. 2022 Sep 21;13:965426. doi: 10.3389/fpls.2022.965426. eCollection 2022. Front Plant Sci. 2022. PMID: 36212281 Free PMC article.
-
A Framework for Aquatic Invasive Species Surveillance Site Selection and Prioritization in the US waters of the Laurentian Great Lakes.Manag Biol Invasion. 2020 Jul 23;11(3):607-632. doi: 10.3391/mbi.2020.11.3.17. Manag Biol Invasion. 2020. PMID: 36072892 Free PMC article.
-
Non-native Asian swamp eel, Monopterus albus/javanensis (Zuiew, 1973/Lacepede, 1800), responses to low temperatures.Fish Physiol Biochem. 2021 Apr;47(2):465-476. doi: 10.1007/s10695-021-00925-w. Epub 2021 Jan 29. Fish Physiol Biochem. 2021. PMID: 33515113
-
Hydrocharis laevigata in Europe.Plants (Basel). 2023 Feb 4;12(4):701. doi: 10.3390/plants12040701. Plants (Basel). 2023. PMID: 36840049 Free PMC article.
-
Trends in nonindigenous aquatic species richness in the United States reveal shifting spatial and temporal patterns of species introductions.Aquat Invasions. 2018 Sep 1;13(3):323-338. doi: 10.3391/ai.2018.13.3.02. Aquat Invasions. 2018. PMID: 31447950 Free PMC article.
References
-
- Abell R, Allan J, Lehner B, 2007. Unlocking the potential of protected areas for freshwaters. Biol. Conserv 134, 48–63.
-
- Abell R, Thieme M, Ricketts TH, Olwero N, Ng R, Petry P, Dinerstein E, Revenga C, Hoekstra J, 2011. Concordance of freshwater and terrestrial biodiversity. Conserv. Lett 4, 127–136.
Grants and funding
LinkOut - more resources
Full Text Sources
Other Literature Sources