. 2018 Sep 7:12:201.
doi: 10.3389/fnbeh.2018.00201. eCollection 2018.

MouBeAT: A New and Open Toolbox for Guided Analysis of Behavioral Tests in Mice

Affiliations

MouBeAT: A New and Open Toolbox for Guided Analysis of Behavioral Tests in Mice

Elísabet Bello-Arroyo et al. Front Behav Neurosci. .

Abstract

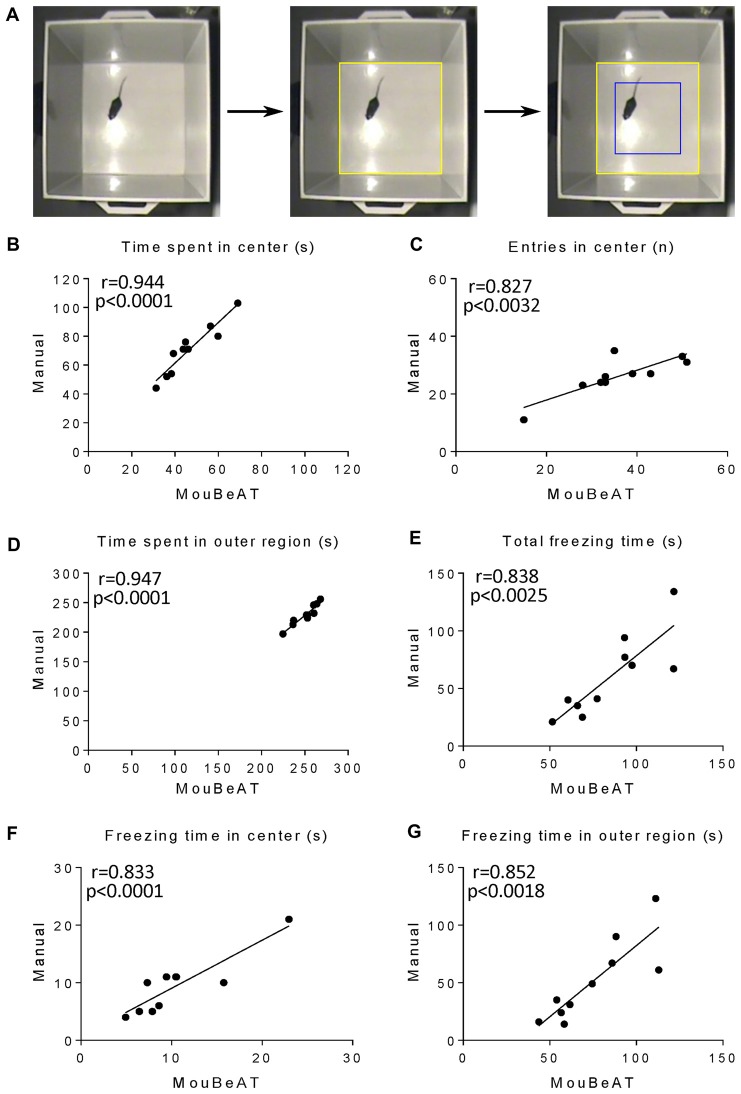
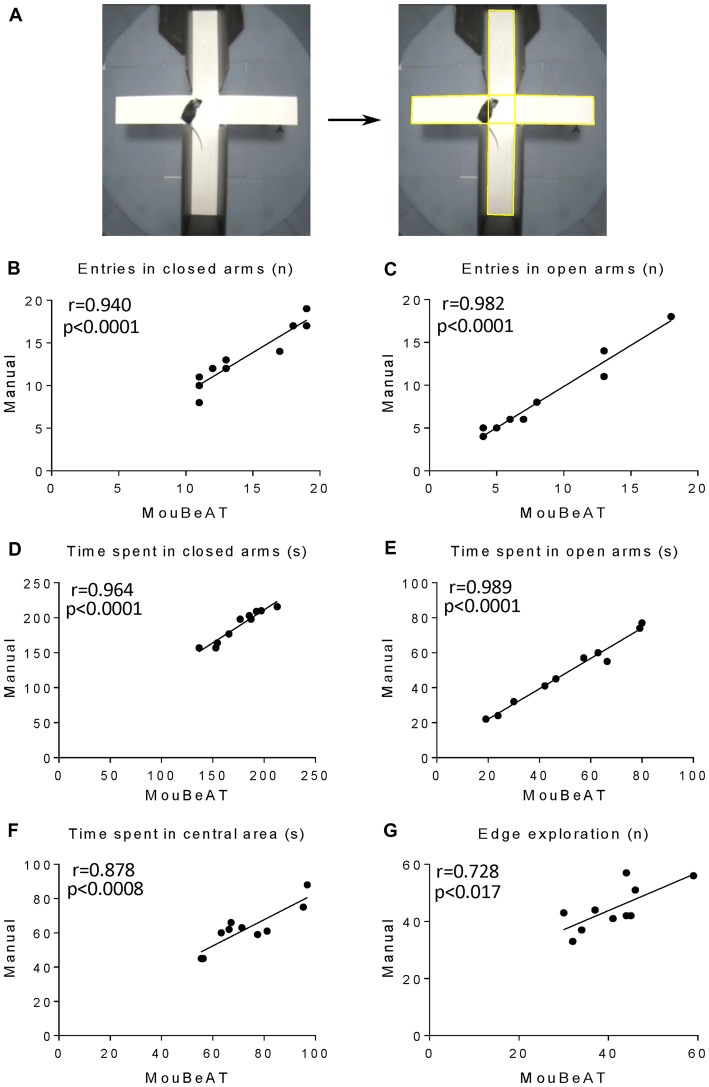
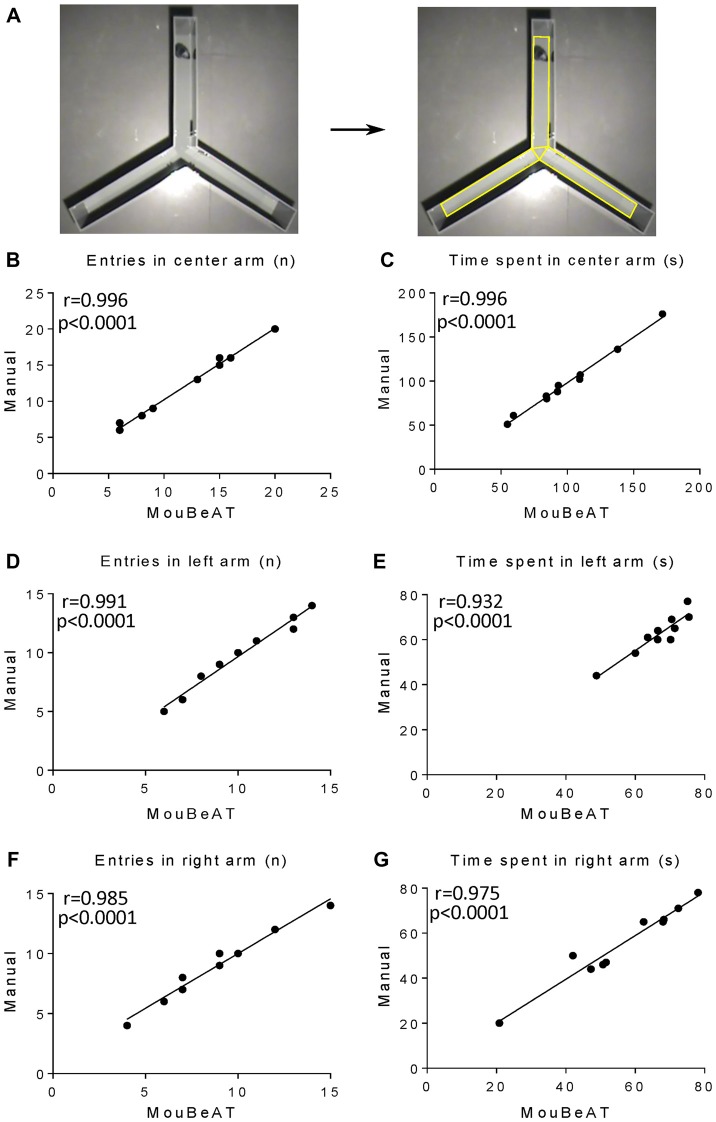
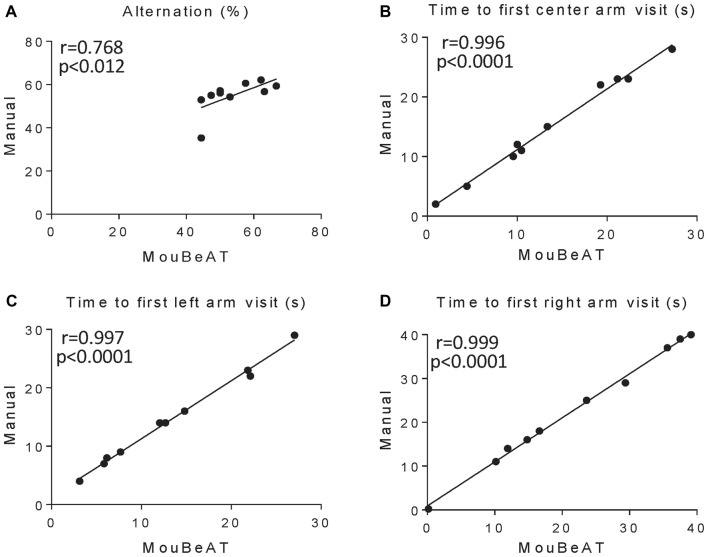
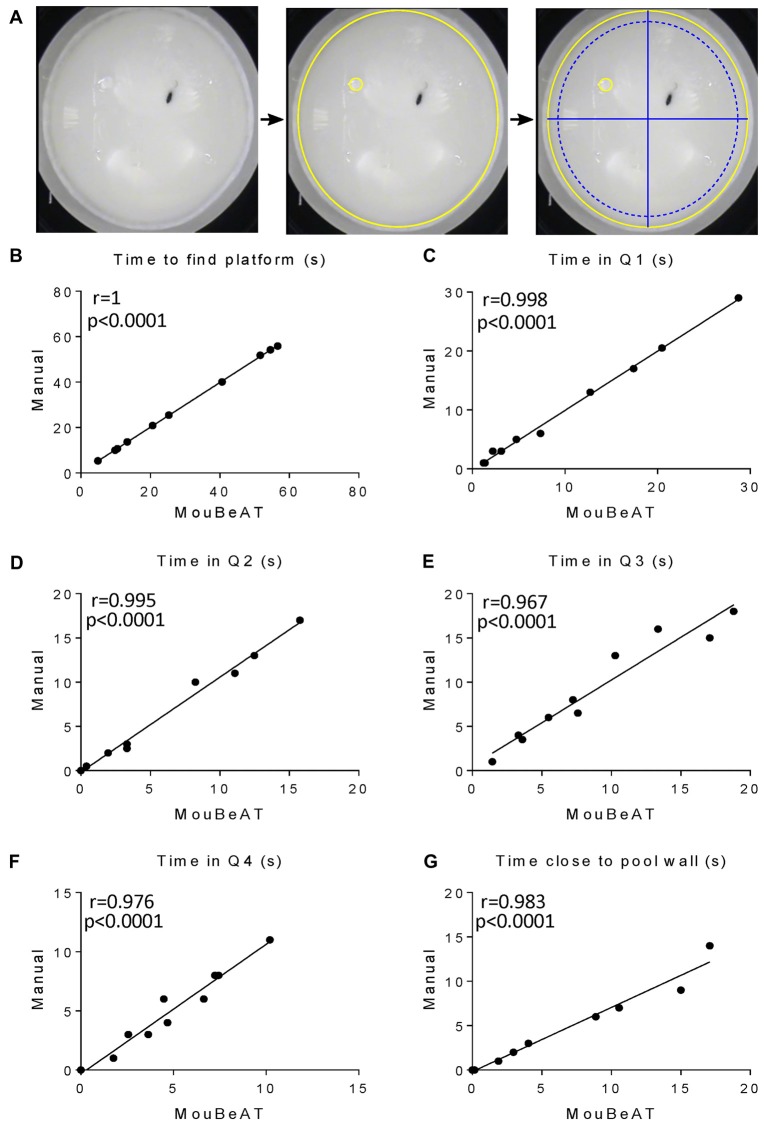
Animal behavioral tests are essential to understand the bases of neurologic and psychological disorders, which can be evaluated by different methodological and experimental models. However, the quantification of behavioral tests results is limited by the considerable amount of time needed for manual evaluation and the high costs of automated analysis software. To overcome these limitations, we describe here a new, open source toolbox for ImageJ, called Mouse Behavioral Analysis Toolbox (MouBeAT), designed to analyze different behavioral tests in rodents semi-automatically. These tests include Open Field (OF), Elevated Plus Maze (EPM), Y-maze (YM) test and Morris Water Maze (MWM). MouBeAT showed a high correlation with manual evaluation in all the parameters analyzed for all the behavioral tests, reinforcing its value as an accurate analysis tool. This new tool is freely available online.

Keywords: ImageJ; behavioral tests; open source; rodents; semi-automated analysis.


Figures

Figure 1
Figure 1
Workflow of Mouse Behavioral Analysis Toolbox (MouBeAT) analysis. (A) Onetime steps of installation and adjustment of general preferences. (B) Main steps for specific tests. Gray filled boxes indicate mandatory steps while empty boxes indicate optional steps. Yellow region of interest (ROI) represent areas created by the user to defined regions of the maze during the workflow in this and all subsequent figures.
Figure 2
Figure 2
Correlation of the measured variables in the open field (OF) test between MouBeAT and manual assessment. The OF test (A) was performed using 10 C57BL/6J male mice. Yellow ROI defines the base of the cube while blue ROI indicates the center region calculated by the software. Each dot represents time spent in the center (B), number of entries into the center (C), time spent in outer region (D), total freezing time (E), freezing time in the center (F) and freezing time in the outer region (G) for each mouse. In this and all subsequent Figures Pearson’s correlation coefficients were calculated for all variable except in cases where data followed a non-parametric distribution, in which case the Spearman correlation coefficient was used. Individual p values are displayed in the Figures. For (F) the Spearman correlation coefficient was used.
Figure 3
Figure 3
Correlation of results for the Elevated Plus Maze (EPM) obtained by MouBeAT and manual observation.The EPM test (A) was performed on 10 C57BL/6J male mice. Yellow ROIs defines the central region and edges of the maze. Each dot represents the number of entries in closed (B) and open (C) arms, time spent in closed (D) and open (E) arms, time spent in central area (F) and times of over the edge exploration (G) for each mouse.
Figure 4
Figure 4
Correlation between the results obtained with MouBeAT and those from manual assessment for the measured variables in the Y-maze (YM) test. The YM test (A) was performed using 10 C57BL/6J male mice. Yellow ROI defines the edges and central triangle of the maze. Each dot represents the number of entries into the center (B), left (D) and right arms (F), and the time spent in the center (C), left (E) and right (G) arms for each mouse.
Figure 5
Figure 5
Correlation of arm alternation and time to visit each arm in the YM test between MouBeAT and manual observation. The YM test was performed using 10 C57BL/6J male mice. Each dot represents the percentage of alternation between arms (A), and the time it took each mouse to visit the center (B), left (C) and right (D) arms for the first time. For (A) the Spearman correlation coefficient was used.
Figure 6
Figure 6
Correlation between MouBeAT and manual assessment of different parameters in the Morris Water Maze (MWM) test. The MWM test (A) was performed on 10 C57BL/6J male mice. Yellow ROI defines the edges and the platform regions, while blue ROIs define the quadrants and the region close to the pool wall, calculated by the software. Each dot represents the time needed by the mouse to find the platform (B), time in quadrants 1–4 (C–F) and the time spent close to the pool wall (G) for each mouse.

References

    1. An X.-L., Zou J.-X., Wu R.-Y., Yang Y., Tai F.-D., Zeng S.-Y., et al. . (2011). Strain and sex differences in anxiety-like and social behaviors in C57BL/6J and BALB/cJ mice. Exp. Anim. 60, 111–123. 10.1538/expanim.60.111 - DOI - PubMed
    1. Aragão R. S., Rodrigues M. A., de Barros K. M., Silva S. R., Toscano A. E., de Souza R. E., et al. . (2011). Automatic system for analysis of locomotor activity in rodents-A reproducibility study. J. Neurosci. Methods 195, 216–221. 10.1016/j.jneumeth.2010.12.016 - DOI - PubMed
    1. Ben-Shaul Y. (2017). Optimouse: a comprehensive open source program for reliable detection and analysis of mouse body and nose positions. BMC Biol. 15:41. 10.1186/s12915-017-0377-3 - DOI - PMC - PubMed
    1. Bromley-Brits K., Deng Y., Song W. (2011). Morris water maze test for learning and memory deficits in Alzheimer’s disease model mice. J. Vis. Exp. 53:2920. 10.3791/2920 - DOI - PMC - PubMed
    1. Chan-Palay V., Záborszky L., Köhler C., Goldstein M., Palay S. L. (1984). Distribution of tyrosine-hydroxylase-immunoreactive neurons in the hypothalamus of rats. J. Comp. Neurol. 227, 467–496. 10.1002/cne.902270403 - DOI - PubMed