

Expression of Na+/K+-ATPase Was Affected by Salinity Change in Pacific abalone Haliotis discus hannai
- PMID: 30245637
- PMCID: PMC6137147
- DOI: 10.3389/fphys.2018.01244
Expression of Na+/K+-ATPase Was Affected by Salinity Change in Pacific abalone Haliotis discus hannai
Abstract
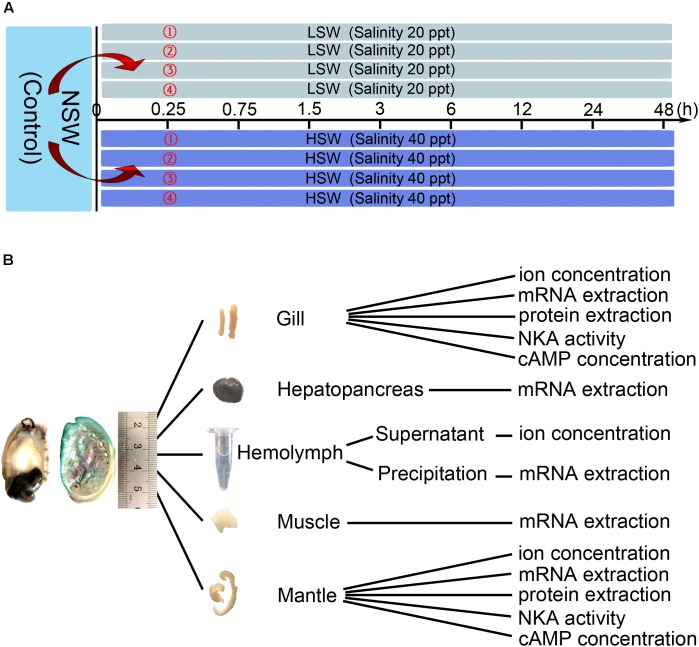
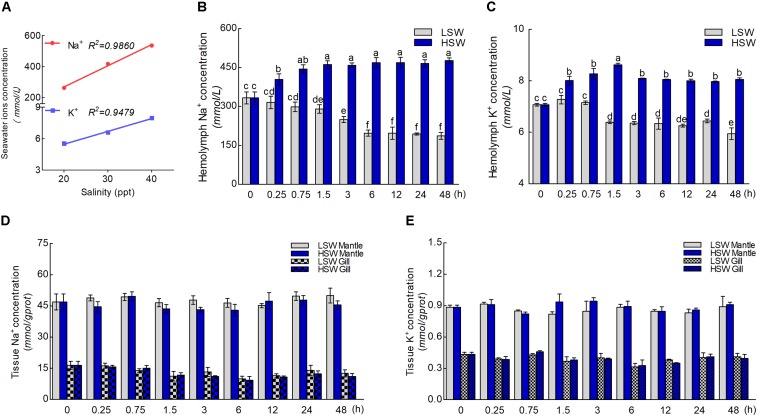
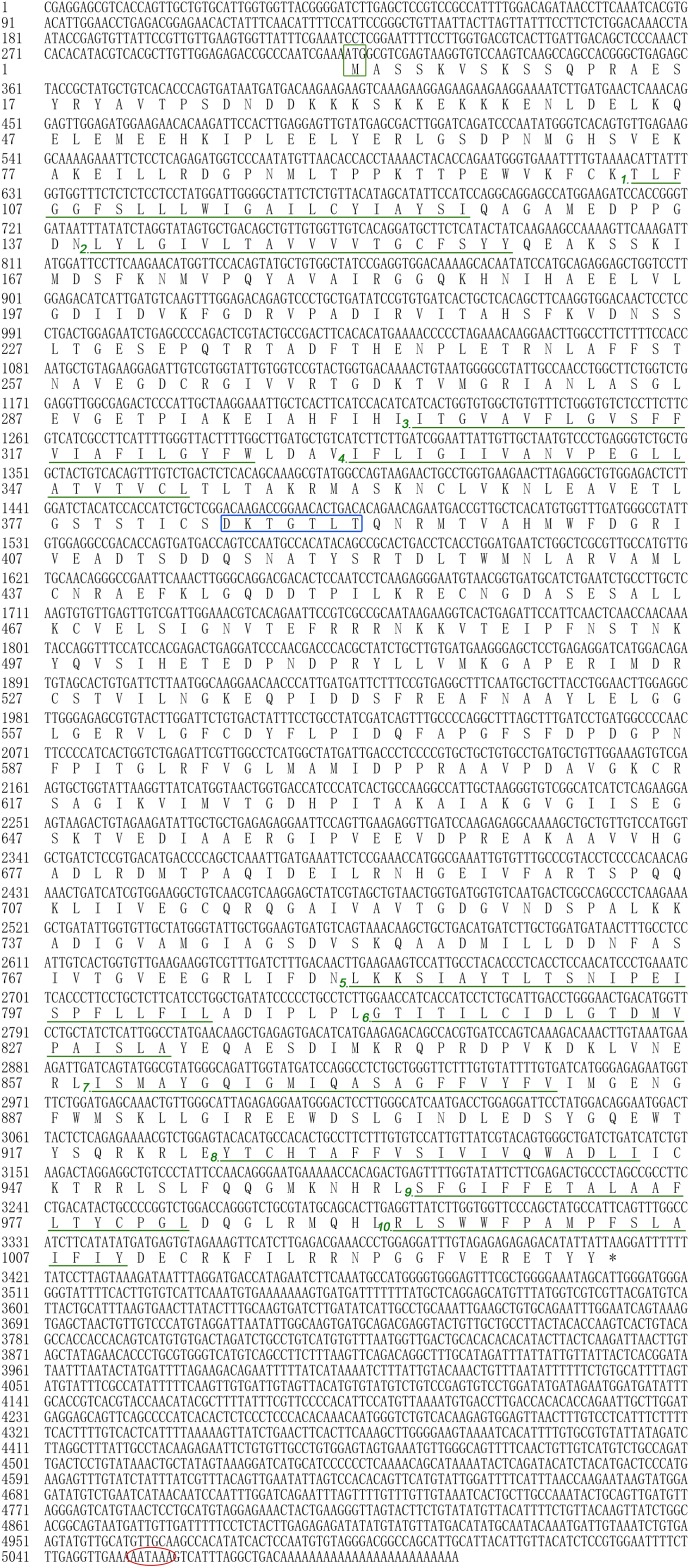
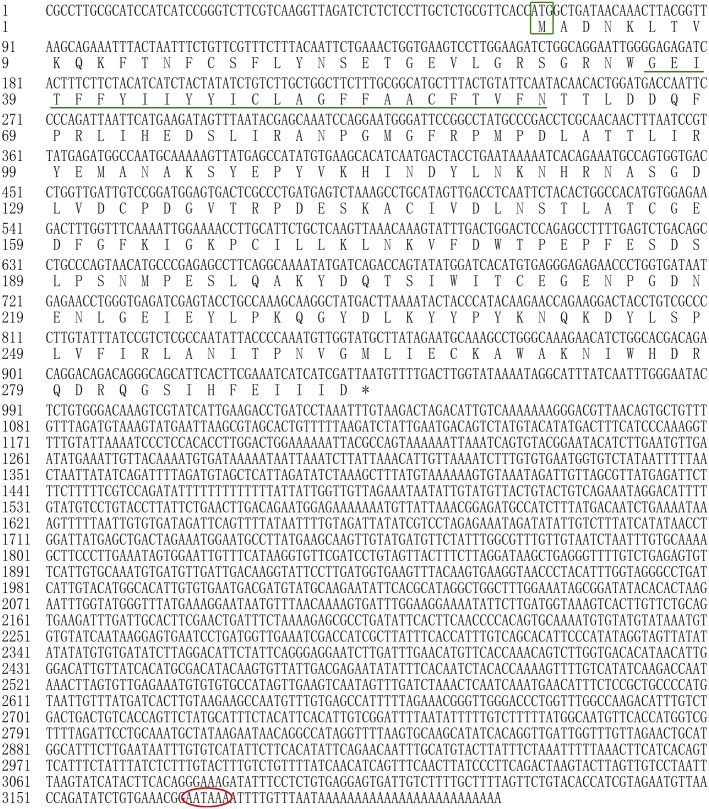
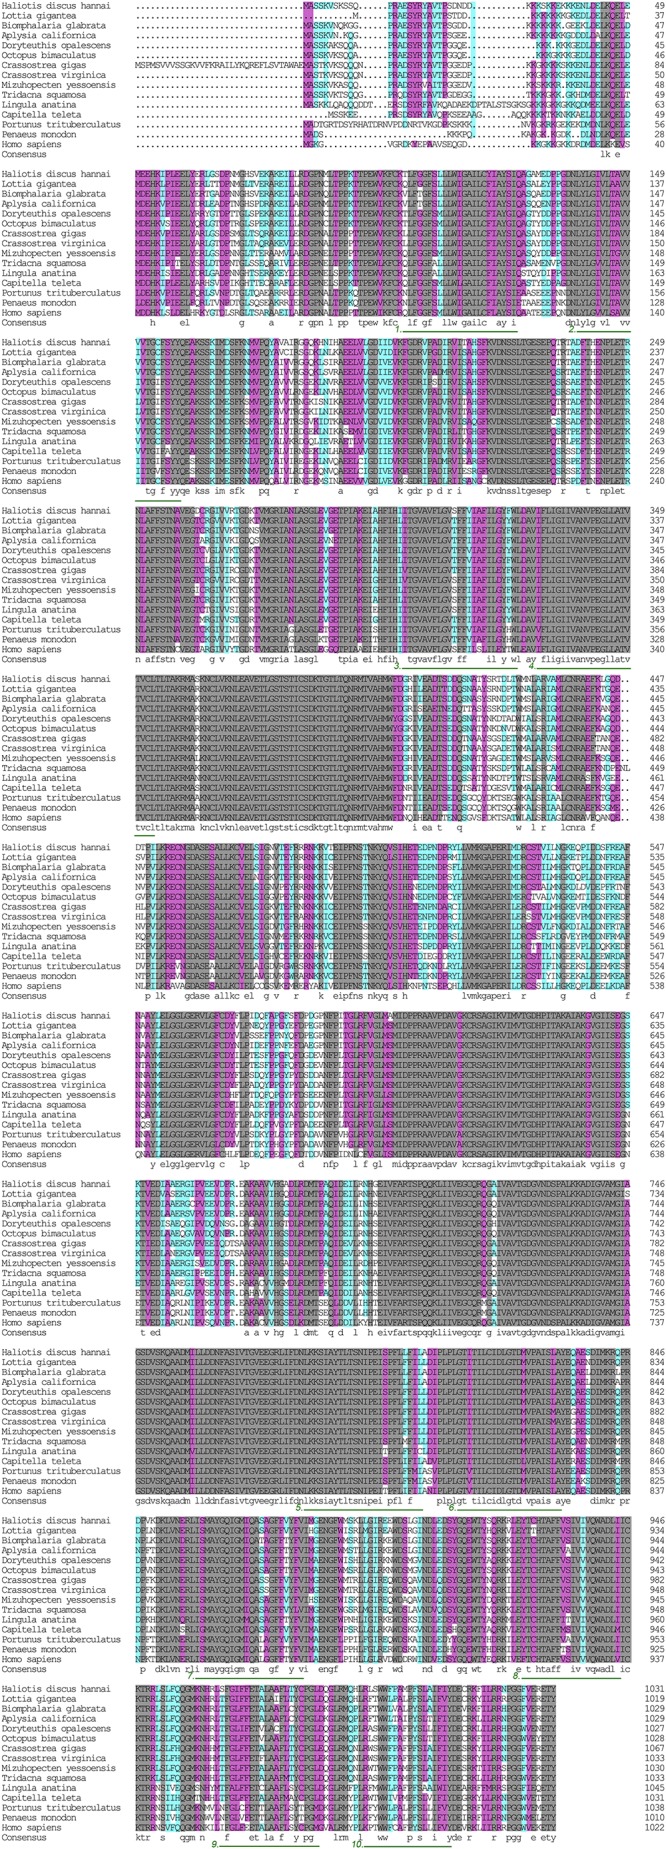
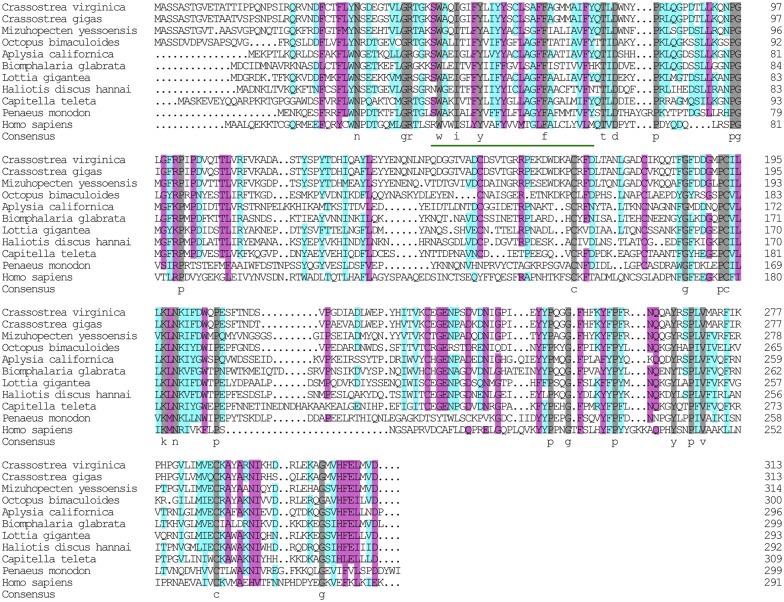
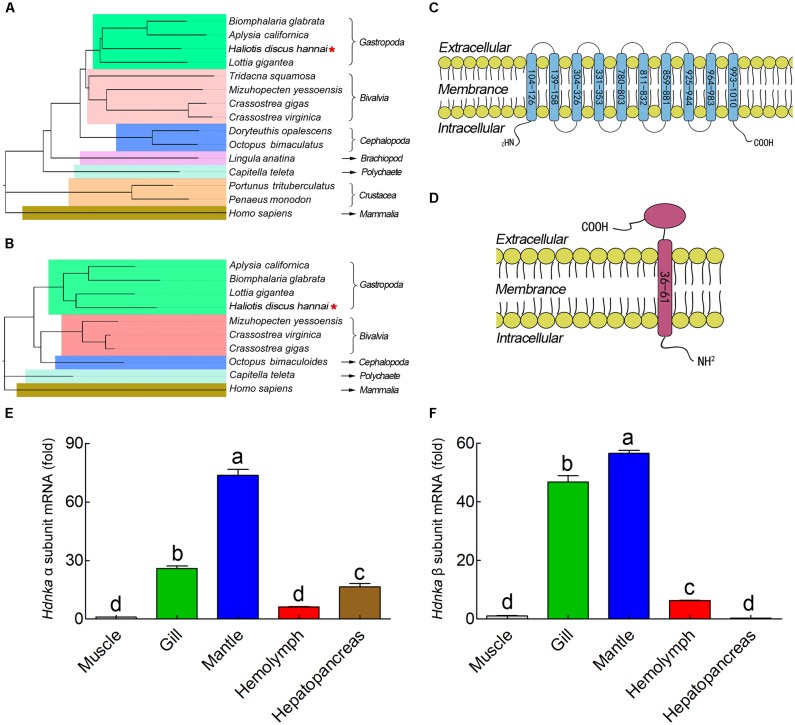
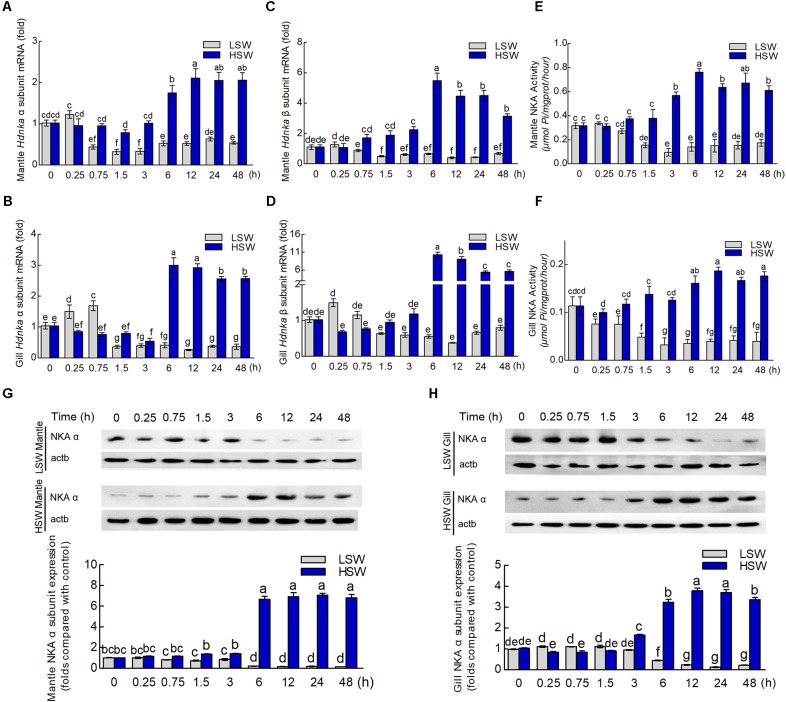
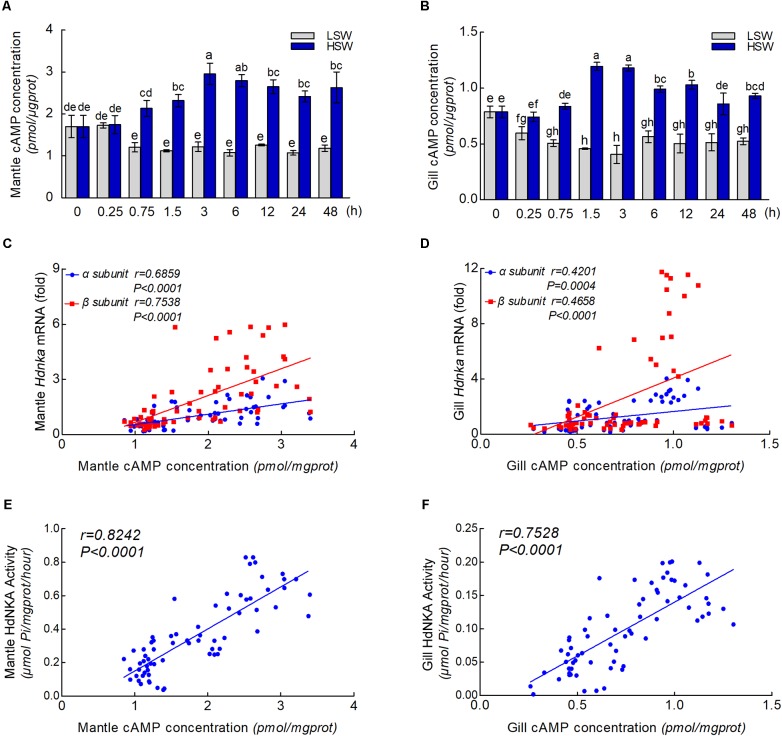
Na+/K+-ATPase (NKA) belongs to the P-type ATPase family, whose members are located in the cell membrane and are distributed in diverse tissues and cells. The main function of the NKA is to regulate osmotic pressure. To better understand the role of NKA in osmoregulation, we first cloned and characterized the full-length cDNAs of NKA α subunit and β subunit from Pacific abalone Haliotis discus hannai in the current study. The predicted protein sequence of the NKA α subunit, as the catalytic subunit, was well conserved. In contrast, the protein sequence of the β subunit had low similarity with those of other species. Phylogenetic analysis revealed that both the α and β subunits of the NKA protein of Pacific abalone were clustered with those of the Gastropoda. Then, the relationship between salinity changes and the NKA was investigated. Sudden salinity changes (with low-salinity seawater (LSW) or high-salinity seawater (HSW)) led to clear changes in ion concentration (Na+ and K+) in hemolymph; however, the relative stability of ion concentrations in tissue revealed that Pacific abalone has a strong osmotic pressure regulation ability when faced with these salinity changes. Meanwhile, the expression and activity of the NKA was significantly decreased (in LSW group) or increased (in HSW group) during the ion concentration re-establishing stages, which was consistent with the coordinated regulation of ion concentration in hemolymph. Moreover, a positive correlation between cyclic adenosine monophosphate (cAMP) concentrations and NKA mRNA expression (NKA activity) was observed in mantle and gill. Therefore, the sudden salinity changes may affect NKA transcription activation, translation and enzyme activity via a cAMP-mediated pathway.
Keywords: Na+/K+-ATPase; cAMP; ion transportation; osmoregulation; salinity.
Figures
Similar articles
-
Na+, K+-ATPase β1 subunit associates with α1 subunit modulating a "higher-NKA-in-hyposmotic media" response in gills of euryhaline milkfish, Chanos chanos.J Comp Physiol B. 2017 Oct;187(7):995-1007. doi: 10.1007/s00360-017-1066-9. Epub 2017 Mar 10. J Comp Physiol B. 2017. PMID: 28283795
-
Osmoregulation in the Plotosidae Catfish: Role of the Salt Secreting Dendritic Organ.Front Physiol. 2018 Jul 3;9:761. doi: 10.3389/fphys.2018.00761. eCollection 2018. Front Physiol. 2018. PMID: 30018560 Free PMC article.
-
Na+/K+-ATPase response to salinity change and its correlation with FXYD11 expression in Anguilla marmorata.J Comp Physiol B. 2017 Oct;187(7):973-984. doi: 10.1007/s00360-017-1059-8. Epub 2017 Mar 9. J Comp Physiol B. 2017. PMID: 28280923
-
Sub-optimal or reduction in temperature and salinity decrease antioxidant activity and cellularity in the hemolymph of the Pacific abalone (Haliotis discus hannai).Fish Shellfish Immunol. 2019 Jan;84:485-490. doi: 10.1016/j.fsi.2018.10.041. Epub 2018 Oct 16. Fish Shellfish Immunol. 2019. PMID: 30339844
-
A Multi-Species Comparison and Evolutionary Perspectives on Ion Regulation in the Antennal Gland of Brachyurans.Front Physiol. 2022 Jun 2;13:902937. doi: 10.3389/fphys.2022.902937. eCollection 2022. Front Physiol. 2022. PMID: 35721559 Free PMC article. Review.
Cited by
-
Dietary Phospholipids and Their Impact on Crustacean Physiology: Growth, Metabolism, Immunity, and Beyond.Aquac Nutr. 2025 Jun 13;2025:8180797. doi: 10.1155/anu/8180797. eCollection 2025. Aquac Nutr. 2025. PMID: 40547201 Free PMC article. Review.
-
Expression levels and activities of energy-yielding ATPases in the oligohaline neritid snail Theodoxus fluviatilis under changing environmental salinities.Biol Open. 2022 Feb 15;11(2):bio059190. doi: 10.1242/bio.059190. Epub 2022 Feb 11. Biol Open. 2022. PMID: 35147181 Free PMC article.
-
Effects of Chronic Low-Salinity Stress on Growth, Survival, Antioxidant Capacity, and Gene Expression in Mizuhopecten yessoensis.Biology (Basel). 2025 Jun 25;14(7):759. doi: 10.3390/biology14070759. Biology (Basel). 2025. PMID: 40723320 Free PMC article.
-
Transcriptome analysis reveals fluid shear stress (FSS) and atherosclerosis pathway as a candidate molecular mechanism of short-term low salinity stress tolerance in abalone.BMC Genomics. 2022 May 23;23(1):392. doi: 10.1186/s12864-022-08611-8. BMC Genomics. 2022. PMID: 35606721 Free PMC article.
-
Indirect sexual selection drives rapid sperm protein evolution in abalone.Elife. 2019 Dec 23;8:e52628. doi: 10.7554/eLife.52628. Elife. 2019. PMID: 31868593 Free PMC article.
References
-
- Amende L. M., Pierce S. K. (1980). Cellular volume regulation in salinity stressed molluscs: the response of Noetia ponderosa (Arcidae) red blood cells to osmotic variation. J. Comp. Physiol. 138 283–289. 10.1007/BF00691562 - DOI
-
- Appeltans W., Bouchet P., Boxshall G., Fauchald K., Gordon D., Hoeksema B., et al. (2014). World Register of Marine Species. 2012. Ostend: WoRMS.
LinkOut - more resources
Full Text Sources
Other Literature Sources