. 2018 Sep 19:9:2041731418800101.
doi: 10.1177/2041731418800101. eCollection 2018 Jan-Dec.

The effect of low-magnitude, high-frequency vibration on poly(ethylene glycol)-microencapsulated mesenchymal stem cells

Affiliations

The effect of low-magnitude, high-frequency vibration on poly(ethylene glycol)-microencapsulated mesenchymal stem cells

Sneha Mehta et al. J Tissue Eng. .

Abstract

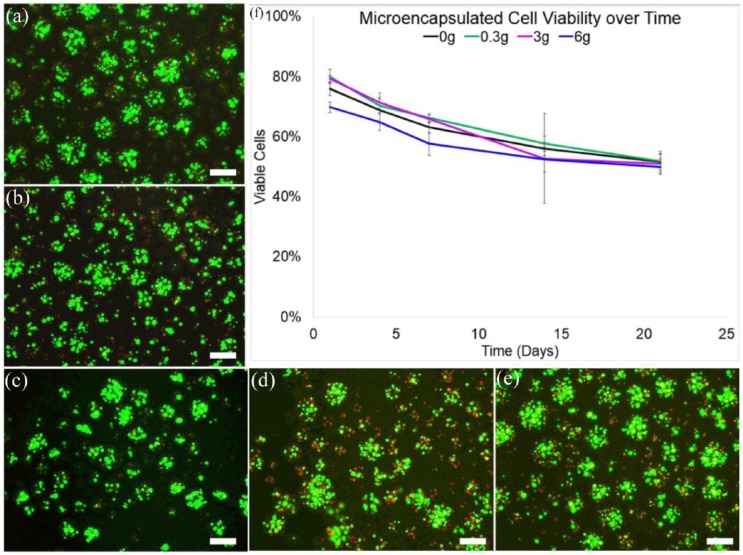
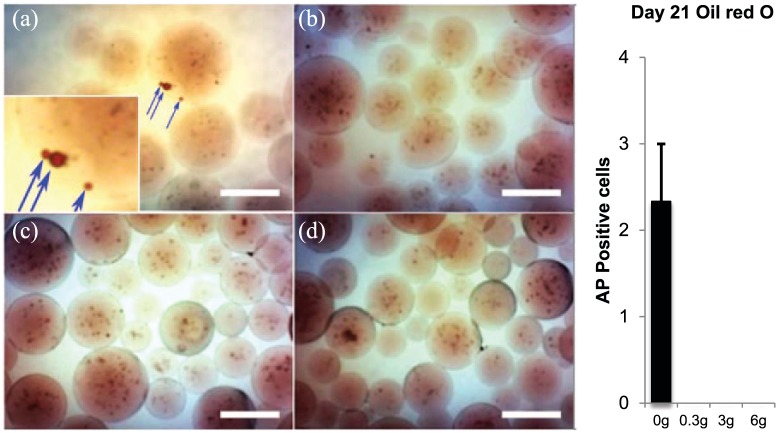
Low-magnitude, high-frequency vibration has stimulated osteogenesis in mesenchymal stem cells when these cells were cultured in certain types of three-dimensional environments. However, results of osteogenesis are conflicting with some reports showing no effect of vibration at all. A large number of vibration studies using three-dimensional scaffolds employ scaffolds derived from natural sources. Since these natural sources potentially have inherent biochemical and microarchitectural cues, we explored the effect of low-magnitude, high-frequency vibration at low, medium, and high accelerations when mesenchymal stem cells were encapsulated in poly(ethylene glycol) diacrylate microspheres. Low and medium accelerations enhanced osteogenesis in mesenchymal stem cells while high accelerations inhibited it. These studies demonstrate that the isolated effect of vibration alone induces osteogenesis.

Keywords: Cell microencapsulation; differentiation; high-frequency vibration; low-magnitude; mesenchymal stem cells; osteogenesis.


Conflict of interest statement

Declaration of conflicting interests: The author(s) declared no potential conflicts of interest with respect to the research, authorship, and/or publication of this article.

Figures

Figure 1.
Figure 1.
Experimental flow graph. hTERT-MSCs were expanded, harvested, pooled, and then combined with an aqueous PEGDA prepolymer solution containing photoinitiators. This solution was combined with a hydrophobic solution containing photoinitiators, vortexed under white light to polymerize cell-laden microdroplets within the emulsion. Resulting cell-laden microspheres were placed in 25 cm2 tissue culture flasks and subjected to vibration or no vibration at room temperature for 24 h. Following vibration, microencapsulated cells were returned to incubators and sampled for evaluation at days 1, 4, 7, 14, and 21. At all times, cells were cultured in basal growth media and never supplemented with inducers of differentiation. All experiments were performed with cells from the same pool, which were then divided after microencapsulation.
Figure 2.
Figure 2.
Representative graphs of vertical displacement (left column), velocity (middle column), and acceleration (right column) for 0.3 g (top row), 3 g (middle row), and 6 g (bottom row) of the media containing microspheres.
Figure 3.
Figure 3.
Cell viability of LMHF 0.3 g vibrated microencapsulated hTERT-hMSCs on days (a) 1, (b) 4, (c) 7, (d) 14, and (e) 21 following vibration (f) Percent cell viability of all treatment groups, 0 (control), 0.3, 3, and 6 g plotted against time. Green indicates live cells, and red indicates dead cells. The maximum viability (80% ± 2.4%) was observed in 0.3 g microsphere samples on day 1 and minimum viability (48% ± 2.4%) was observed in 6 g microsphere samples on day 21. There was no statistical difference between groups. Viability declined over time. Images were adjusted for contrast and brightness. Scale bars are 100 µm. Error bars indicate standard error.
Figure 4.
Figure 4.
Alkaline phosphatase staining on day 4 for (a). Control (0 g) and vibrated groups ((b) 0.3 g, (c) 3 g, and (d) 6 g). Red arrows indicate ALP-positive purple-colored cells. (e) All ALP-positive cells within each 50 µL microsphere sample were counted from images. Scale bars are 100 µm. Error bars show standard error of mean. Asterisks show significant difference from control.
Figure 5.
Figure 5.
Alizarin Red S staining for vibrated and control (0 g) groups on days 14 and 21. Red stain of positively stained calcium deposits is present throughout 0–3 g acceleration; the arrow indicates red color in the 6 g group. The onset of mineralization was accelerated in 0.3 and 3.0 g vibrated groups compared to non-vibrated controls. Microspheres were counted from images (3–6 images per group). Graph shows percent microspheres showing positive ARS stain (positive microspheres ÷ total microspheres). There was no positive staining detected in 6 g vibrated groups on day 14 and very little detected on day 21. Images were adjusted for brightness and contrast. Crosses indicate statistically significant difference (p < 0.05) compared to all other groups. Asterisks indicate statistically significant difference compared to control. Scale bars are 100 µm. Error bars show standard error of mean.
Figure 6.
Figure 6.
Oil red O staining for day 21 for (a). Control (0 g) and vibrated groups ((b) 0.3 g, (c) 3 g, and (d) 6 g). Blue arrows indicate Oil red O-positive red-colored lipid droplets. Due to the 3D nature of the microspheres, the lipid droplets appear as spherical stains distinct and separate from cells (inset). There were only a total of seven microspheres (an average of 2.3 ± 0.7) with positive Oil red O stain counted in all the samples, with all seven from the control non-vibrated group. These droplets did not appear until day 21. Images were adjusted for brightness and contrast. Scale bars are 100 µm.
Figure 7.
Figure 7.
Safranin O staining for day 21 for (a). Control (0 g) and vibrated groups ((b) 0.3 g, (c) 3 g, and (d) 6 g). The sulfated glycosaminoglycans characteristic of differentiated chondrocytes, if stained, appear orange. There was no positive staining detected at any time point for any group. Images were adjusted for brightness and contrast. Scale bars are 100 µm.

Similar articles

Cited by

References

    1. Xie L, Jacobson JM, Choi ES, et al. Low-level mechanical vibrations can influence bone resorption and bone formation in the growing skeleton. Bone 2006; 39: 1059–1066. - PubMed
    1. Judex S, Lei X, Han D, et al. Low-magnitude mechanical signals that stimulate bone formation in the ovariectomized rat are dependent on the applied frequency but not on the strain magnitude. J Biomech 2007; 40: 1333–1339. - PubMed
    1. Xie L, Rubin C, Judex S. Enhancement of the adolescent murine musculoskeletal system using low-level mechanical vibrations. J Appl Physiol 2008; 104: 1056–1062. - PubMed
    1. Vanleene M, Shefelbine SJ. Therapeutic impact of low amplitude high frequency whole body vibrations on the osteogenesis imperfecta mouse bone. Bone 2013; 53: 507–514. - PMC - PubMed
    1. Shi H-F, Cheung W-H, Qin L, et al. Low-magnitude high-frequency vibration treatment augments fracture healing in ovariectomy-induced osteoporotic bone. Bone 2010; 46: 1299–1305. - PubMed

LinkOut - more resources