. 2018 Sep 19:7:66.
doi: 10.1038/s41377-018-0067-0. eCollection 2018.

A deep learning-enabled portable imaging flow cytometer for cost-effective, high-throughput, and label-free analysis of natural water samples

Affiliations

A deep learning-enabled portable imaging flow cytometer for cost-effective, high-throughput, and label-free analysis of natural water samples

Zoltán Gӧrӧcs et al. Light Sci Appl. .

Abstract

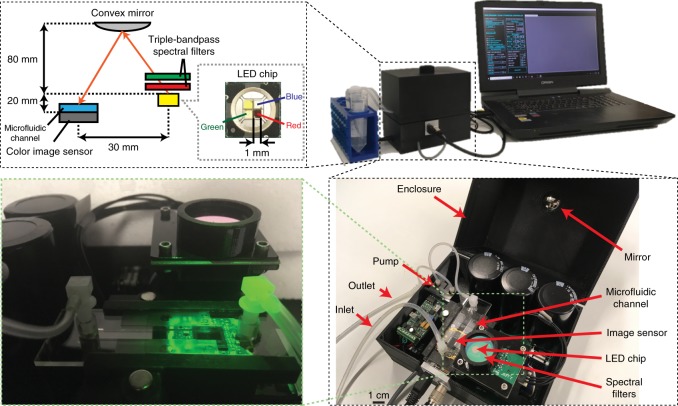
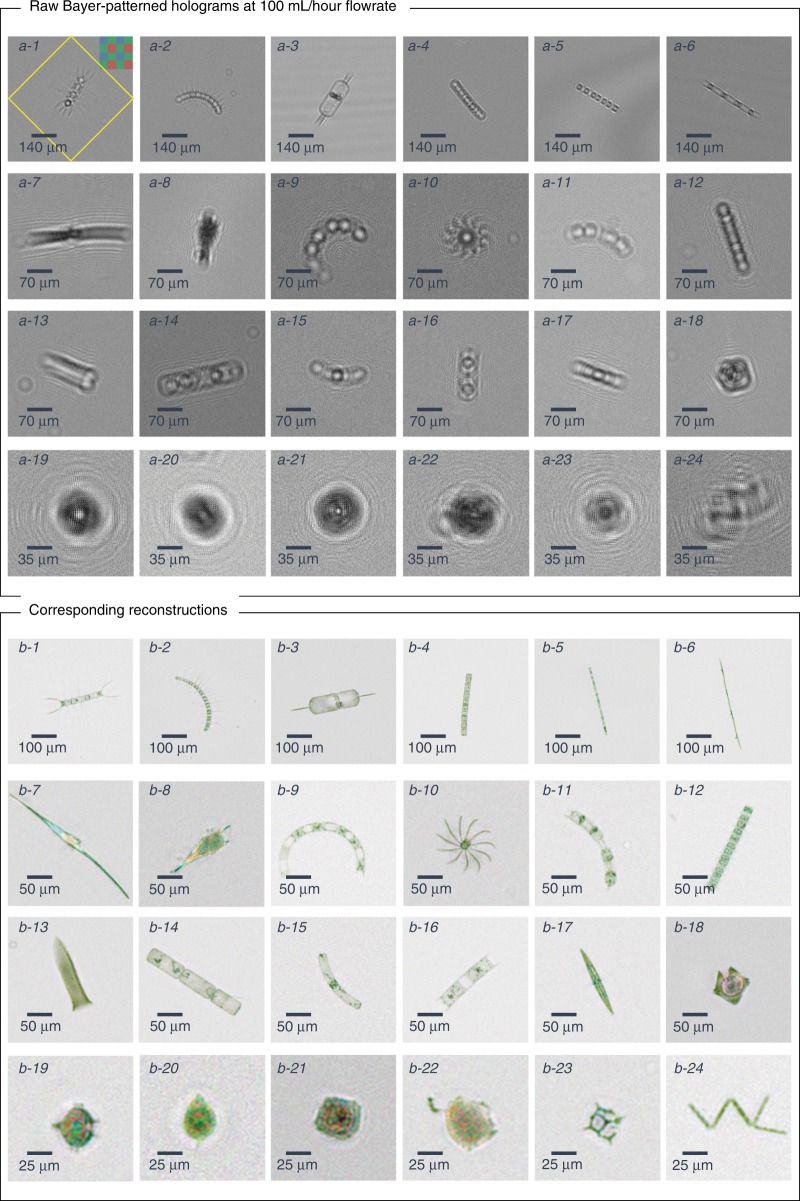
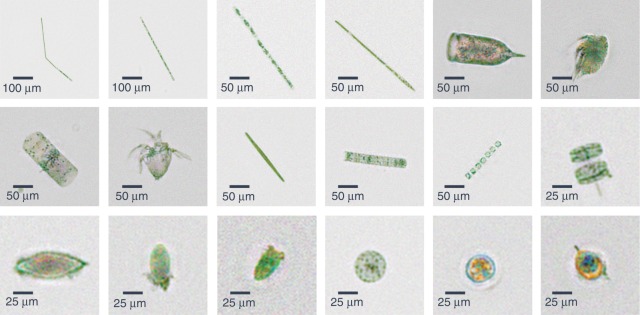
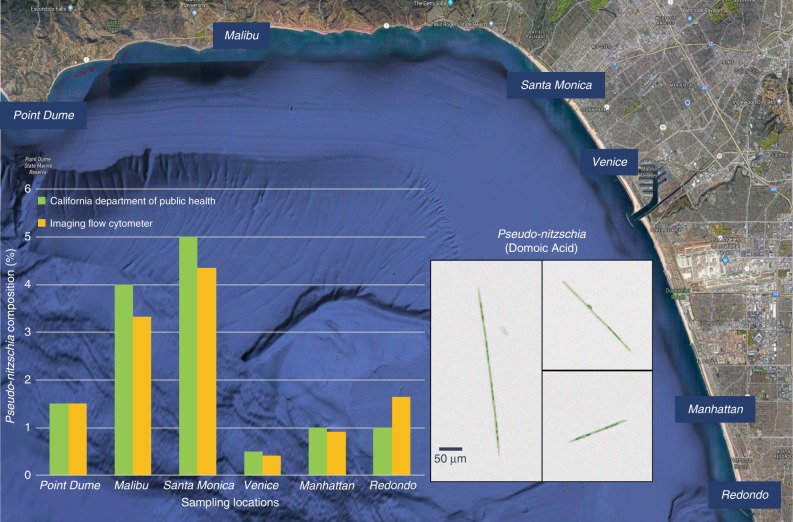
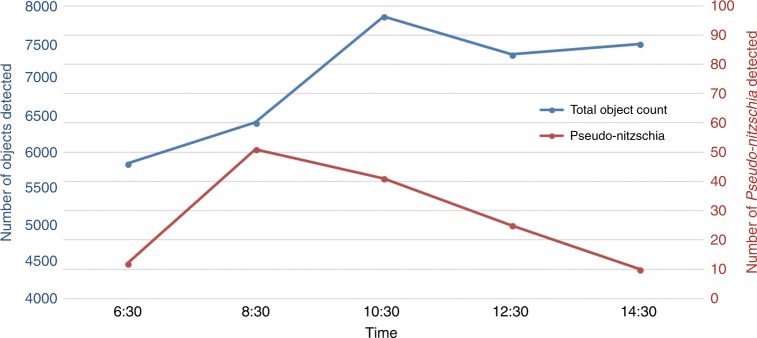
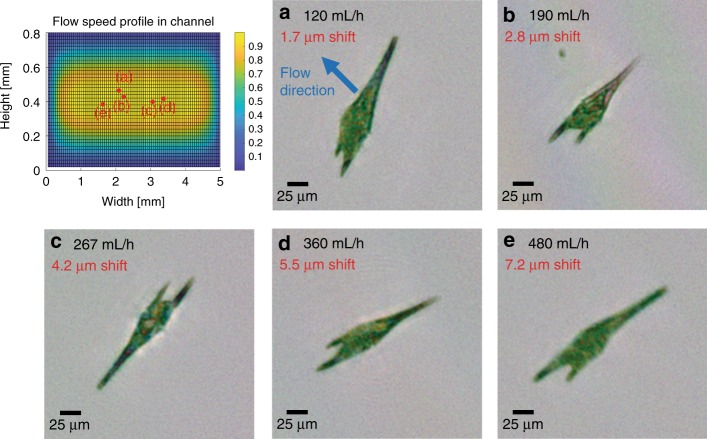
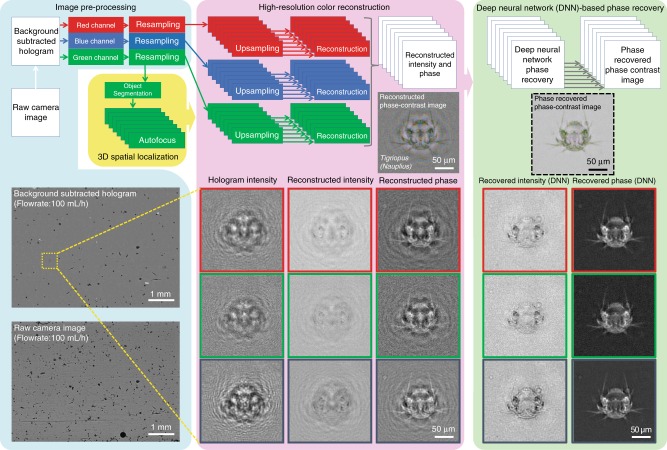
We report a deep learning-enabled field-portable and cost-effective imaging flow cytometer that automatically captures phase-contrast color images of the contents of a continuously flowing water sample at a throughput of 100 mL/h. The device is based on partially coherent lens-free holographic microscopy and acquires the diffraction patterns of flowing micro-objects inside a microfluidic channel. These holographic diffraction patterns are reconstructed in real time using a deep learning-based phase-recovery and image-reconstruction method to produce a color image of each micro-object without the use of external labeling. Motion blur is eliminated by simultaneously illuminating the sample with red, green, and blue light-emitting diodes that are pulsed. Operated by a laptop computer, this portable device measures 15.5 cm × 15 cm × 12.5 cm, weighs 1 kg, and compared to standard imaging flow cytometers, it provides extreme reductions of cost, size and weight while also providing a high volumetric throughput over a large object size range. We demonstrated the capabilities of this device by measuring ocean samples at the Los Angeles coastline and obtaining images of its micro- and nanoplankton composition. Furthermore, we measured the concentration of a potentially toxic alga (Pseudo-nitzschia) in six public beaches in Los Angeles and achieved good agreement with measurements conducted by the California Department of Public Health. The cost-effectiveness, compactness, and simplicity of this computational platform might lead to the creation of a network of imaging flow cytometers for large-scale and continuous monitoring of the ocean microbiome, including its plankton composition.


Conflict of interest statement

A.O. and Z.G. have a pending patent application on the presented imaging flow cytometer.

Figures

Fig. 1
Fig. 1. Photos and schematic of the imaging flow cytometer device.
The water sample is constantly pumped through the microfluidic channel at a rate of 100 mL/h during imaging. The illumination is emitted simultaneously from red, green, and blue LEDs in 120-µs pulses and triggered by the camera. Two triple-bandpass filters are positioned above the LEDs, and the angle of incidence of the light on the filters is adjusted to create a <12 nm bandpass in each wavelength to achieve adequate temporal coherence. The light is reflected from a convex mirror before reaching the sample to increase its spatial coherence while allowing a compact and lightweight optical setup
Fig. 2
Fig. 2. The image quality of the flow cytometer allows the identification of plankton.
Examples of various ocean planktons detected by our imaging flow cytometer at the Los Angeles coastline, represented by their a raw holograms and b phase-contrast reconstructions following phase recovery. The organisms were identified as (1) Chaetoceros lorenzianus, (2) Chaetoceros debilis, (3) Ditylum brightwellii, (4) Lauderia, (5) Leptocylindrus, (6) Pseudo-nitzschia, (7) Ceratium fusus, (8) Ceratium furca, (9) Eucampia cornuta, (10) Bacteriastrum, (11) Hemiaulus, (12) Skeletonema, (13) Ciliate, (14) Cerataulina, (15) Guinardia striata, (16) Lithodesmium, (17) Pleurosigma, (18) Protoperidinium claudicans, (19) Protoperidinium steinii, (20) Prorocentrum micans, (21) Lingulodinium polyedra, (22) Dinophysis, (23) Dictyocha fibula (silica skeleton), and (24) Thalassionema. The yellow rectangle in a-1 represents the segmented and 45° rotated area corresponding to the reconstructed images
Fig. 3
Fig. 3. Reconstructed images of various phytoplankton and zooplankton.
Phase-contrast color images depicting the plankton found near the Los Angeles coastline and imaged by our flow cytometer at a flowrate of 100 mL/h
Fig. 4
Fig. 4. Prevalence of Pseudo-nitzschia in the ocean along the Los Angeles coastline on January 31, 2018.
Samples were collected according to California Department of Public Health (CDPH) protocols. A portion of each sample was analyzed by the imaging flow cytometer system, and the remainder was sent to CDPH for subsequent analysis, which showed good agreement with our measurements. The inset shows phase-contrast reconstruction examples of Pseudo-nitzschia, an alga that can produce domoic acid, a dangerous neurotoxin that causes amnesic shellfish poisoning
Fig. 5
Fig. 5. Field test results from a series of measurements at Redondo Beach on April 17, 2018.
We sampled the top 1.5 m of the ocean every 2 h and measured on-site the variation in the plankton concentration over time. The measurements started after sunrise (6:21 am), and each sample was imaged on-site using the flow cytometer. The results showed an increase in the total particle count during the day, whereas the number of Pseudo-nitzschia showed a peak during the morning hours
Fig. 6
Fig. 6. Effect of increasing the liquid flow speed in the system on the image quality.
The relative flow speed profile inside the rectangular channel cross-section is depicted in the top left (see the Methods section). The measurements were made on an ocean sample containing a high concentration of Ceratium furca, which was therefore used as the model organism for this test. The sample was tested at various flow speeds above 100 mL/h with a constant 120-µs illumination pulse length. We selected the objects located inside the channel near the maximum-flow velocity regions, and their locations are depicted as red dots. ae Reconstructed intensities corresponding to different flow rates are shown. The flow rate (black) and the theoretically calculated displacement during the illumination pulse (red) are also shown
Fig. 7
Fig. 7. The algorithm used for object segmentation and deep learning-based hologram reconstruction in our field-portable imaging flow cytometer is illustrated.
The phase-recovered intensity and phase images in red, green, and blue channels are fused to generate a final phase-contrast image per object (shown within the dashed black frame on the right)

References

    1. Field CB, Behrenfeld MJ, Randerson JT, Falkowski P. Primary production of the biosphere: integrating terrestrial and oceanic components. Science. 1998;281:237–240. doi: 10.1126/science.281.5374.237. - DOI - PubMed
    1. Behrenfeld MJ, et al. Biospheric primary production during an ENSO transition. Science. 2001;291:2594–2597. doi: 10.1126/science.1055071. - DOI - PubMed
    1. Smetacek V, Cloern JE. On phytoplankton trends. Science. 2008;319:1346–1348. doi: 10.1126/science.1151330. - DOI - PubMed
    1. Cloern JE, Jassby AD, Thompson JK, Hieb KA. A cold phase of the East Pacific triggers new phytoplankton blooms in San Francisco Bay. Proc. Natl Acad. Sci. USA. 2007;104:18561–18565. doi: 10.1073/pnas.0706151104. - DOI - PMC - PubMed
    1. Benincà E, et al. Chaos in a long-term experiment with a plankton community. Nature. 2008;451:822–825. doi: 10.1038/nature06512. - DOI - PubMed