. 2018 Sep 12:4:33.
doi: 10.1038/s41420-018-0098-6. eCollection 2018.

Autophagy regulates vinorelbine sensitivity due to continued Keap1-mediated ROS generation in lung adenocarcinoma cells

Affiliations

Autophagy regulates vinorelbine sensitivity due to continued Keap1-mediated ROS generation in lung adenocarcinoma cells

Yan-Wei Wu et al. Cell Death Discov. .

Erratum in

Abstract

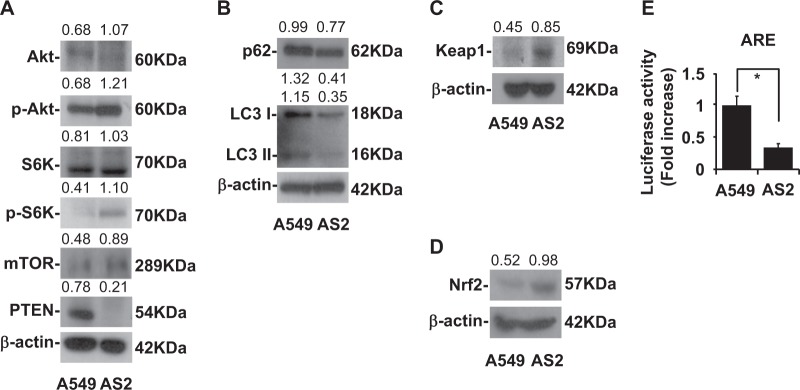
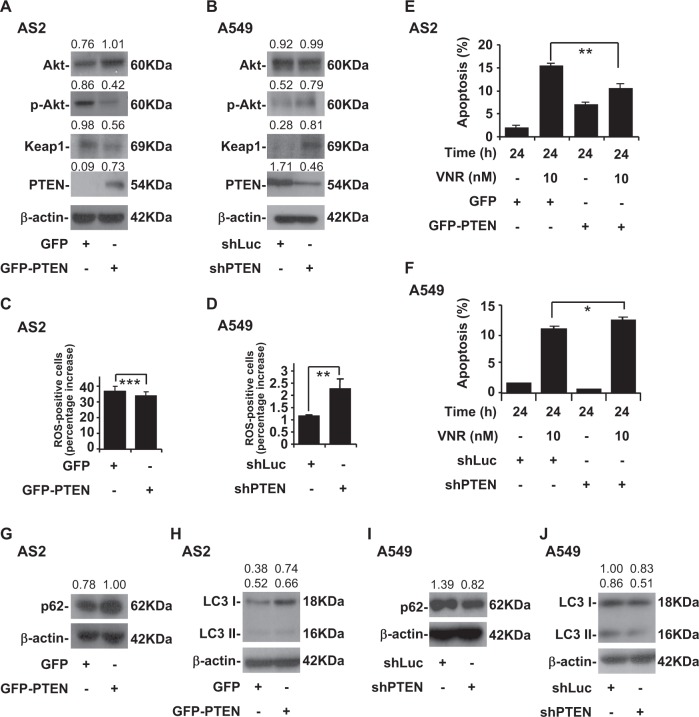
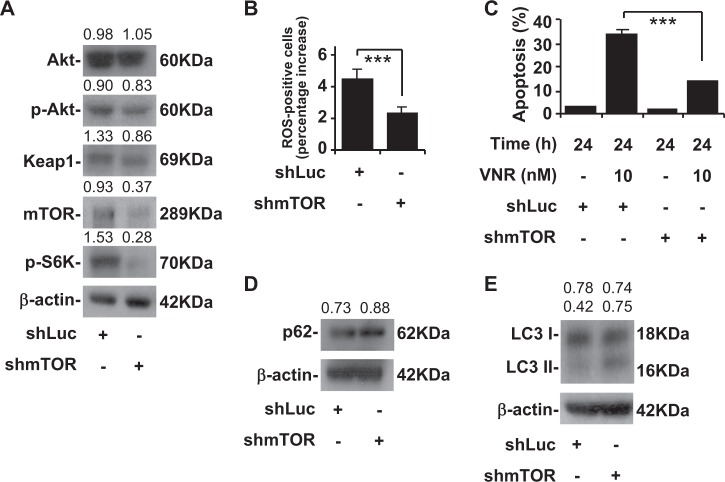
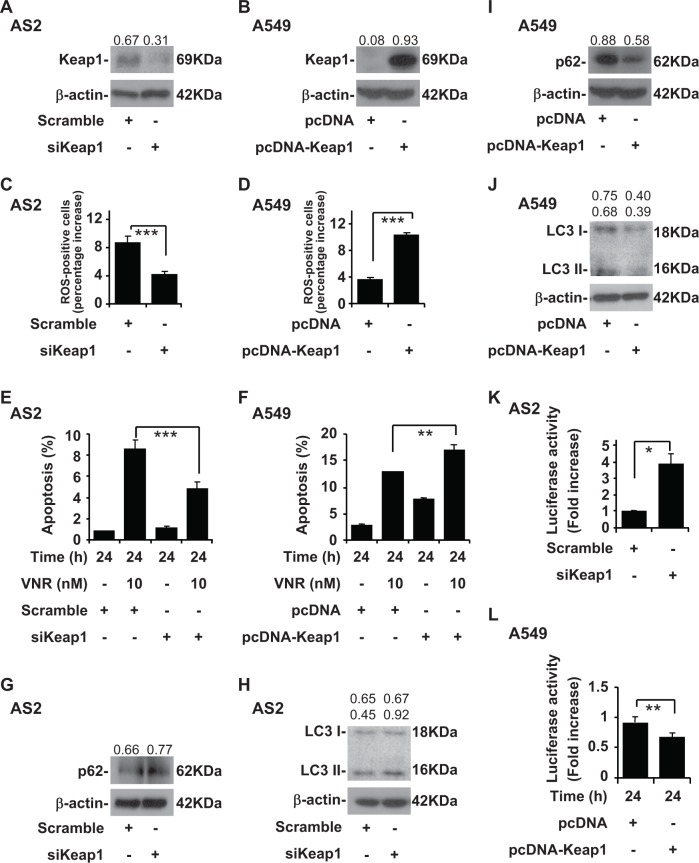
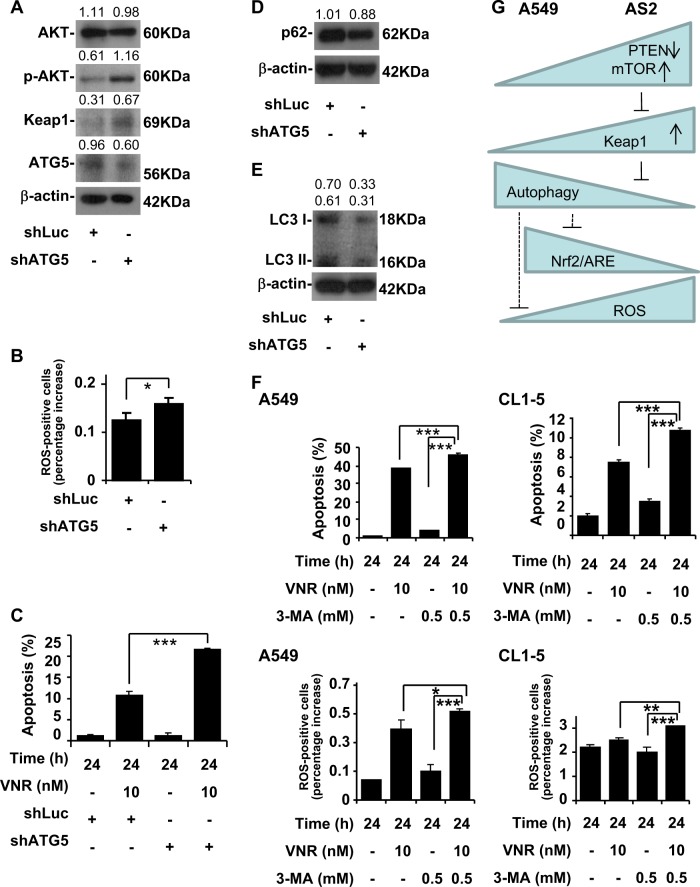
Autophagy is one of the induced mechanisms in metastatic cancer to escape death due to starvation, hypoxia, metabolic stresses, chemotherapy, and radiation. Some publications have revealed that chemotherapy combined with autophagy inhibitor will overcome drug resistance. We modified AS2 cells with PTEN overexpression, mTOR knockdown, or Keap1 knockdown, and made modification of A549 cells with PTEN knockdown, Atg5 knockdown, and Keap1 overexpression. Our study was aimed toward an exploration of how autophagy modulates Keap1, ROS generation, and vinorelbine-induced apoptosis in these cell lines. We found that lung cancer PC14PE6/AS2 (AS2) had higher mTOR and Akt and also lower PTEN expression than A549 cells. Descended autophagy was demonstrated with more decreased p62 accumulation and LC3 II conversion in AS2 cells as compared to A549 cells. The A549 cells had lower Keap1/Nrf2 and more active anti-oxidant response element (ARE) activity than the AS2 cells. We modified AS2 cells with PTEN overexpression, mTOR knockdown, Keap1 knockdown, and revealed amplified p62 and LC3 expression accompanied with decreased Akt, Keap1, ROS, and vinorelbine-induced apoptosis. Declined p62, LC3 expression were accompanied with increased Akt, Keap1, ROS, and vinorelbine-induced apoptosis after modification of A549 cells with PTEN knockdown, Atg5 knockdown, and Keap1 overexpression. Keap1 overexpression lowered ARE levels in A549 cells, and ARE level exhibited up-growth in Keap1 knockdown AS2 cells. The autophagy inhibitor caused more ROS generation and vinorelbine-induced apoptosis in the A549 and CL1-5 cells. According to these findings, autophagy regulates vinorelbine sensitivity by continuing Keap1-mediated ROS generation in lung adenocarcinoma cells.


Conflict of interest statement

The authors declare that they have no conflict of interest.

Figures

Fig. 1
Fig. 1. More dominant autophagy and ARE expression in A549 than in AS2 cells
. a A representative western blot analysis showing the expression of the Akt, p-Akt, S6K, p-S6K, mTOR, PTEN in A549 and AS2 cells. β-actin was used as an internal control. The relative densities of the measured protein bands are also shown. b A representative western blot analysis showing the expression of the p62, LC3 I, LC3 II in A549 and AS2 cells. β-actin was used as an internal control. The relative densities of the measured protein bands are also shown. c A representative western blot analysis showing the expression of Keap1 in the A549 and AS2 cells. β-actin was used as an internal control. The relative densities of the measured protein bands are also shown. d A representative western blot analysis showing the expression of Nrf2 in the A549 and AS2 cells. β-actin was used as an internal control. The relative densities of the measured protein bands are also shown. e A luciferase activity analysis showing the activities of ARE in the A549 and AS2 cells. The mean luciferase activity of each stain is shown as the means ± SDs of three individual experiments. *P< 0.05
Fig. 2
Fig. 2. PTEN regulates autophagy activity followed by ROS level and VNR-induced apoptosis in AS2 and A549 cells.
a A representative western blot analysis showing the expression of Akt, p-Akt, Keap1 and PTEN in the AS2 cells without or with the transfection of plasmids containing GFP-PTEN. GFP was used as a vector control. β-actin was used as an internal control. The relative densities of the measured protein bands are also shown. b A representative western blot analysis showing the expression of Akt, p-Akt, Keap1, PTEN in the A549 cells with shLuc and shPTEN. c CM-H2DCFDA staining, followed by a flow cytometric analysis, was used to determine the levels of ROS in AS2 cells transduced with GFP and GFP-PTEN. For the flow cytometric analyses, the percentages are the means ± SDs of three individual experiments. ***P< 0.001. d CM-H2DCFDA staining, followed by a flow cytometric analysis, was used to determine the levels of ROS in A549 cells with shLuc and shPTEN. For the flow cytometric analyses, the percentages are the means ± SDs of three individual experiments. **P < 0.01. e Nuclear PI staining and subsequent flow cytometric analysis determined cell apoptosis in VNR-treated AS2 cells transduced with GFP and GFP-PTEN. The percentages (%) of apoptotic cells are shown as the means ± SDs of three individual experiments. **P < 0.01. f Nuclear PI staining and subsequent flow cytometric analysis determined cell apoptosis in the VNR-treated A549 cells with shLuc and shPTEN. The percentages (%) of apoptotic cells are shown as the means ± SDs of three individual experiments. *P < 0.05. A representative western blot analysis showing the expression of p62 (g) and LC3 I and II (h) in AS2 cells transduced with GFP and GFP-PTEN. β-actin was used as an internal control. The relative densities of the measured protein bands are also shown. A representative western blot analysis showing the expression of p62 (i) and LC3 I and II (j) in the A549 cells with shLuc and shPTEN
Fig. 3
Fig. 3. mTOR knockdown induces increased autophagy activity followed by diminished ROS and VNR-induced apoptosis in the AS2 cells.
a A representative western blot analysis showing the expression of Akt, p-Akt, Keap1, mTOR and p-S6K in the AS2 cells with shLuc and shmTOR. β-actin was used as an internal control. The relative densities of the measured protein bands are also shown. b CM-H2DCFDA staining, followed by a flow cytometric analysis, was used to determine the levels of ROS in the AS2 cells with shLuc and shmTOR. For the flow cytometric analyses, the percentages are the means ± SDs of three individual experiments. ***P< 0.001. c Nuclear PI staining and a subsequent flow cytometric analysis determined cell apoptosis in VNR-treated AS2 cells with shLuc and shmTOR. The percentages (%) of apoptotic cells are shown as the means ± SDs of three individual experiments. ***P< 0.001. A representative western blot analysis showing the expression of p62 (d) and LC3 I and II (e) in the AS2 cells with shLuc and shmTOR. β-actin was used as an internal control. The relative densities of the measured protein bands are also shown
Fig. 4
Fig. 4. Keap1 regulates autophagy activity followed by ROS level and VNR-induced apoptosis in the AS2 and A549 cells.
a A representative western blot analysis showing the expression of Keap1 in the AS2 cells with or without the transfection of plasmids containing siKeap1. β-actin was used as an internal control. The relative densities of the measured protein bands are also shown. b A representative western blot analysis showing the expression of Keap1 in the A549 cells with or without the transfection of plasmid expressing pcDNA-Keap1, where pcDNA was used as a vector control. c CM-H2DCFDA staining, followed by a flow cytometric analysis, was used to determine the levels of ROS in the AS2 cells with or without the transfection of plasmids containing siKeap1. For the flow cytometric analyses, the percentages are the means ± SDs of three individual experiments. ***P< 0.001. d CM-H2DCFDA staining, followed by a flow cytometric analysis, was used to determine the levels of ROS in the A549 cells transduced with pcDNA and pcDNA-Keap1. For flow cytometric analyses, the percentages are the means ± SDs of three individual experiments. ***P < 0.001. e Nuclear PI staining and a subsequent flow cytometric analysis determined cell apoptosis in the VNR-treated AS2 cells with or without the transfection of plasmids containing siKeap1. The percentages (%) of apoptotic cells are shown as the means ± SDs of three individual experiments. ***P< 0.001. f Nuclear PI staining and a subsequent flow cytometric analysis determined cell apoptosis in the VNR-treated A549 cells transduced with pcDNA and pcDNA-Keap1. The percentages (%) of apoptotic cells are shown as the means ± SDs of three individual experiments. **P < 0.01. A representative western blot analysis showing the expression of p62 (g) and LC3 I and II (h) in the AS2 cells with or without the transfection of plasmids containing siKeap1. β-actin was used as an internal control. The relative densities of the measured protein bands are also shown. A representative western blot analysis showing the expression of p62 (i) and LC3 I and II (j) in the A549 cells transduced with pcDNA and pcDNA-Keap 1. k The luciferase activity analysis showing the expression antioxidant response element of in AS2 with or without the transfection of plasmids containing siKeap1. The mean luciferase activity (fold increase) of each stain is shown as the means ± SDs of three individual experiments, *P < 0.05. l The luciferase activity analysis showing the expression antioxidant response element of in A549 transduced with pcDNA and pcDNA-Keap1. The mean luciferase activity (fold increase) of each stain is shown as the means ± SDs of three individual experiments, **P < 0.01
Fig. 5
Fig. 5. Blocking autophagy induces the amplification of ROS and VNR-induced apoptosis in the A549 and CL1-5 cells.
a A representative western blot analysis showing the expression of Akt, p-Akt, Keap1, ATG5 in the A549 cells with shLuc and shATG5. β-actin was used as an internal control. The relative densities of the measured protein bands are also shown. b CM-H2DCFDA staining, followed by a flow cytometric analysis, was used to determine the levels of ROS in A549 cells with shLuc and shATG5. For the flow cytometric analyses, the percentages are the means ± SDs of three individual experiments. *P< 0.5. c Nuclear PI staining and subsequent flow cytometric analysis determined cell apoptosis in the VNR-treated A549 cells with shLuc and shATG5. The percentages (%) of apoptotic cells are shown as the means ± SDs of three individual experiments. ***P< 0.001. A representative western blot analysis showing the expression of p62 (d) and LC3 I and II (e) in A549 cells with shLuc and shATG5. β-actin was used as an internal control. The relative densities of the measured protein bands are also shown. f Nuclear PI staining and subsequent flow cytometric analysis determined cell apoptosis in the VNR-treated A549 and CL1-5 cells with or without autophagy inhibitor 3-MA. The percentages (%) of apoptotic cells are shown as the means ± SDs of three individual experiments. ***P < 0.001. CM-H2DCFDA staining, followed by a flow cytometric analysis, was used to determine the levels of ROS in the VNR-treated A549 and CL1-5 cells with or without autophagy inhibitor 3-MA. For the flow cytometric analyses, the percentages are the means ± SDs of three individual experiments. *P < 0.05, **P < 0.01, ***P < 0.001. g A hypothetic model of this work. Targeting the regulators of autophagy modulates Keap1-mediated ARE activity, ROS generation, and VNR-induced apoptosis

References

    1. Rao S, et al. A dual role for autophagy in a murine model of lung cancer. Nat. Commun. 2014;5:3056. doi: 10.1038/ncomms4056. - DOI - PubMed
    1. Filomeni G, De Zio D, Cecconi F. Oxidative stress and autophagy: the clash between damage and metabolic needs. Cell Death Differ. 2015;22:377–388. doi: 10.1038/cdd.2014.150. - DOI - PMC - PubMed
    1. Yang Z, Klionsky DJ. Mammalian autophagy: core molecular machinery and signaling regulation. Curr. Opin. Cell Biol. 2010;22:124–131. doi: 10.1016/j.ceb.2009.11.014. - DOI - PMC - PubMed
    1. Navarro-Yepes J, et al. Oxidative stress, redox signaling, and autophagy: cell death versus survival. Antioxid. Redox Signal. 2014;21:66–85. doi: 10.1089/ars.2014.5837. - DOI - PMC - PubMed
    1. Komatsu M, et al. Homeostatic levels of p62 control cytoplasmic inclusion body formation in autophagy-deficient mice. Cell. 2007;131:1149–1163. doi: 10.1016/j.cell.2007.10.035. - DOI - PubMed