

Kindlin-2 regulates hepatic stellate cells activation and liver fibrogenesis
- PMID: 30245857
- PMCID: PMC6135746
- DOI: 10.1038/s41420-018-0095-9
Kindlin-2 regulates hepatic stellate cells activation and liver fibrogenesis
Erratum in
-
Erratum: Publisher Correction: articles initially published in wrong volume.Cell Death Discov. 2019 Jul 10;5:116. doi: 10.1038/s41420-019-0186-2. eCollection 2019. Cell Death Discov. 2019. PMID: 31312525 Free PMC article.
Abstract
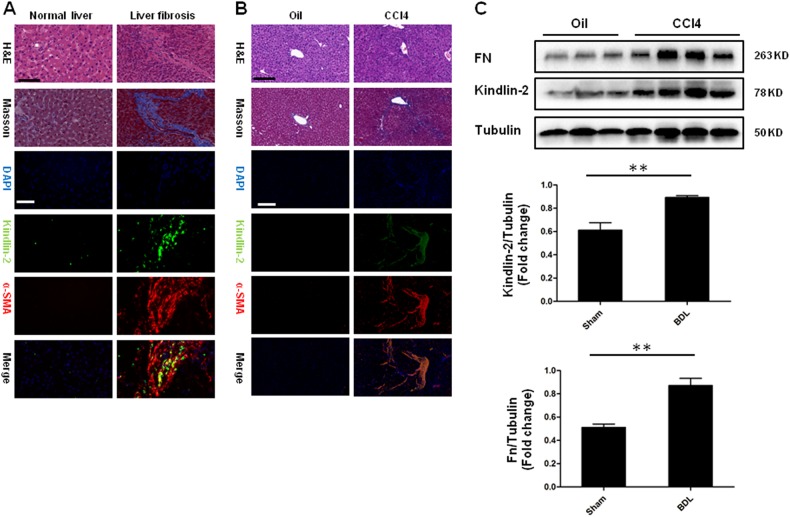
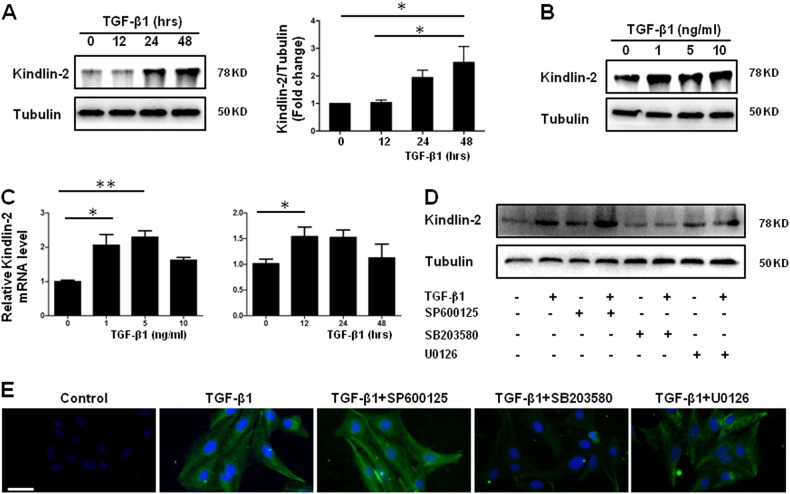
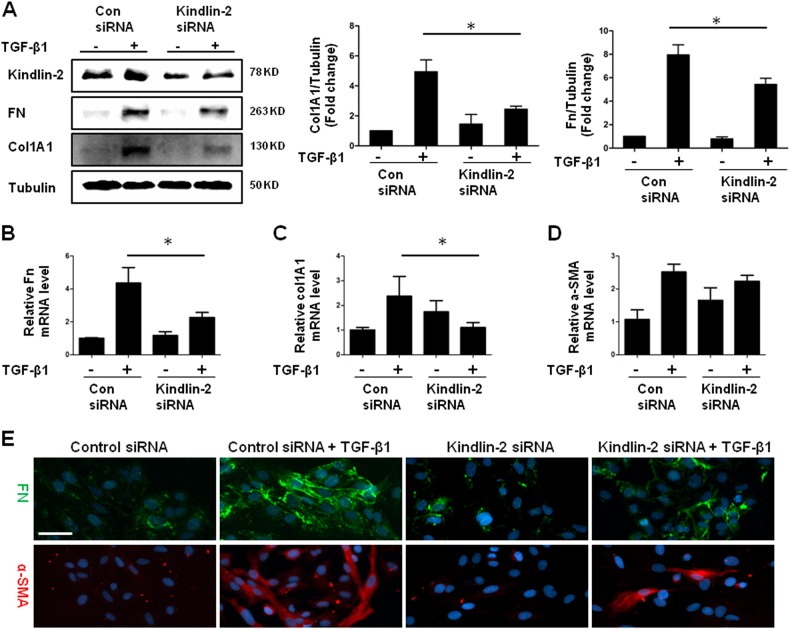
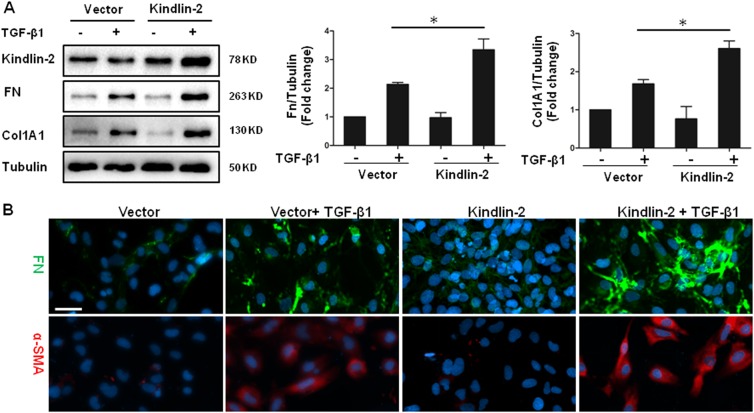
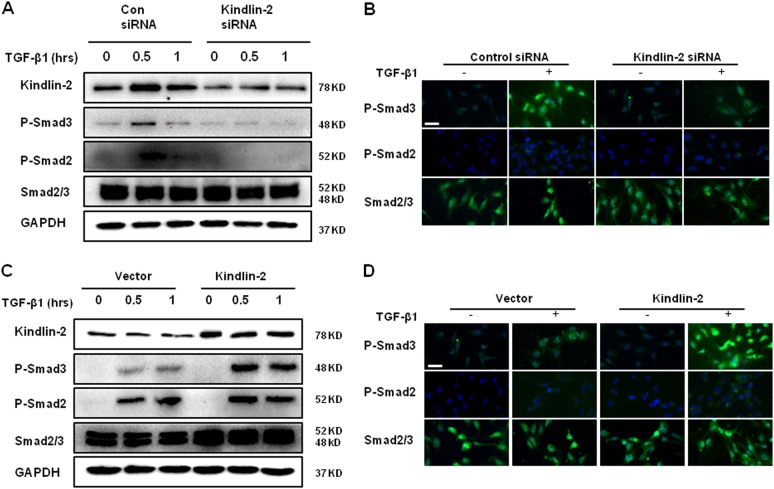
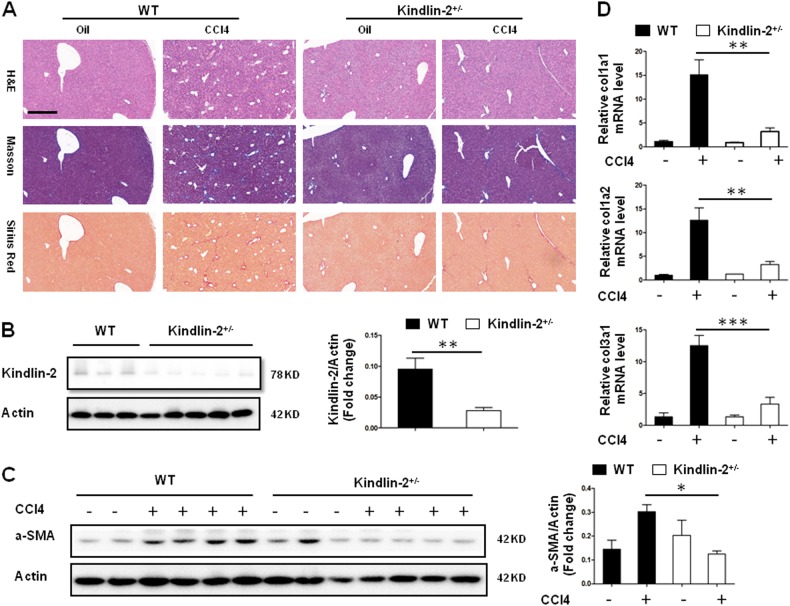
Liver fibrosis, the common response associated with chronic liver diseases, ultimately leads to cirrhosis, a major public health problem worldwide. Activation of hepatic stellate cells (HSCs) by transforming growth factor (TGF)-β1 is a key step in liver fibrosis. Here we report that Kindlin-2 expression is elevated in the livers of mice with experimental liver fibrosis and also in the livers of patients with liver fibrosis. TGF-β1 increases Kindlin-2 expression in cultured HSCs in a p38 and ERK mitogen-activated protein kinase (MAPK)-dependent manner, partly. More importantly, Kindlin-2 deficiency significantly attenuated mouse liver fibrosis and HSC activation. Mechanistically, Kindlin-2 promotes TGF-β signaling through upregulation of Smad2 and Smad3 phosphorylation. Our work demonstrates an important role for Kindlin-2 in liver fibrosis, and inhibiting Kindlin-2 in the livers may represent a novel strategy to treat liver fibrosis.
Conflict of interest statement
The authors declare that they have no conflict of interest.
Figures
Similar articles
-
Salvianolic acid B exerts anti-liver fibrosis effects via inhibition of MAPK-mediated phospho-Smad2/3 at linker regions in vivo and in vitro.Life Sci. 2019 Dec 15;239:116881. doi: 10.1016/j.lfs.2019.116881. Epub 2019 Oct 31. Life Sci. 2019. PMID: 31678285
-
Bone morphogenetic protein-7 represses hepatic stellate cell activation and liver fibrosis via regulation of TGF-β/Smad signaling pathway.World J Gastroenterol. 2019 Aug 14;25(30):4222-4234. doi: 10.3748/wjg.v25.i30.4222. World J Gastroenterol. 2019. PMID: 31435175 Free PMC article.
-
Activation of TGF-β1-CD147 positive feedback loop in hepatic stellate cells promotes liver fibrosis.Sci Rep. 2015 Nov 12;5:16552. doi: 10.1038/srep16552. Sci Rep. 2015. PMID: 26559755 Free PMC article.
-
Pin1 induction in the fibrotic liver and its roles in TGF-β1 expression and Smad2/3 phosphorylation.J Hepatol. 2014 Jun;60(6):1235-41. doi: 10.1016/j.jhep.2014.02.004. Epub 2014 Feb 13. J Hepatol. 2014. PMID: 24530597
-
Activation of Nrf2/AREs-mediated antioxidant signalling, and suppression of profibrotic TGF-β1/Smad3 pathway: a promising therapeutic strategy for hepatic fibrosis - A review.Life Sci. 2020 Sep 1;256:117909. doi: 10.1016/j.lfs.2020.117909. Epub 2020 Jun 5. Life Sci. 2020. PMID: 32512009 Review.
Cited by
-
Liver Fibrosis Resolution: From Molecular Mechanisms to Therapeutic Opportunities.Int J Mol Sci. 2023 Jun 2;24(11):9671. doi: 10.3390/ijms24119671. Int J Mol Sci. 2023. PMID: 37298621 Free PMC article. Review.
-
Elevated kindlin-2 promotes tumour progression and angiogenesis through the mTOR/VEGFA pathway in melanoma.Aging (Albany NY). 2019 Aug 19;11(16):6273-6285. doi: 10.18632/aging.102187. Epub 2019 Aug 19. Aging (Albany NY). 2019. PMID: 31427543 Free PMC article.
-
YBX1 knockdown induces renal cell carcinoma cell apoptosis via Kindlin-2.Cell Cycle. 2021 Nov;20(22):2413-2427. doi: 10.1080/15384101.2021.1985771. Epub 2021 Oct 28. Cell Cycle. 2021. PMID: 34709966 Free PMC article.
-
JNK and p38 Inhibitors Prevent Transforming Growth Factor-β1-Induced Myofibroblast Transdifferentiation in Human Graves' Orbital Fibroblasts.Int J Mol Sci. 2021 Mar 14;22(6):2952. doi: 10.3390/ijms22062952. Int J Mol Sci. 2021. PMID: 33799469 Free PMC article.
-
Targeting Kindlin-2 in adipocytes increases bone mass through inhibiting FAS/PPARγ/FABP4 signaling in mice.Acta Pharm Sin B. 2023 Nov;13(11):4535-4552. doi: 10.1016/j.apsb.2023.07.001. Epub 2023 Jul 7. Acta Pharm Sin B. 2023. PMID: 37969743 Free PMC article.
References
LinkOut - more resources
Full Text Sources
Other Literature Sources
Miscellaneous
