. 2018 Jul 29:9:122-131.
doi: 10.1016/j.bonr.2018.07.005. eCollection 2018 Dec.

Ptychographic X-ray CT characterization of the osteocyte lacuno-canalicular network in a male rat's glucocorticoid induced osteoporosis model

Affiliations

Ptychographic X-ray CT characterization of the osteocyte lacuno-canalicular network in a male rat's glucocorticoid induced osteoporosis model

Antonia Ciani et al. Bone Rep. .

Erratum in

Abstract

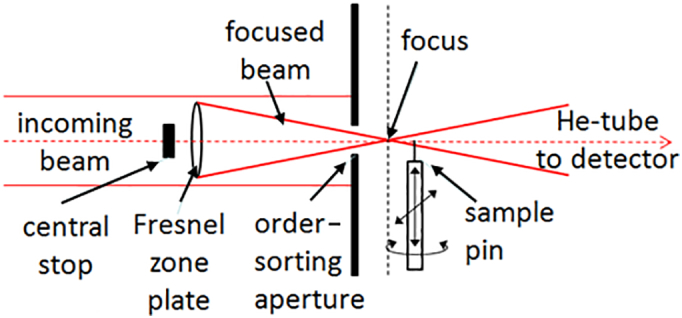
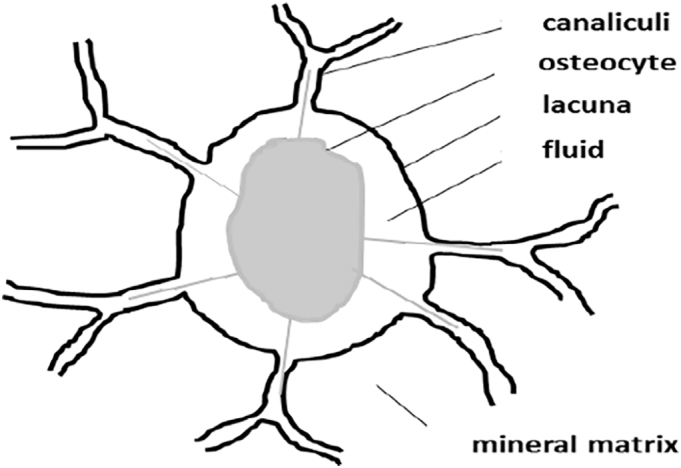
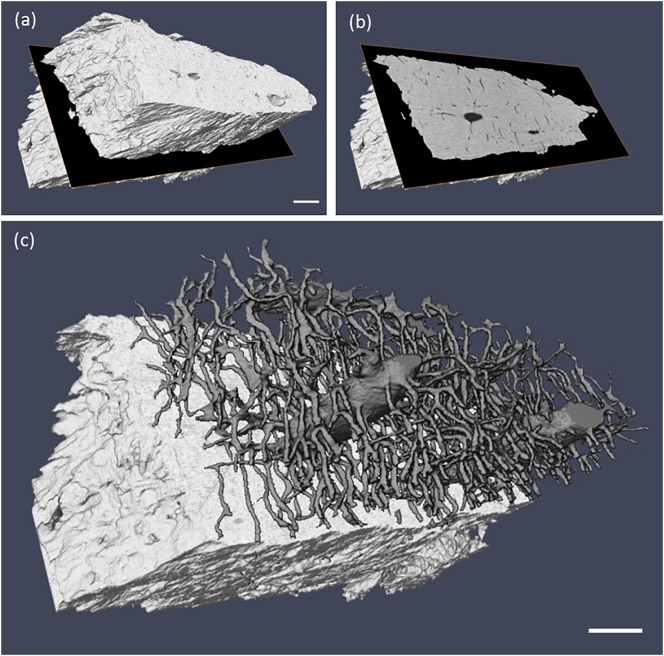
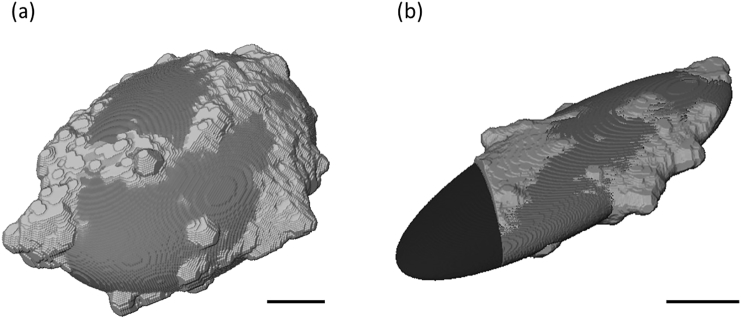
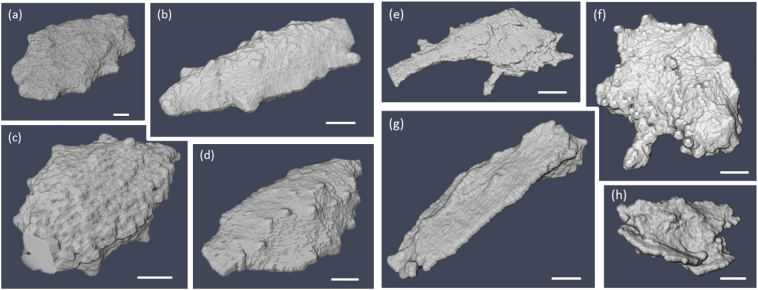
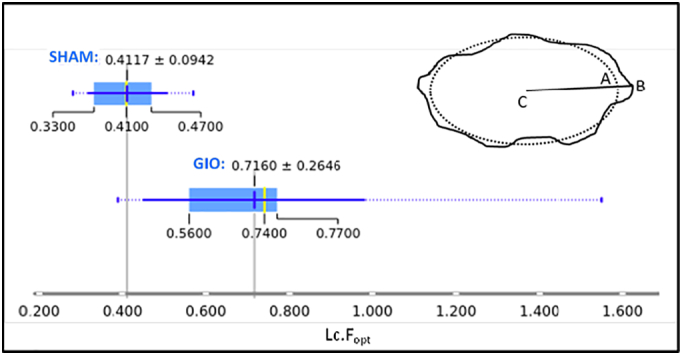
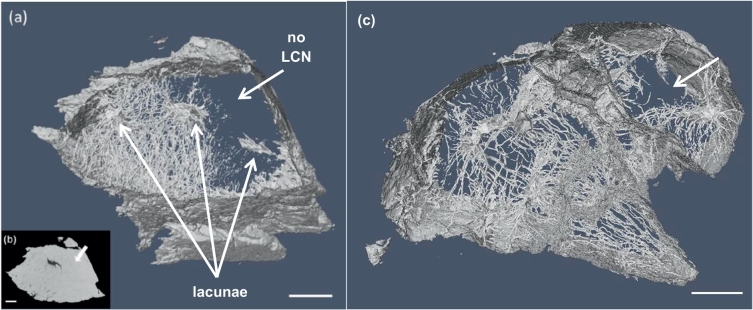
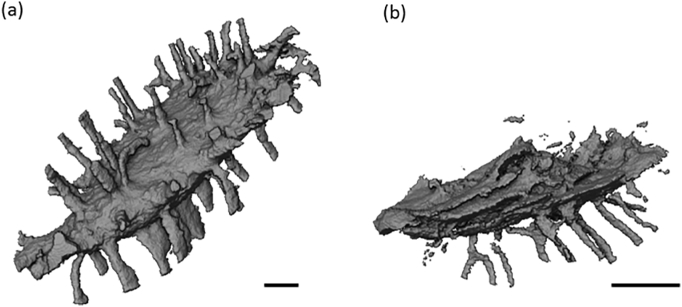
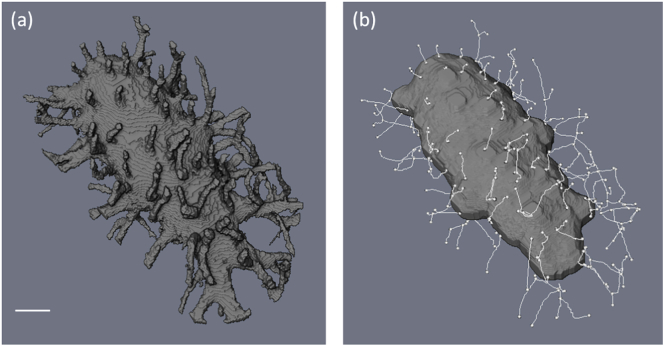
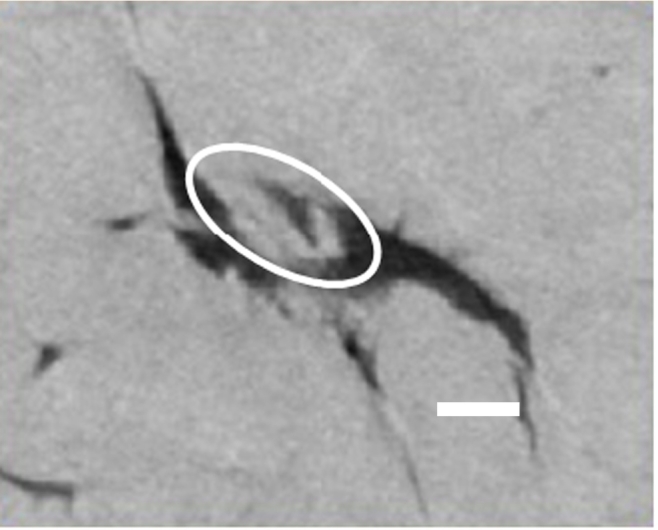
Ptychographic X-ray computed tomography (PXCT) is a quantitative imaging modality that non-destructively maps the 3D electron density inside an object with tens of nanometers spatial resolution. This method provides unique access to the morphology and structure of the osteocyte lacuno-canalicular network (LCN) and nanoscale density of the tissue in the vicinity of an osteocyte lacuna. Herein, we applied PXCT to characterize the lacunae and LCN in a male Wistar rat model of glucocorticoid-induced osteoporosis (GIO). The ptychographic images revealed significant (p < 0.05) differences in the number of canaliculi originating from the lacuna per ellipsoidal surface unit, Ca.Nb (p = 0.0106), and the 3D morphology of the lacuna (p = 0.0064), between GIO and SHAM groups. Moreover, the mean canalicular diameter, Ca.Dm, was slightly statistically un-significantly smaller in GIO (152 ± 6.5) nm than in SHAM group (165 ± 8) nm (p = 0.053). Our findings indicate that PXCT can non-destructively provide detailed, nanoscale information on the 3D organization of the LCN in correlative studies of pathologies, such as osteoporosis, leading to improved diagnosis and therapy.

Keywords: Glucocorticoid-induced osteoporosis; Nano-CT; Osteocytes; Ptychography; Quantitative analysis.


Figures

Fig. 1
Fig. 1
A schematic illustration of the experimental geometry for ptychographic data acquisition. The beam is focused by a Fresnel zone plate, increasing the flux density on the sample, which is supported on a scanning and rotation stage. The diffraction signal is measured by a detector in the far field (not shown).
Fig. 2
Fig. 2
A sketch of an osteocyte section with its lacuna and canaliculi and surrounding matrix. The osteocyte (cell body + cytoplasmic processes) is represented in gray. The lacuna, or the cavity in which the cells are located, and the canaliculi are outlined in black.
Fig. 3
Fig. 3
(a) 3D rendering of the masked sample volume. A slice through the tomogram data set is indicated and shown in (b) where the LCN structure is visible as voids in black on the gray background of the matrix. (c) Rendering of the LCN structure above the tomogram slice in (b). The white scale bar in (a) and (c) represents a length of 10 μm.
Fig. 4
Fig. 4
Ellipsoidal fit for (a) an entire lacuna from a SHAM sample, and (b) a partial lacuna from a SHAM sample that was bisected by the edge of the reconstructed tomogram volume. The black volume in (b) shows the volume extension approximated by the fitted ellipsoid for the partially imaged lacuna. The black scale bar in each image represents 1 μm.
Fig. 5
Fig. 5
(a–d) Examples of lacunae extracted from SHAM samples showing regular ellipsoidal-like shapes, and (e–h) from GIO samples, showing irregularly shaped lacunae. The scale bar in each image represents 1 μm.
Fig. 6
Fig. 6
A box-and-whisker plot summarizes the optimization residual Lc.Fopt values for each group, indicating the wide variation in the GIO group compared to the SHAM group, and the significant difference in their distributions. The mean value and standard deviation is indicated above each boxplot. The dotted lines extend to the outliers beyond 1.5 times the interquartile range from the mean. The Wilcoxon-Mann-Whitney test yields p = 0.0046 for these two distributions. INSET: An illustration of the ellipsoidal fitting: the dotted line represents a section of the fitted ellipsoid; the solid line represents the lacuna surface. The departure from ellipsoidal is quantified by Lc.Fopt=iAB¯i2/N where AB¯ is the distance between the best-fit ellipsoid at A and the surface voxel B in the direction toward the center C, and N is the total number of surface points.
Fig. 7
Fig. 7
(a) An image of the segmented LCN showing, indicated by a white arrow, approx. (10 × 20 × 40) μm3 region with absent canaliculi, surrounded by isolated, disconnected lacunae, in an example from the GIO group; (b) a tomogram slice in this region confirms the absence of canaliculi, with a featureless matrix region highlighted by a white arrow; (c) shows another GIO group sample with a region containing no canaliculi. The white scale bar in each image represents 10 μm.
Fig. 8
Fig. 8
Lacuna and primary canaliculi directly connected to it in the case of (a) a lacuna in SHAM group, and (b) a partially connected lacuna from the GIO group, from a location bordering on a disrupted LCN region. The black scale bar in each image represents 1 μm.
Fig. 9
Fig. 9
(a) Ellipsoidal volume of interest extracted around the center of the lacuna, segmented to remove the bone matrix, (b) skeletonization of the LCN in the vicinity of the lacuna. This procedure yields the number of primary canaliculi directly connected to the lacuna, Ca.Pr, and the length of the first branching distance, Ca.Db. The white scale bar in (a) represents 1 μm.
Fig. 10
Fig. 10
Part of a tomogram slice through an osteocyte lacuna from the glucocorticoid-treated (GIO) group, showing gray matrix material both inside and outside the black lacuna. The material partially filling the lacuna (white oval) has the same density as the surrounding matrix. The white scale bar indicates 2 μm.

References

    1. Achiou Z., Toumi H., Touvier J., Boudenot A., Uzbekov R., Ominsky M.S. Sclerostin antibody and interval treadmill training effects in a rodent model of glucocorticoid-induced osteopenia. Bone. 2015 Dec;81:691–701. - PubMed
    1. FEI Visualization Sciences Group, Burlington MA, Avizo Fire v. 9.0
    1. Bach-Gansmo F.L., Weaver J.C., Jensen M.H., Leemreize H., Mader K.S., Stampanoni M. Osteocyte lacunar properties in rat cortical bone: differences between lamellar and central bone. J. Struct. Biol. 2015 Jul;191(1):59–67. - PubMed
    1. Bonewald L.F. The amazing osteocyte. J. Bone Miner. Res. 2011 Feb;26(2):229–238. - PMC - PubMed
    1. Briot K., Roux C. Glucocorticoid-induced osteoporosis. RMD open. 2015;1(1) - PMC - PubMed

LinkOut - more resources