. 2018 Aug 21:9:1030.
doi: 10.3389/fphys.2018.01030. eCollection 2018.

Inflammatory Cytokines and SIRT1 Levels in Subcutaneous Abdominal Fat: Relationship With Cardiac Performance in Overweight Pre-diabetics Patients

Affiliations

Inflammatory Cytokines and SIRT1 Levels in Subcutaneous Abdominal Fat: Relationship With Cardiac Performance in Overweight Pre-diabetics Patients

Celestino Sardu et al. Front Physiol. .

Abstract

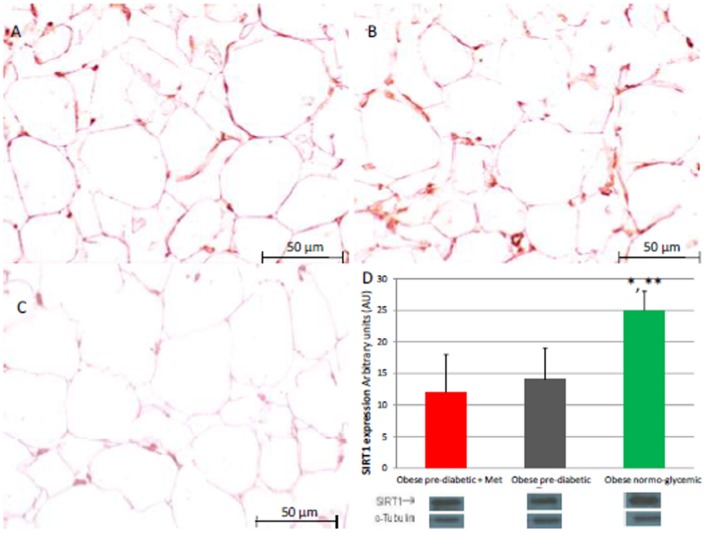
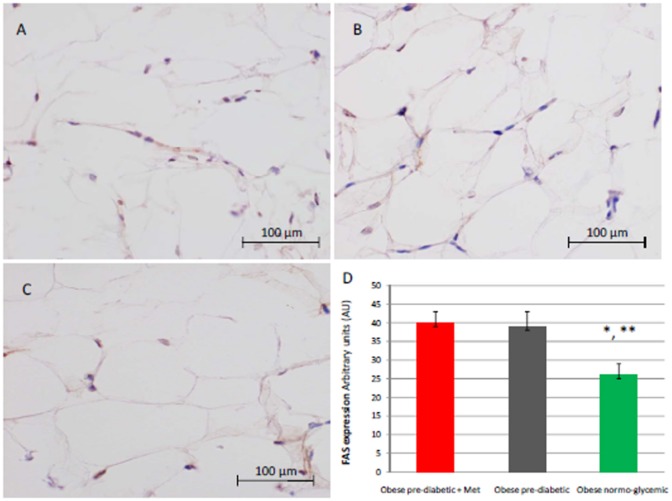
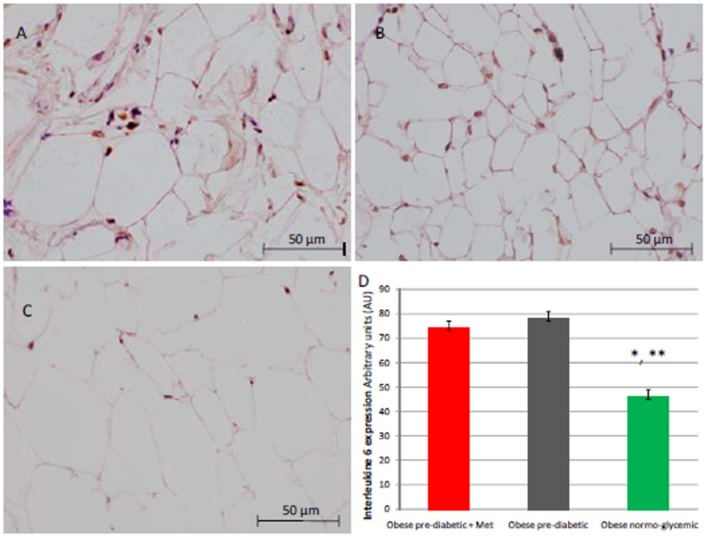
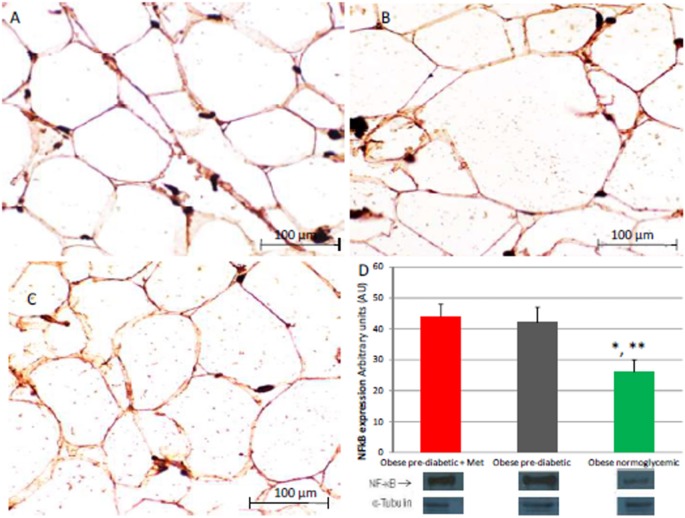
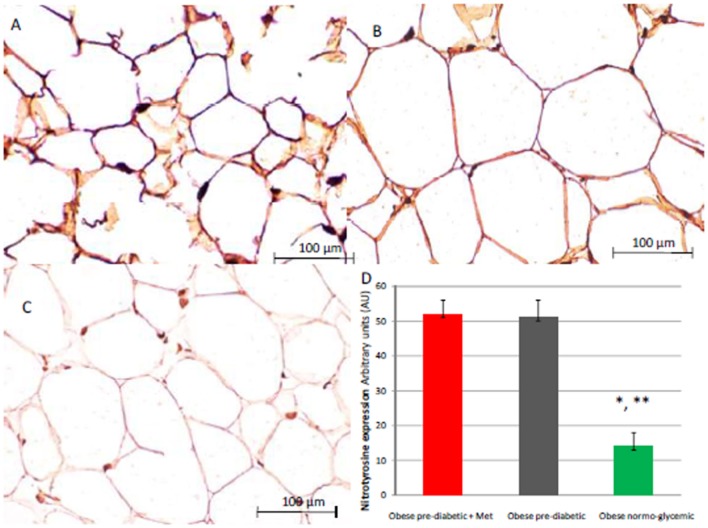
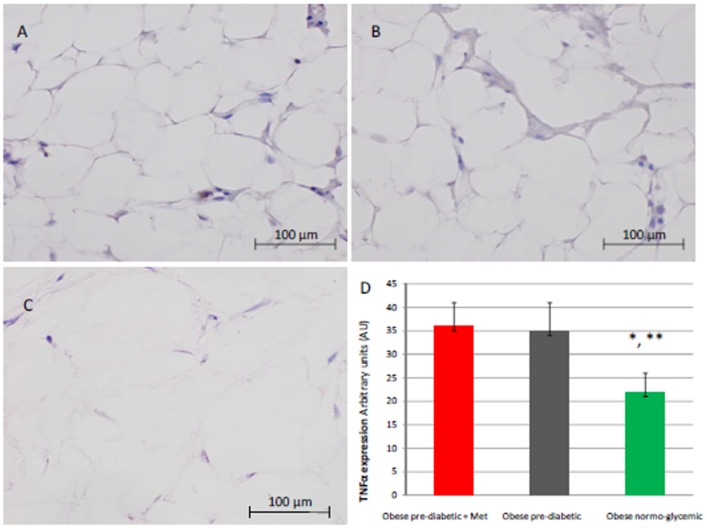
Objectives: In obese patients the superficial adipose tissue expresses cytokines, and sirtuins, that may affect myocardial function. In this study, we investigated the effect of metformin therapy added to a hypocaloric diet on the inflammatory pattern and cardiac performance (MPI) in obese patients with pre-diabetic condition. Materials and Methods: Fifty-eight obese patients that were enrolled for abdominoplastic surgery were divided into patients with pre-diabetic condition (n 40) and normo-glycemic patients (n18). Patients with pre-diabetic condition were randomly assigned to metformin therapy added to a hypocaloric diet (group 1, n 20) or to a hypocaloric diet therapy alone (group 2, n20). Patients with normo-glycemic condition were assigned to a hypocaloric diet therapy. Results: During enrollment, obese patients with a pre-diabetic condition (group 1 and 2) presented higher glucose values, lower values of insulin, and higher values of the homeostasis model for the assessment of insulin resistance (HOMA-IR) than obese patients with normo-glycemic condition(group 3). In addition, they had higher values of C Reactive protein (CRP), interleukin 6 (IL6), and lower values of sirtuin 1(SIRT1). In the 12th month of the follow-up, metformin therapy induced in patients with pre-diabetic condition (group 1) a significant reduction of glucose values, HOMA-IR, and inflammatory markers such as CRP (1.04 ± 0.48 vs. 0.49 ± 0.02 mmol/L, p < 0.05), IL6 (4.22 ± 0.45 vs. 3.33 ± 0.34 pg/ml, p < 0.05), TNFα (6.95 ± 0.59 vs. 5.15 ± 0.44 pg/ml, p < 0.05), and Nitrotyrosine (5,214 ± 0,702 vs. 2,151 ± 0,351 nmol/l, p < 0.05). This was associated with a significant reduction of Intima-media thickness (1.01 ± 0.15 vs. 0.86 ± 0.15 mm, p < 0.05), Septum (14 ± 2.5 vs. 10.5 ± 2 mm, p < 0.05), Posterior wall (11 ± 1.5 vs. 8 ± 1 mm, p < 0.05), LV mass (192.5 ± 49.5 vs. 133.2 ± 37.6 g, p < 0.05) and of MPI (0.58 ± 0.03 vs. 0.38 ± 0.02, p < 0.05). At 12 months of follow-up, group 2 experienced only a reduction of cholesterol (4.15 ± 0.94 vs. 4.51 ± 0.88 mmol/L, p < 0.05) and triglycerides (1.71 ± 1.18 vs. 1.83 ± 0.54 mmol/L, p < 0.05). At 12 months of follow-up, group 3 experienced a significant reduction of inflammatory markers, and also of echographic parameters, associated with amelioration of myocardial performance. To date, IL6 expression was related to higher values of left ventricle mass (R-value 0.272, p-value 0.039), and to higher IMT (R-value 0.272, p-value 0.039), such as those observed for CRP (R-value 0.308, p-value 0.021), for glucose blood values (R-value 0.449, p-value 0.001), and for HOMA-IR (R-value 0.366, p-value 0.005). An inverse correlation was found between subcutaneous fat expression of SIRT1 and myocardial performance index (R-value-0.236, p-value 0.002). Conclusion: In obese patients with pre-diabetic condition a metformin therapy may reduce inflammation and oxidative stress, and this may be associated with the amelioration of the cardiac performance. Clinical research trial number: NCT03439592.

Keywords: cardiac performance; obesity; pre-diabetes; sirtuin 1; visceral fat.


Figures

Figure 1
Figure 1
Immunohistochemical analysis for Sirtuin 1 (SIRT1). Representative images of SIRT1 detection in subcutaneous abdominal fat from obese patients with pre-diabetic condition and obese patients with normo-glycemic condition. Immunoistochemistry of obese patients with pre-diabetic condition in metformin therapy (group 1, left upper part, A) vs. obese patients with pre-diabetic condition in placebo therapy (group 2, right upper part, B) vs. obese patients with normo glycemic condition (group 3, in the left inferior part, C); In the right inferior part (D), bar graph expression and matched western blot expression of SIRT1 in obese patients with pre-diabetic condition in metformin therapy (group 1, red color), obese patient with pre-diabetic condition in placebo therapy (group 2, gray color), and obese patients with normo glycemic condition(group 3, green color). Protein levels determined by Western blot analysis of adipose abdominal tissue homogenates from obese patients with normo-glycemic condition and obese patients with pre-diabetic condition. Inset, representative image of Western blot analysis (D). Lanes 1, obese patient with pre-diabetic condition in metformin therapy (group 1). Lanes 2, obese patient with pre-diabetic condition in placebo therapy (group 2). Lanes 3, obese patient with normo-glycemic condition (group 3). Results are mean ± SD of 5 independent experiments. Group 1 vs. group 3, *P <0.05; group 2 vs. group 3, **p <0.05.
Figure 2
Figure 2
Immunohistochemical analysis for Fas. Representative images of Fas detection in subcutaneous abdominal fat from obese patient with pre-diabetic condition and obese patient with normo-glycemic condition. Immunoistochemistry of obese patient with pre-diabetic condition in metformin therapy (group 1, left upper part, A) vs. obese patient with pre-diabetic condition in placebo therapy (group 2, right upper part, B) vs. obese patient with normo glycemic condition (group 3, in the left inferior part, C); In the right inferior part (D), expression of FAS in obese patient with pre-diabetic condition in metformin therapy (group 1, red color), obese patient with pre-diabetic condition in placebo therapy (group 2, gray color), and in obese patient with normo glycemic condition (group 3, green color). Results are mean ± SD of 5 independent experiments. Results are mean ± SD of 5 independent experiments. Group 1 vs. group 3, *P <0.05; group 2 vs. group 3, **p <0.05.
Figure 3
Figure 3
Immunohistochemical analysis for Interleukine 6 (IL6). Representative images of IL6 immunohistochemical detection in subcutaneous abdominal fat from obese patients with pre-diabetic condition and obese patient with normo-glycemic condition. Immunoistochemistry of obese patient with pre-diabetic condition in metformin therapy (group 1, left upper part, A) vs. obese patient with pre-diabetic condition in placebo therapy (group 2, right upper part, B) vs. obese patient with normo glycemic condition (group 3, in the left inferior part, C); In the right inferior part (D), expression of IL6 in obese patient with pre-diabetic condition in metformin therapy (group 1, red color), obese patient with pre-diabetic condition in placebo therapy (group 2, gray color), and in obese patient with normo glycemic condition (group 3, green color). Results are mean ± SD of 5 independent experiments. Group 1 vs. group 3, *P <0.05; group 2 vs. group 3, **p <0.05.
Figure 4
Figure 4
Immunohistochemical detection of Nuclear Factor kappa-light-chain-enhancer of activated B cells (NFkB). Immunohistochemistry of obese patients with normo glycemic condition (group 3, in left upper part, A) vs. obese patient with pre-diabetic condition in metformin therapy (group 1, right upper part, B) vs. obese patient with pre-diabetic condition in placebo therapy (group 2, left lower part, C); In the right inferior part (D), bar graph expression and matched western blot expression of NFkB in obese patient with pre-diabetic condition in metformin therapy (group 1, red color), obese patient with pre-diabetic condition in placebo therapy (group 2, gray color), and obese patient with normo glycemic condition (group 3, green color). Protein levels are determined by Western blot analysis of adipose abdominal tissue homogenates from obese patients with normo-glycemic conditionand obesepatients with pre-diabetic condition. Inset, representative image of Western blot analysis (D). Lanes 1, obese patient with pre-diabetic condition in metformin therapy (group 1). Lanes 2, obese patient with pre-diabetic condition in placebo therapy (group 2). Lanes 3, obese patient with normo-glycemic condition (group 3). Results are mean ± SD of 5 independent experiments. Group 1 vs. group 3, *P <0.05; group 2 vs. group 3, **p <0.05.
Figure 5
Figure 5
Immunohistochemical detection of Nitrotyrosine. Representative images of Nitrotyrosine immunohistochemical detection in subcutaneous abdominal fat from obese patients with pre-diabetic condition and obese patients with normo-glycemic condition. Immunoistochemistry of obese patients with normo glycemic condition (group 3, in theleft upper part, A) vs. obese patients with pre-diabetic condition in metformin therapy (group 1, right upper part, B) vs. obese patient with pre-diabetic condition in placebo therapy (group 2, left lower part, C); In the right inferior part (D), expression of Nitrotyrosyne in obese patients with pre-diabetic condition in metformin therapy (group 1, red color), obese patient with pre-diabetic condition in placebo therapy (group 2, gray color), and obese patients with normo glycemic condition (group 3, green color). Results are mean ± SD of 5 independent experiments. Group 1 vs. group 3, *P <0.05; group 2 vs. group 3, **p <0.05.
Figure 6
Figure 6
Immunohistochemical detection of Tumor Necrosis factor alpha (TNFα). Representative images of TNFαimmunohistochemical detection in subcutaneous abdominal fat from obese patient with pre-diabetic condition and obese patient with normo-glycemic condition. Immunoistochemistry of obese patient with normo glycemic condition (group 3, in left upper part, A) vs. obese patient with pre-diabetic condition in metformin therapy (group 1, right upper part, B) vs. obese patient with pre-diabetic condition in placebo therapy (group 2, left lower part, C); In the right inferior part (D), expression of TNFα in obese patient with pre-diabetic condition in metformin therapy (group 1, red color), obese patient with pre-diabetic condition in placebo therapy (group 2, gray color), and in obese patient with normo glycemic condition (group 3, green color). Results are mean ± SD of 5 independent experiments. Group 1 vs. group 3, *P <0.05; group 2 vs. group 3, **p <0.05.

References

    1. Abel E. D., Litwin S. E., Sweeney G. (2008). Cardiac remodeling in obesity. Physiol. Rev. 88, 389–419. 10.1152/physrev.00017.2007 - DOI - PMC - PubMed
    1. Alpert M. A. (2001). Obesity cardiomyopathy: pathophysiology and evolution of the clinical syndrome. Am. J. Med. Sci. 321, 225–236. 10.1097/00000441-200104000-00003 - DOI - PubMed
    1. Blüher M., Klöting N., Wueest S., Schoenle E. J., Schön M. R., Dietrich A., et al. . (2014). Fas and FasL expression in human adipose tissue is related to obesity, insulin resistance, and type 2 diabetes. J. Clin. Endocrinol. Metab. 99, E36–E44. 10.1210/jc.2013-2488 - DOI - PubMed
    1. de Simone G., Daniels S. R., Devereux R. B., Meyer R. A., Roman M. J., de Divitiis O., et al. . (1992). Left ventricular mass and body size in normotensive children and adults: assessment of allometric relations and the impact of overweight. J. Am. Coll Cardiol. 20, 1251–1260. 10.1016/0735-1097(92)90385-Z - DOI - PubMed
    1. Dujardin K. S., Tei C., Yeo T. C., Hodge D. O., Rossi A., Seward J. B. (1998). Prognostic value of a Doppler index combining systolic and diastolic performance in idiopathic-dilated cardiomyopathy. Am. J. Cardiol. 82, 1071–1076. 10.1016/S0002-9149(98)00559-1 - DOI - PubMed

Associated data