

The HMGA2-IMP2 Pathway Promotes Granulosa Cell Proliferation in Polycystic Ovary Syndrome
- PMID: 30247605
- PMCID: PMC6753588
- DOI: 10.1210/jc.2018-00544
The HMGA2-IMP2 Pathway Promotes Granulosa Cell Proliferation in Polycystic Ovary Syndrome
Abstract
Context: The high mobility group AT hook 2 (HMGA2) gene was previously identified in a genome-wide association study as a candidate risk gene that might be related to polycystic ovary syndrome (PCOS). Whether HMGA2 contributes to promoting granulosa cell (GC) proliferation in PCOS remains unknown.
Objective: We sought to determine whether HMGA2 is involved in the ovarian dysfunction of PCOS and in the mechanism of increased GC proliferation.
Patients and cells: mRNA expression was analyzed in ovarian GCs from 96 women with PCOS and 58 healthy controls. Immortalized human GCs (KGN and SVOG cells) were used for the mechanism study.
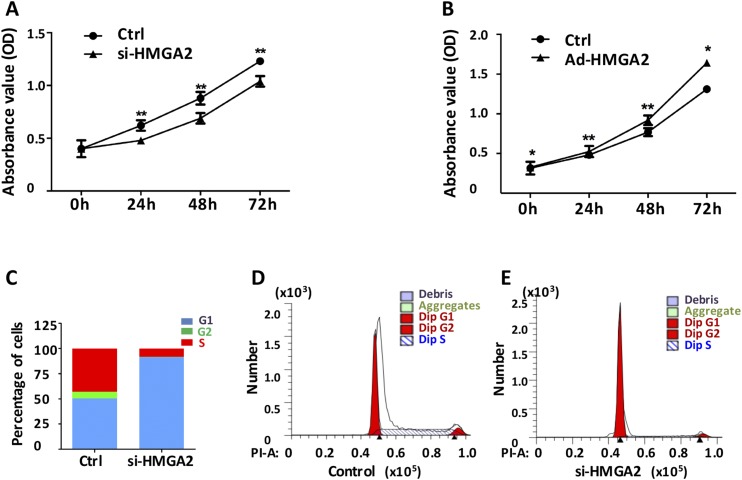
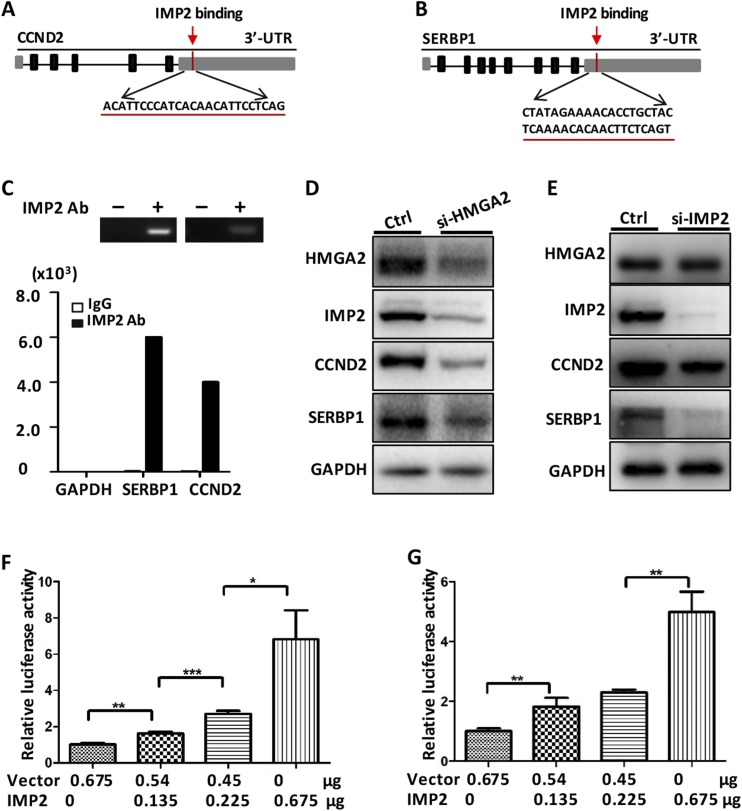
Main outcome measures: mRNA expression in ovarian GCs was measured using quantitative RT-PCR, and KGN cells were cultured for proliferation assays after overexpression or knockdown of target genes. Protein expression analysis, luciferase assays, and RNA binding protein immunoprecipitation assays were used to confirm the mechanism study.
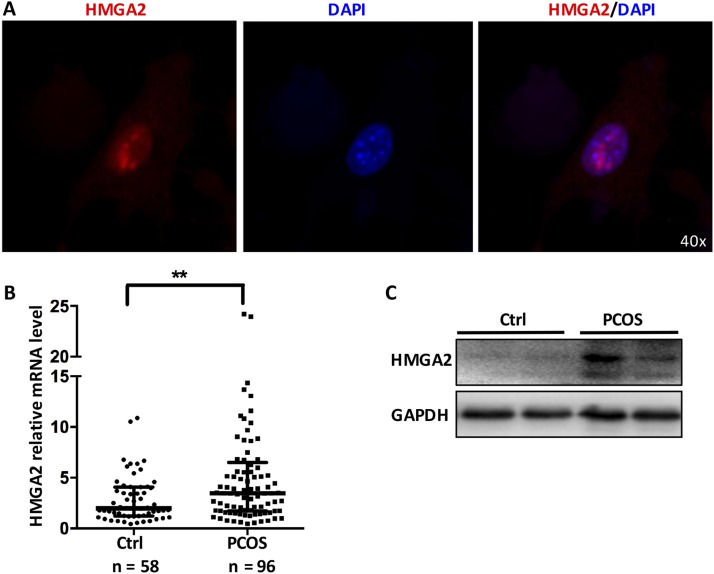
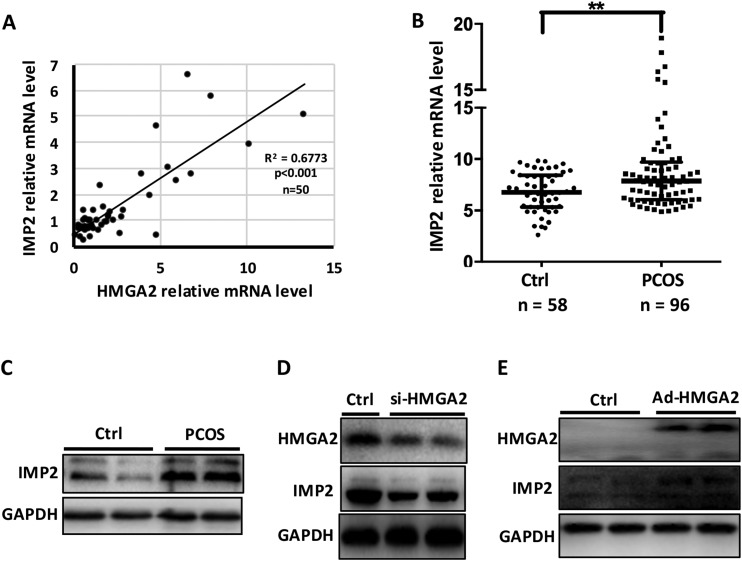
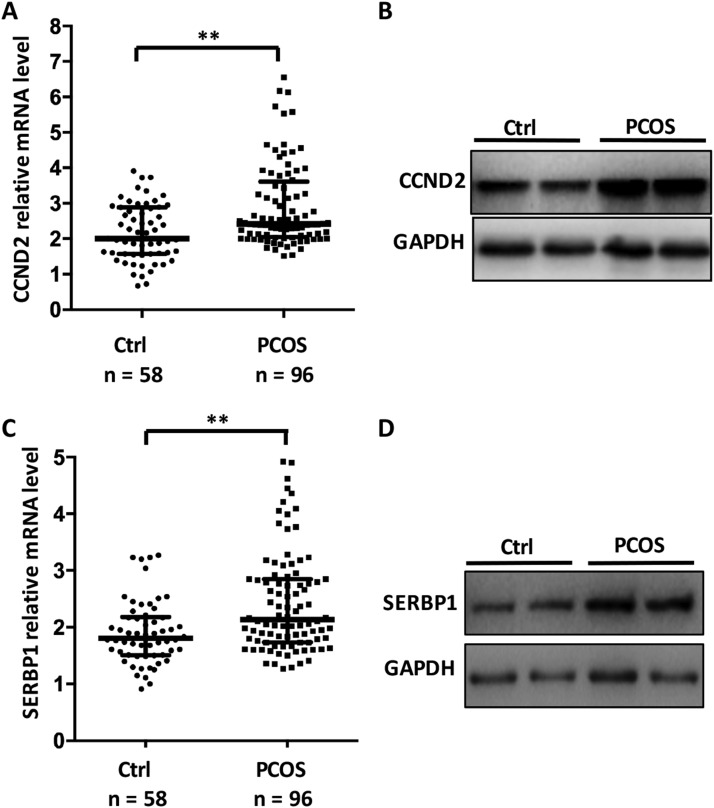
Results: HMGA2 and IGF2 mRNA binding protein 2 (IMP2) were highly expressed in the GCs of women with PCOS, and the HMGA2/IMP2 pathway promoted GC proliferation. Cyclin D2 and SERPINE1 mRNA binding protein 1 were regulated by IMP2 and were highly expressed in women with PCOS.
Conclusions: The HMGA2/IMP2 pathway was activated in women with PCOS and promoted the proliferation of GCs. This might provide new insights into the dysfunction of GCs in PCOS.
Copyright © 2019 Endocrine Society.
Figures

Similar articles
-
MicroRNA let-7i inhibits granulosa-luteal cell proliferation and oestradiol biosynthesis by directly targeting IMP2.Reprod Biomed Online. 2022 May;44(5):803-816. doi: 10.1016/j.rbmo.2022.01.016. Epub 2022 Feb 3. Reprod Biomed Online. 2022. PMID: 35339367
-
MicroRNA-23a-3p overexpression represses proliferation and accelerates apoptosis of granular cells in polycystic ovarian syndrome by targeting HMGA2.Gynecol Endocrinol. 2023 Dec;39(1):2172155. doi: 10.1080/09513590.2023.2172155. Epub 2023 Feb 21. Gynecol Endocrinol. 2023. PMID: 36809792
-
Altered m6 A modification is involved in up-regulated expression of FOXO3 in luteinized granulosa cells of non-obese polycystic ovary syndrome patients.J Cell Mol Med. 2020 Oct;24(20):11874-11882. doi: 10.1111/jcmm.15807. Epub 2020 Sep 1. J Cell Mol Med. 2020. PMID: 32869942 Free PMC article.
-
Programmed cell death 4: A novel player in the pathogenesis of polycystic ovary syndrome.Cell Biochem Funct. 2024 Jan;42(1):e3905. doi: 10.1002/cbf.3905. Epub 2023 Dec 19. Cell Biochem Funct. 2024. PMID: 38115175 Review.
-
The function of exosomes in ovarian granulosa cells.Cell Tissue Res. 2023 Nov;394(2):257-267. doi: 10.1007/s00441-023-03820-3. Epub 2023 Aug 21. Cell Tissue Res. 2023. PMID: 37603064 Review.
Cited by
-
A comprehensive immunohistochemical analysis of IMP2 and IMP3 in 542 cases of ovarian tumors.Diagn Pathol. 2023 Feb 6;18(1):15. doi: 10.1186/s13000-023-01300-4. Diagn Pathol. 2023. PMID: 36740684 Free PMC article.
-
SNAI2-Induced CircMTO1 Promotes Cell Proliferation and Inhibits Apoptosis Through the miR-320b/MCL1 Axis in Human Granulosa-Like Tumor Cells.Front Genet. 2021 Aug 3;12:689916. doi: 10.3389/fgene.2021.689916. eCollection 2021. Front Genet. 2021. PMID: 34413875 Free PMC article.
-
The Role of Genetics, Epigenetics and Lifestyle in Polycystic Ovary Syndrome Development: the State of the Art.Reprod Sci. 2022 Mar;29(3):668-679. doi: 10.1007/s43032-021-00515-4. Epub 2021 Mar 11. Reprod Sci. 2022. PMID: 33709373 Review.
-
Decreased HAT1 expression in granulosa cells disturbs oocyte meiosis during mouse ovarian aging.Reprod Biol Endocrinol. 2023 Oct 31;21(1):103. doi: 10.1186/s12958-023-01147-w. Reprod Biol Endocrinol. 2023. PMID: 37907924 Free PMC article.
-
Hyperandrogen-induced imbalance of FOXO4-AR regulatory loop contributes to ovulatory disorders in polycystic ovary syndrome.Mol Ther Nucleic Acids. 2025 Apr 20;36(2):102543. doi: 10.1016/j.omtn.2025.102543. eCollection 2025 Jun 10. Mol Ther Nucleic Acids. 2025. PMID: 40520361 Free PMC article.
References
-
- Ehrmann DA, Barnes RB, Rosenfield RL, Cavaghan MK, Imperial J. Prevalence of impaired glucose tolerance and diabetes in women with polycystic ovary syndrome. Diabetes Care. 1999;22(1):141–146. - PubMed
-
- Chen ZJ, Zhao H, He L, Shi Y, Qin Y, Shi Y, Li Z, You L, Zhao J, Liu J, Liang X, Zhao X, Zhao J, Sun Y, Zhang B, Jiang H, Zhao D, Bian Y, Gao X, Geng L, Li Y, Zhu D, Sun X, Xu JE, Hao C, Ren CE, Zhang Y, Chen S, Zhang W, Yang A, Yan J, Li Y, Ma J, Zhao Y. Genome-wide association study identifies susceptibility loci for polycystic ovary syndrome on chromosome 2p16.3, 2p21 and 9q33.3. Nat Genet. 2010;43(1):55–59. - PubMed
-
- Shi Y, Zhao H, Shi Y, Cao Y, Yang D, Li Z, Zhang B, Liang X, Li T, Chen J, Shen J, Zhao J, You L, Gao X, Zhu D, Zhao X, Yan Y, Qin Y, Li W, Yan J, Wang Q, Zhao J, Geng L, Ma J, Zhao Y, He G, Zhang A, Zou S, Yang A, Liu J, Li W, Li B, Wan C, Qin Y, Shi J, Yang J, Jiang H, Xu JE, Qi X, Sun Y, Zhang Y, Hao C, Ju X, Zhao D, Ren CE, Li X, Zhang W, Zhang Y, Zhang J, Wu D, Zhang C, He L, Chen ZJ. Genome-wide association study identifies eight new risk loci for polycystic ovary syndrome. Nat Genet. 2012;44(9):1020–1025. - PubMed
-
- Reeves R, Nissen MS. The A.T-DNA-binding domain of mammalian high mobility group I chromosomal proteins: a novel peptide motif for recognizing DNA structure. J Biol Chem. 1990;265(15):8573–8582. - PubMed
Publication types
MeSH terms
Substances
Grants and funding
LinkOut - more resources
Full Text Sources
Other Literature Sources
Medical
Research Materials
Miscellaneous
